
SURVEYS
THINGS TO BE AWARE OF WHEN USING A SURVEY
CREATING AND DISTRIBUTING YOUR SURVEY
Identify the Objectives of Your Study
Determine Now How You Will Analyze Your Data
Considerations When Choosing a Survey Distribution Method
DATA ANALYSIS AND INTERPRETATION
CASE STUDY: USING ONLINE SURVEYS TO QUANTIFY USABILITY ISSUES
Introduction
Surveys can be an extremely effective way to gather information about your users. A well-designed survey can enable you to gather a plethora of information that can help you to design a product that will meet your users’ needs. The problem is that a valid and reliable survey can be very difficult to design; yet surveys are perceived as very easy to create. It’s just a bunch of questions right? Well yes, but the questions you choose and how you ask them are critical. A poorly designed survey can provide meaningless or – even worse – inaccurate information. In this chapter, we hope to enlighten you about this process. Surveys can provide you with great data, but you must be familiar with the rules of creation, collection, and analysis. In this chapter, we cover the key topics that are important to consider when designing a survey and analyzing the data. In addition, we share an industry case study with you to show how a survey was used by eBay to collect user requirements.
When Should You Use a Survey?
Whether it is for a brand new product or a new version of a product, a survey can be a great way to start your user requirements gathering. In the case of a new product, surveys can be used to:
![]() Help you identify your potential user population
Help you identify your potential user population
![]() Find out what they want and need in the product you are proposing
Find out what they want and need in the product you are proposing
![]() Find out at a high level how they are currently accomplishing their tasks.
Find out at a high level how they are currently accomplishing their tasks.
In the case of an existing product, a survey can help you to:
![]() Learn about the user population and their characteristics
Learn about the user population and their characteristics
![]() Find out users’ likes and dislikes about the current product
Find out users’ likes and dislikes about the current product
Also, whether it’s for a new or existing product, surveys are a way to reach a larger number of people than the other methods typically allow. Surveys can be provided to users as a standalone usability activity or as a supplement to other user activities (e.g., following a card sort).
Things To Be Aware of When Using a Survey
As with any user requirements technique, there are always factors that you must be aware of before you conduct a survey study.
Response Bias
A survey relies on self-reports. Sometimes respondents may answer questions based on how they think they should be answered, rather than truly expressing their own opinions. This phenomenon of providing socially desirable answers rather than truthful answers is known as social desirability.
Social desirability tends to be more of a problem in interviews rather than surveys, because surveys are usually anonymous whereas in an interview the interviewee must answer directly to the interviewer. However, it is still a factor that one must be aware of in surveys. Also, in most cases, surveys designed for product development will not contain questions that are deemed socially intrusive. If you are able to provide your respondents with complete anonymity, this will decrease the impact of response bias.
Response Rate
The unfortunate reality of surveys is that not everyone is going to respond. Experienced survey researchers give response rate estimates of anywhere between 20% and 60%. In our experience, you are likely to get a response rate closer to 20%, unless you have a very small, targeted population that has agreed to complete your survey ahead of time. However, there are some things you can do to improve the response rate.
![]() Include a personalized cover letter or header at the top of the survey to provide information about the purpose of the study and how long it will take.
Include a personalized cover letter or header at the top of the survey to provide information about the purpose of the study and how long it will take.
![]() Reduce the number of open-ended questions.
Reduce the number of open-ended questions.
![]() Make the survey attractive and easy to comprehend.
Make the survey attractive and easy to comprehend.
![]() Make the survey as easy to complete and return as possible. For example, if you are sending surveys in the mail, include a self-addressed envelope with pre-paid postage.
Make the survey as easy to complete and return as possible. For example, if you are sending surveys in the mail, include a self-addressed envelope with pre-paid postage.
![]() Follow up with polite reminders.
Follow up with polite reminders.
![]() Consider offering a small incentive for their time. For example, we like to offer participants a $5 coffee card for completing a survey. It may not seem like much but you would be surprised at how the response rates skyrocketed once the coffee card was offered.
Consider offering a small incentive for their time. For example, we like to offer participants a $5 coffee card for completing a survey. It may not seem like much but you would be surprised at how the response rates skyrocketed once the coffee card was offered.
![]() Contacting non-respondents in multiple modes has been shown to improve response rates. For example, if potential respondents were initially contacted via e-mail, try contacting the non-respondents via the phone.
Contacting non-respondents in multiple modes has been shown to improve response rates. For example, if potential respondents were initially contacted via e-mail, try contacting the non-respondents via the phone.
Creating and Distributing Your Survey
Before you begin any user requirements activity there are a number of things you must be familiar with. Because these elements are common to all user requirements activities they have all been covered in the earlier chapters, but now is a good time to double-check the list. If you are not familiar with one of the items you can refer to the earlier chapter to brush up or familiarize yourself with that element.
Chapter 1: Introduction to User Requirements
![]() Getting stakeholder buy-in for your activity (see page 14)
Getting stakeholder buy-in for your activity (see page 14)
Chapter 2: Before You Choose an Activity
Chapter 3: Ethical and Legal Considerations
![]() see page 94
see page 94
Chapter 5: Preparing for Your User Requirements Activity
One of the biggest misconceptions about a survey is the speed with which you can prepare for, collect, and analyze the results. A survey can be an extremely valuable method, but it takes time to do it correctly. In this section we will discuss the preparation required for this user requirements method.
Preparation Timeline
Table 8.1 contains approximate times based on our personal experience and should be used only as a guide. If you are new to survey design the length estimate will likely be much longer. For example, it may take you double the time to create the questions, build the survey, and analyze the data. In addition, the length of time for each step depends on a variety of factors – such as responsiveness of the product team, access to users, and resources available.

Surveys require significant preparation. Below, we discuss how to compose your questions, build your survey, and then pilot the survey.
Identify the Objectives of Your Study
Do not just jump in and start writing your survey. You need to do some prep work. Ask yourself:
![]() Who is the survey for? (Refer to Chapter 2, Before You Choose an Activity, “Learn About Your Users” section, page 41.)
Who is the survey for? (Refer to Chapter 2, Before You Choose an Activity, “Learn About Your Users” section, page 41.)
![]() What information are you looking for (i.e., what questions are you trying to answer)?
What information are you looking for (i.e., what questions are you trying to answer)?
![]() How will you distribute the survey and collect responses?
How will you distribute the survey and collect responses?
It is important to come up with answers to these questions and to document your plan. As with all user requirements activities, you should write a proposal that clearly states the objectives of your study. (Refer to Chapter 5, Preparing for Your User Requirements Activity, “Creating A Proposal” section, page 146 for a discussion on creating proposals.) The proposal should also explicitly state the deliverables and include a timeline. Because you normally want to recruit a large number of participants (20–30 or more), it can be resource-intensive to conduct a survey study. There are more participants to recruit and compensate, as well as more data to analyze than for most user requirements activities. As a result, it is important to get your survey right the first time and get sign-off by all stakeholders. A proposal can help you do this.
Players in Your Activity
As with every user requirements activity, there are players involved in the execution of the activity. However, a survey is different from the other activities described in this book because – unless it is a part of another activity – you are typically not present as the survey is completed. As a result, there is no moderator, no scribe, no videographer, etc. The players are your participants, but now we will refer to them as respondents.
The first thing to determine is the user profile (refer to Chapter 2, Before You Choose an Activity, “Learn About Your Users” section, page 41). Who do you plan to distribute this survey to? Are they the people registered with your travel website? Are they using your product? Are they a specific segment of the population (e.g., college students)? Who you distribute your survey to should be based on what you want to know. The answers to these questions will impact the questions you include.
For example, let’s say that the hypothetical website TravelSmart.com plans to add some new functionality to its website and their objective is to see what users think of this proposed functionality before it is created. A good target audience might be those registered with the website. Let’s suppose that as a part of the TravelSmart.com registration process, users indicate whether they are willing to receive e-mail from your company. You can e-mail a survey to everyone that indicated they are interested in receiving e-mail from TravelSmart.com. Alternatively, you may choose to randomly invite people using your site to complete your survey via a pop-up that is triggered to appear at a certain frequency from a given page on the site.
In the product development world, usability professionals usually target 20–30 responses per user type. If you are able to get more participants that is great, and we definitely encourage you to do so; but the reality is that time and resources may prevent you from doing so (refer to Chapter 5, Preparing for Your User Requirements Activity, “How Many Participants Do I Need?” section, page 157 for a more detailed discussion of sample size.)
Compose Your Questions
This is the most important part of the process. You need to determine what information you need, and how to ask the right questions. Recommendations in this section will also help increase completion rates for your survey. This stage is the same regardless of how you plan to distribute your survey (e.g., paper, web). However, the formatting of your questions may vary depending on the distribution method. The stage of “building” your survey and the impact of different distribution methods is discussed later in this chapter.
Keep It Short
One of the key pieces of advice is to keep the survey short. If you ignore this rule, you are doomed to fail because no one will take the time to complete your survey. The general rule is no more than two, nicely spaced, sides of a single sheet of paper. A dense two-page survey is actually worse than a five-page survey with the questions well spaced. Dense surveys take longer to read and it can be difficult to distinguish between questions. And you should stick to a 12-point font. For web surveys, the guideline of 20–25 questions is often provided. In terms of time, 20 minutes is the most you want people to spend completing your survey. If you can adhere to these rules then your survey will have a much greater chance of being completed. Following the steps described below of brainstorming and then reducing your question set will help you achieve this.
Brainstorm initial questions
Start with brainstorming of all the potential questions that you might like to ask. As with any brainstorm, begin by blue-skying it (i.e., anything is possible). Once you have your complete list, only then begin to narrow down the set. By approaching survey development in this manner (rather than coming up with 20 questions and thinking you are done), you will make sure that all the critical questions are identified in time to include them in the study. It is great to go through this process with all team members who have a stake in the survey (refer to Chapter 1, Introduction to User Requirements, “Preventing Resistance” section, page 18). Working alongside stakeholders, you will be able to hit on all the important areas where you need to get answers.
It is a good idea to write the potential questions on a whiteboard or flip chart as they are generated. Keep them in view of the stakeholders at all times so they can review them and think of new ideas or to make sure that nothing has been missed. Don’t worry about the exact wording of the questions at this point. Also, don’t worry about the format of the questions yet (e.g., multiple-choice, open-ended). There will be time to deal with this important issue later.
Reduce the initial question set
It is now time to reduce your initial question set. This is the tough part. Continue to work as a group to do this. If you have taken your blue sky to the limit, some of the questions may be eliminated quickly. Put an X next to the questions as they are eliminated. Don’t erase them since you may change your mind later.
When it becomes difficult to reduce the question set, for each question ask: “How will the answer to this question inform our study objectives?” If it won’t, then eliminate it. Some questions may provide interesting information, but if it is not going to aid your product’s design or development, then drop it. Let’s say the key objective of your study is to decide whether or not to implement a “best price guaranteed” policy. As a member of the TravelSmart.com team, you may want to ask respondents their occupation. This might be interesting information to have; but if whether someone is a doctor, a mechanic, or a teacher has nothing directly to do with your study objective, it would be an easy one to eliminate. However, a question such as “Do you ever shop around at multiple websites for the best travel prices?” would be kept because it fulfils the key objective. The answer to this question could impact your decision of whether or not to implement the “best price guaranteed” policy that you are considering.
If you are still above the limit for the number of questions, an additional method for narrowing down your list is to look at the time to implement. All of the questions may impact the design of your product, but if some of them will impact versions further down the line, those can be put aside. It is better to limit the range of the questions to immediate impact and get a large number of responses, rather than covering a broader product impact and reducing the number of completed surveys.
As a final resort, rate the questions. Give each person on the brainstorming team a collection of colored stickers, and tell them they can assign their vote to each question. Green stickers count for 3 votes, yellow for 2, and red for 1. Everyone goes to the wall and sticks stickers on the questions they value most – it’s a vote. At the end you take the top 15-20 questions with the most votes, but the team has all participated in the process and owns it.
Asking Sensitive Questions
Both interviews and surveys have pros and cons with regard to asking sensitive questions. In an interview, you have the opportunity to develop a rapport with the respondent and gain his or her trust. But even if the respondent does trust you, he/she may not feel comfortable answering the question in person. If your survey is anonymous, it is often easier to discuss sensitive topics that would be awkward to ask face to face (e.g., age, salary range). However, even in anonymous surveys, people may balk at being asked for this type of information.
Ask yourself whether you really need the information – that it is not just out of curiosity or because you think the question is “standard.” If the answers to these questions will help you better understand your user population and therefore your product, provide a little verbiage with the question to let respondents know why you need this information. For example: “To help us improve our incentive program, we would like to know the following information.” Above all, never make these fields “required” or “mandatory” for completion in a survey. Participants will either refuse to complete your survey or they will purposely provide inaccurate information just to move forward with the survey. Finally, do not ask these questions toward the front of the survey as they might turn some people off immediately. Wait until you have their trust and they have put some time into answering the other questions.
Question Format and Wording
Once you have come up with your list of questions, you will need to determine their wording and format. By “format” we are referring to how the respondents are expected to respond to the question, as well as the layout and structure of your survey. Participants are far more likely to respond when they perceive your survey as clear, understandable, concise, of value, and of interest. The questions and how they are presented are key in accomplishing this.

Based on an illustration from The Christian Science Monitor. www.csmonitor.com
Response format
For each of your questions you must decide the format in which you want the participant to respond. One of the first things you need to determine is whether the questions will be open-ended or closed-ended. Open-ended questions allow the users to compose their own responses; for example: “What are the features that are most important to you in a travel website?” Closed-ended questions require participants to answer the questions by either:
One of the advantages of open-ended questions is that they are much easier to create. As a result, inexperienced survey creators are often tempted to use them for the bulk of their survey. However, in the world of survey design, open-ended questions typically do not fare well, for a number of reasons:
![]() Open-ended questions make data analysis tedious and complex.
Open-ended questions make data analysis tedious and complex.
![]() Because respondents use their own words/phrases/terms, responses can be difficult to comprehend and you typically will not have an opportunity to follow up and clarify with the person who responded.
Because respondents use their own words/phrases/terms, responses can be difficult to comprehend and you typically will not have an opportunity to follow up and clarify with the person who responded.
![]() They can make the survey longer to complete, thereby decreasing the return rate.
They can make the survey longer to complete, thereby decreasing the return rate.
The bottom line is, do not ask essay questions. A survey that asks the user to make only check marks or write single rating digits has a much higher chance of being completed and returned. As a result, we do not recommend using open-ended questions at all in surveys, unless the input is limited to very brief and simple answers; for example: “Which cities have you flown to in the past 2 years?”
Since open-ended questions are best reserved for interviews, refer to Chapter 7 to learn more about wording those questions (see Chapter 7, Interviews, “Write the Questions” section, page 262).
There are three main types of closed-ended question responses to choose from: multiple-choice, rating scales, and ranking scales. Each serves a different purpose but all provide data that can be analyzed quantitatively.
Multiple-choice questions
Participants are provided with a question that has a selection of pre-determined responses to choose from. In some cases, participants are asked to select multiple responses and in other cases they are asked to select single responses.
![]() Multiple-response. Participants can choose more than one response from a list of options. For example:
Multiple-response. Participants can choose more than one response from a list of options. For example:
![]() Single-response. Participants are provided with a set of options from which to choose only one answer. For example:
Single-response. Participants are provided with a set of options from which to choose only one answer. For example:
![]() Binary. As the name implies, the respondent must select from only two options. For example: “Yes/No,” “True/False,” or “Agree/Disagree.” This is not just a type of single-response question. With single-response questions, you want to provide respondents with the most likely options to choose from. You are acknowledging that the answer may not be black or white. With binary questions, you are forcing participants to drop all shades of gray and pick the answer that best describes their situation or opinion. It is very simple to analyze data from these types of questions, but you introduce error by not better understanding some of the subtleties in their selection. For example, someone may have no opinion, or may partially agree and disagree.
Binary. As the name implies, the respondent must select from only two options. For example: “Yes/No,” “True/False,” or “Agree/Disagree.” This is not just a type of single-response question. With single-response questions, you want to provide respondents with the most likely options to choose from. You are acknowledging that the answer may not be black or white. With binary questions, you are forcing participants to drop all shades of gray and pick the answer that best describes their situation or opinion. It is very simple to analyze data from these types of questions, but you introduce error by not better understanding some of the subtleties in their selection. For example, someone may have no opinion, or may partially agree and disagree.
Rating scales
There are a variety of scale questions that can be incorporated into surveys. Likert and ranking are two of the more common scales. For a detailed discussion of the many scales that can be used in survey design, consult Alreck and Settle’s book The Survey Research Handbook (see “Suggested Resources for Additional Reading,” page 315).
The Likert scale is the most frequently used rating scale. Participants are provided with a scale and asked to select the most appropriate rating. Providing five to nine levels in the Likert scale is recommended. You may wish to provide anchors for every number, or anchor only the end points. You should also consider whether or not to allow a middle-position for users to settle on a neutral point. Some usability professionals prefer to remove the neutral point since they believe that people tend to gravitate towards neutral positions and they want to force respondents to come down on one side of the fence or the other. Be aware that if a participant truly does not have a preference one way or the other, forcing him/her to make a choice will introduce error into your results.
Below is an example of a Likert scale with a middle-point and two anchors.

Another type of rating scale question asks users to give a priority rating for a range of options. For example:
In this rating question, you are not comparing the options given against one another. As a result, more than one option can have the same rating.
Ranking scales
This type of scale question gives participants a variety of options and asks them to provide a rank for each one. Unlike the rating scale question, the respondent is allowed to use each rank only once. In other words, the respondent cannot state that all four answers are “most important.” For example:
The rank scale differs from a rating scale presented above because the respondent is comparing the options presented against one another to come up with a unique ranking for each option.
Avoiding Pitfalls
When selecting the answers for a respondent to choose from (regardless of the type of question format), avoid vague options like “few,” “many,” and “often.” Participants will differ in their perception of those options and it will be difficult for you to quantify them when you analyze the data.
In addition, if you are providing a range of answers to choose from, it is best to keep ranges equal in size and never allow the ranges to overlap (e.g., “0–4,” “5–10,” “11–15”).
You should consider providing an “out” option to respondents on each question. This could include “None of the above,” “No opinion,” “Not applicable,” and “Other.” It is possible that you did not think of all the possible options that a participant may want to choose from. If you provide “Other” as an option, you may wish to provide a blank space for the participant to insert his/her own answer. This changes the question from closed-ended to open-ended. You will likely have to analyze the free-response answers by hand, but it is worth it to learn what options you may have missed.
Question wording
Your choice of words for survey questions is critical. The wording of survey questions can impact peoples’ responses. Whether your questions are open-ended or closed-ended, they should be clear and unbiased. For a detailed discussion of question wording, see Chapter 7, Interviews, “Write the Questions,” page 262. Figure 8.1 is a summary of dos and don’ts to consider when wording your survey questions.

Standard Items to Include
There are certain elements that every survey should contain, regardless of topic or distribution method.
Title
Give every survey a title. The title should give the participant a quick sense of the purpose of the survey (e.g., “TravelSmart.com Customer Satisfaction Survey”). Keep it short and sweet. If you can think of a name to entice respondents, that is even better.
Instructions
Include any instructional text that is necessary for your survey as a whole or for individual questions. The more explicit you can be, the better. For example, instructions that apply to the whole survey might be: “Please complete all of the following questions and return the completed survey in the enclosed self-addressed, postage-paid envelope.” An instruction that applies to an individual question might read: “Of the following, check the one answer that most applies to you.” Of course, you want to design the survey form and structure so that the need for instructions is minimized. A lengthy list of instructions either won’t be read or will inhibit potential respondents from completing the survey.
Contact information
There are many reasons why you should include contact information on your surveys. If a potential respondent has a question prior to completing the survey (e.g., When is it due? What is the compensation? Who is conducting the study?), he/she may choose to skip your survey if your contact information is not available.
Others may have questions in the middle of the survey. If the survey was distributed via the web or e-mail, then an e-mail contact address would be a safe choice. If you have distributed your survey via the mail, provide a phone number as contact information, unless you are certain that your user population has e-mail access. It is important to note that this could be a problem for surveys sent out to a very large audience. If 5% of the respondents have questions and the survey went out to 10,000 people, then you would get 500 requests to answer. You would need to have someone devoted to make sure requests are responded to. It is a much better idea to test your survey extensively if it is going out to large numbers. But providing an option for questions would be reasonable for surveys going out to a small audience (100–200).
If your survey was distributed via mail with a self-addressed envelope, it is still wise to include the return address on the survey itself. Without a return address on the survey, if the return envelope is lost, people will be unable to respond. And last but not least, providing your contact information lends legitimacy to the survey.
Purpose
In a line or two, tell participants why you are conducting the survey. Ethically, they have a right to know (refer to Chapter 3, Ethical and Legal Considerations, “The Right To Be Informed” section, page 97). Also, if you have a legitimate purpose, it will attract respondents and make them want to complete the survey. A purpose could read something like:
“TravelSmart.com is conducting this survey because we value our customers and we want to learn whether our travel site meets their needs, as well as what we can do to improve our site.”
Time to complete
People will want to know at the beginning how long it will take to finish the survey before they invest their time into it. You don’t want respondents to quit in the middle of your 15-minute survey because they thought it would take five minutes and now they have to run to a meeting. It is only fair to set people’s expectations ahead of time and respondents will appreciate this information. If you do not provide it, many potential respondents will not bother with your survey because they do not know what they are getting into.
Confidentiality and anonymity
Data collected from respondents should always be kept confidential, unless you explicitly tell them otherwise (refer to Chapter 3, Ethical and Legal Considerations, “Anonymity” section, page 100). Confidentiality means that the person’s identity will not be associated in any way with the data provided. You should make a clear statement of confidentiality at the beginning of your survey.
Anonymity is different from confidentiality. If a respondent is anonymous, it means that even you, the researcher, cannot associate a completed survey with the respondent’s identity. Make sure that you are clear with respondents about the distinction. Web surveys, for example, are typically confidential but not anonymous. They are not anonymous because you could trace the survey (via an IP address) back to the computer from which it was sent. This does not necessarily mean that the survey is not anonymous because someone may use a public computer, but you cannot make this promise in advance. So just be sure ahead of time that you can adhere to any confidentiality and/or anonymity statements that you make.
Determine Now How You Will Analyze Your Data
Those who are new to survey methodologies have a tendency to wait until the data has been collected before they consider how it will be analyzed. An experienced usability professional will tell you that this is a big mistake. It can cost you valuable time after the responses have been collected and you may end up ignoring some of your data because you are not sure what to do with it or you do not have the time required to do the analysis that is necessary.
By thinking about your data analysis before you distribute your survey, you can make sure that your survey contains the correct questions and you will be able to answer some key questions for yourself.
![]() What kind of analysis do you plan to perform? Go through each question and determine what you will do with the data. Identify any comparisons that you would like to make and document this information. This can impact the question format.
What kind of analysis do you plan to perform? Go through each question and determine what you will do with the data. Identify any comparisons that you would like to make and document this information. This can impact the question format.
![]() Are there questions that you do not know how to analyze? Perhaps you should remove them. If you keep them in your survey, you will know going into the analysis that you will need to do some research or contact a statistical professional.
Are there questions that you do not know how to analyze? Perhaps you should remove them. If you keep them in your survey, you will know going into the analysis that you will need to do some research or contact a statistical professional.
![]() Will the analysis provide you with the answers you need? If not, perhaps you are missing questions.
Will the analysis provide you with the answers you need? If not, perhaps you are missing questions.
![]() Do you have the correct tools to analyze the data? If you plan to do data analysis beyond what a spreadsheet can normally handle (e.g., beyond means, standard deviations), you will need a statistical package like SPSS™ or SAS™. If your company does not have access to such a tool and will need to purchase it, keep in mind that it may take time for a purchase order or requisition to go through. You don’t want to hold up your data analysis because you are waiting for your manager to give approval to purchase the software you need. In addition, if you are unfamiliar with the tool, you can spend the time you are waiting for the survey data to come in to learn how to use the tool.
Do you have the correct tools to analyze the data? If you plan to do data analysis beyond what a spreadsheet can normally handle (e.g., beyond means, standard deviations), you will need a statistical package like SPSS™ or SAS™. If your company does not have access to such a tool and will need to purchase it, keep in mind that it may take time for a purchase order or requisition to go through. You don’t want to hold up your data analysis because you are waiting for your manager to give approval to purchase the software you need. In addition, if you are unfamiliar with the tool, you can spend the time you are waiting for the survey data to come in to learn how to use the tool.
![]() How will the data be entered into the analysis tool? This will help you budget your time. If the data will be entered manually, allot more time. If the data will be entered automatically via the web, you will need to write a script. If you don’t know how to do this, it may take time to learn.
How will the data be entered into the analysis tool? This will help you budget your time. If the data will be entered manually, allot more time. If the data will be entered automatically via the web, you will need to write a script. If you don’t know how to do this, it may take time to learn.
By answering these questions early on, you will help ensure that the data analysis goes smoothly. This really should not take a lot of time, but by putting in the effort up front, you will also know exactly what to expect when you get to this stage of the process and you will avoid any headaches, lost data, or useless data.
Summary for Composing Your Questions
We have provided a lot of information to keep in mind when creating your survey. Figure 8.2 references the key points for convenience.


Building the Survey
Now that you have composed your questions, you can move on to the next stage, which is building the survey in the format in which it will be distributed (e.g., paper, web, e-mail). There are a number of common elements to keep in mind when building your survey, regardless of the distribution method. These will be discussed first. Then we look at elements unique to each distribution method.
Common Survey Structure Elements
How your survey is constructed is just as important as the questions that it contains. There are ways to structure a survey to improve the response rate and reduce the likelihood that respondents will complete the survey incorrectly.
Reduce clutter
Whether you are creating your survey electronically or on paper, avoid clutter. The document should be visually neat and attractive. Think minimalist. Include a survey title and some instructional text, but avoid unnecessary headers, text, lines, borders, boxes, etc. As we mentioned earlier, it is imperative that you keep your survey short. Adhering to the rule of two sides of a single sheet of paper does not mean that you should jam as many questions onto each side as possible. Provide sufficient white space to keep the survey readable and one question distinguishable from another. Strike a balance between the amount of white space and the need to include all of your questions.
Color selection
Do not go crazy with color. You do not want a loud and vibrant survey or one that has a plethora of different colors. It should be pleasing to the eye but simple. Use a neutral color for the background (white or beige) and then choose a color with high contrast to the background for your questions. Black on white is always a safe choice. You may want to throw in one additional color to draw participants’ attention to certain things such as required fields or instructional text, but keep in mind participants who are color-blind. You can use bold and/or underline to effectively differentiate elements if necessary, rather than using additional colors.
Font selection
You may be tempted to choose a small font size so that you can fit in more questions, but this is not advisable. If your population includes those over 45 years of age, a small font size will not be appreciated. A 12-point font is the smallest recommended. If you are creating a web survey, choose fonts that are comparable to these sizes. For web surveys, set relative rather than absolute font sizes, so that users can adjust the size via their browsers.
Font style is another important consideration. Choose a font that is highly readable. Standard serif fonts (fonts with tails on the characters, such as Times New Roman), or sans serif fonts (fonts without tails on the characters, such as Arial or Verdana) make for good choices. Avoid decorative or whimsical fonts, for example ![]() and Monotype Corsiva, as they tend to be much more difficult to read. Choose one font style and stick with it.
and Monotype Corsiva, as they tend to be much more difficult to read. Choose one font style and stick with it.
Consistency
To make your survey as easy to use as possible, minimize the number of different types of response formats. You should select the question format that best provides you the information you need but remember that providing several different question formats can confuse respondents.
If you use scales, keep them as consistent as possible. For example, do not make the value “1” represent “Strongly agree” on some scales and “Strongly disagree” on others; this will confuse respondents and potentially introduce errors into your data analysis. Also, if your survey is paper or e-mail-based, reduce the number of branching questions. For example: “If you answered ‘Yes’ to this question, proceed to question 5. If you answered ‘No,’ proceed to question 6.” The more branches that are included, the greater the likelihood that people will make mistakes. If your survey is web-based and you would like to include branching, you can program the survey to advance to the next appropriate question based on the participant’s answer to the previous question.
Use a logical sequence and groupings
Place your questions in a logical order and use groupings that are meaningful. For example, group all of the demographic questions together rather than spreading them throughout the survey. Likewise, keep questions related to a specific feature together. For example, if some of the questions in your survey are related to searching, group them together. This is less confusing for respondents and allows them to concentrate on one topic at a time.
It is also a good idea to start with the simple questions first and then move towards the more complex ones. Let participants start out with the easy stuff to get them into the swing of things. Another strategy is to start with the really interesting questions to draw your respondents in and make them want to complete your survey. You know your users best, so adopt the strategy that you think will work best for them. Again, if you have to include sensitive or personal questions, leave them until the end of the survey.
Considerations When Choosing a Survey Distribution Method
This section discusses a variety of factors that apply to each of the distribution methods. This information should enable you to make the appropriate distribution choice based on your needs. Table 8.2 is a summary.

Cost
It had been found that web-based surveys are cheaper to conduct than paper-based ones. One study found that the average cost of a paper survey was $2.07, while the average cost for the web survey was $0.88 (Schaefer 2001). The cost of e-mail surveys is undetermined. Be aware that spam blockers may prevent some of your e-mail surveys from reaching recipients.
Data Entry
One of the major advantages of a web-based survey is that it assists you in your data entry. With a paper or e-mail survey, when you get your responses, you have to parse the data if it is electronic or manually enter it into your analysis tool or spreadsheet. This method is tedious and is prone to errors during the transition. With a web-based survey, the data can be automatically downloaded into a spreadsheet or data analysis package. This will create tremendous time savings for you and it also reduces the chances for errors.
Interactivity
E-mail and paper-based surveys do not offer interactivity. The interactivity of the web provides some additional advantages.
Validation
The computer can check each survey response for omitted answers and errors when the respondent submits it. For example, it can determine whether the respondent has left any questions blank and provide a warning or error message to make the person aware of this. If a respondent has entered letters in a field that required a numeric response, it can show the error.
Allow for more complex designs
With careful design, a web-based survey can help you to make a detailed or large survey simple from the users’ point of view. For example, it was mentioned earlier that the number of branching questions should be minimized because they can make a survey quite complex. By using the web, you have the ability to include branching questions without the respondent even being aware of the branch (see Figure 8.3).

For example, let’s say that the question asks whether a participant uses public transit and the response to this question will determine the set of questions the person will be required to answer. You could choose a design where once respondents answer the question, they are required to click “Next.” When they click “Next,” they will be seamlessly brought to the next appropriate set of questions based on the response they made on the previous page. The respondents will not even see the questions for the alternative responses.
More intuitive design
Web widgets can help make your survey more intuitive. Widgets such as droplists can reduce the physical length of your survey and can clearly communicate the options available to the user. Radio buttons can limit respondents to one selection, rather than multiple, if required (see Figure 8.4).

Progress indicators
If the survey is broken into multiple pages, status indicators can (and should) be included to let respondents know how far along they are and how many more questions they have left to complete (see Figure 8.5).

Amount of Work for the Respondent
After completing a survey via the web or e-mail, participants simply need to click “Submit” or “Send” and they are done. They do not need to worry about putting the survey in an envelope and dropping it in the mail. By making less work for the participants, you improve your chances of getting more responses.
Data Delivery
Responses are received via the web or e-mail much faster than with the traditional mail survey. You must incorporate the time for the survey to be returned to you via the postal system when using paper-based surveys.
Consistency
By the term “consistency” we are referring to how the participant sees the survey. This is not an issue for paper-based surveys because you have total control over the way the questions appear. In the case of e-mail, participants may have their e-mail program customized so that their e-mail appears in a format that is different from the norm of wrapping text with a white background and black text. You cannot control this and it could possibly impact your results. In the case of the web, you will need to take additional time to ensure that your survey is accessible from all the browser types your population may be using. In the majority of cases, this will be Netscape® and Internet Explorer®. View your survey in both browsers and test the data collection in both. You want your survey to look as consistent as possible in both browsers. If the survey appears or behaves differently in different web browsers, it could impact your results. As with e-mail, you will not be able to control any specific customizations that respondents make to their browsers.
Security
Security is less of a concern for paper and e-mail, but is a major consideration for the web. You must make sure that your data is secure. In most cases, your web-based survey will be outside of a firewall, so it is important to ensure that outsiders cannot access the information you collect. Work with your company’s system administrator to determine whether this will be a problem for you.
Privacy
Respondents may be hesitant to complete your survey because they are concerned about their privacy. This is usually not an issue for a paper-based survey since the person can remain anonymous (other than the postmark on the envelope). In the case of e-mail, privacy is a big issue. The respondent is sending the survey back via an e-mail address that is tied directly to the person. In the case of the web, even though respondents may not be entering their names, you can capture a computer’s IP address and that can make people uncomfortable. Assure respondents up front that all information collected from them will remain confidential and that their information will not be associated with any results or sold to any third parties.
Computer Expertise
Obviously, computer expertise is not an issue for paper-based surveys, but it is an issue for e-mail and, especially, web-based surveys. If your participants have varying levels of computer experience, this could impact your survey results. If your survey has a simple design and uses standard web widgets – such as pull-downs, check boxes, etc. – a low level of web expertise is required. However, if you anticipate that some of your respondents will have very little web experience, consider a paper-based survey.
Distributing Your Survey via the Web, E-mail, or Paper
The mechanism you choose to distribute your survey will depend in many cases on your user type. If you suspect that some potential respondents will not have access to computers, you should avoid an online survey because it will create a sampling bias. A traditional mail survey would be the better choice in this situation. However, if this is not an issue for your user population, we recommend using a web-based survey because it is both cost- and time-effective.
Creating a Web-based Survey
There are a number of things to keep in mind when creating a web-based survey.
![]() When creating a web-based survey, do not begin the process by writing your questions in HTML (hypertext markup language). It takes much more time to make changes in the code than it does in a word processor or on paper.
When creating a web-based survey, do not begin the process by writing your questions in HTML (hypertext markup language). It takes much more time to make changes in the code than it does in a word processor or on paper.
![]() If your survey is longer than a single sheet of paper, you will want to consider breaking it up into multiple pages on your website, rather than having one extremely long scrolling page.
If your survey is longer than a single sheet of paper, you will want to consider breaking it up into multiple pages on your website, rather than having one extremely long scrolling page.
![]() Use “Next” and “Back” navigation to allow respondents to move between the different pages of the survey in case they want to skip sections or go back and make changes.
Use “Next” and “Back” navigation to allow respondents to move between the different pages of the survey in case they want to skip sections or go back and make changes.
![]() Avoid horizontal scrolling. This is frustrating to users and will increase the time necessary to complete the survey.
Avoid horizontal scrolling. This is frustrating to users and will increase the time necessary to complete the survey.
![]() Avoid flashing icons or animations. Your goal is not to make the survey look “cool” but to make it clear and easy to complete. Don’t distract respondents with dancing images. Remember – keep it simple!
Avoid flashing icons or animations. Your goal is not to make the survey look “cool” but to make it clear and easy to complete. Don’t distract respondents with dancing images. Remember – keep it simple!
![]() Include a progress indicator to let respondents know how close they are to completing the survey (see Figure 8.5). Some professionals have the philosophy that if your survey is so many pages that it needs a progress indicator, it’s too long. Instead of using a progress indicator, they say, shorten the survey. In most cases this is likely a valid point; but we have seen surveys where only one question was presented per page due to graphics that were associated with questions. In such cases the progress indicator is useful. It is also a good idea to include a “Save for later” or “Finish later” button so that users can save their work if interrupted in the middle of completing the survey.
Include a progress indicator to let respondents know how close they are to completing the survey (see Figure 8.5). Some professionals have the philosophy that if your survey is so many pages that it needs a progress indicator, it’s too long. Instead of using a progress indicator, they say, shorten the survey. In most cases this is likely a valid point; but we have seen surveys where only one question was presented per page due to graphics that were associated with questions. In such cases the progress indicator is useful. It is also a good idea to include a “Save for later” or “Finish later” button so that users can save their work if interrupted in the middle of completing the survey.
![]() Avoid “special requirements.” For example, do not force respondents to download plug-ins or special viewers. Not many people will want to complete your survey if you do.
Avoid “special requirements.” For example, do not force respondents to download plug-ins or special viewers. Not many people will want to complete your survey if you do.
Web-based survey development tools
There are commercially available web-based survey tools that can help you create your survey without you having to write a single line of code, and they will collect the responses for you. They provide you with summary data, and most will allow you to download the raw data if you would like to conduct further analyses. Some of the tools available today are:
![]() InstantSurvey (www.netreflector.com/instantsurvey.shtm)
InstantSurvey (www.netreflector.com/instantsurvey.shtm)
![]() QuestionBuilder (www.questionbuilder.com)
QuestionBuilder (www.questionbuilder.com)
![]() Sparklit (www.sparklit.com)
Sparklit (www.sparklit.com)
![]() SurveyMonkey (www.surveymonkey.com)
SurveyMonkey (www.surveymonkey.com)
![]() WebSurveyor (www.websurveyor.com)
WebSurveyor (www.websurveyor.com)
![]() Zoomerang (www.zoomerang.com).
Zoomerang (www.zoomerang.com).
Keep in mind that these aids do not relieve you of the responsibility of identifying the questions and wording them appropriately. That will still be your job.
Creating an E-mail Survey
If you do not have the budget or the ability to create a web-based survey, then an email survey is an option. If you decide to distribute your survey in this way, make sure that it is embedded in the e-mail rather than as an attachment. That way, respondents can hit “Reply” and complete the survey within the e-mail. Do not expect people to download an attached document, complete the survey, save it, then reattach it and send it back to you. This takes more time and effort than many participants are willing to provide, and some may not be willing to open an attachment for fear of computer viruses. Also, do not ask respondents to reply to a different address. Make the process as simple as possible.
Creating a Paper-based Survey
If your user population typically does not have access to the web, traditional paper (i.e., mail survey, hand-carrying to recipients, handing out at trade shows) is your best bet. Also, if you are conducting a scientific survey, mail is a good choice because it is easier to obtain a random sample of the population.
Again, make the process as easy as possible for respondents. Include a self-addressed, postage-paid envelope. Allow time in your schedule to do this as it takes considerable time to make copies of your survey and to stuff and address a large number of envelopes. As your data is on paper rather than in an electronic format so you will need to manually enter the data into an analysis tool. Do a trial data entry early on using one of your completed pilot surveys so you can get a sense of just how long this will take. Experienced usability professionals know this always takes longer than expected. It is better to be aware of this ahead of time so you can budget the extra time into your schedule.
Test Your Survey
The value of running a pilot or pre-testing your user requirements activity is discussed in Chapter 5 (refer to “Piloting Your Activity” section, pape 193). However, testing your survey is so important to its success that we want to discuss the specifics here in more detail. Keep in mind that once you send the survey out the door, you will not be able to get it back to make changes – so it is critical to discover any problems before you reach the distribution stage.
You may be thinking: “Well, my survey is on the web, so I can make changes as I discover them.” Wrong. If you catch mistakes after distribution, or realize that your questions are not being interpreted in the way intended, you will have to discard the previous data. You cannot compare the data before and after edits. This means that it will take more time to collect additional data points and may cost more money.
When running your pilot, you want to make sure that someone who matches your user profile completes the survey, not just co-workers. Colleagues can help you catch typos and grammatical errors, but unless they are domain experts, many of the questions may not make sense to them. Using someone who fits the user profile will help you confirm that your questions are clear and understandable. For example, if your co-worker completes a survey designed for a nurse, he/she will likely not understand the questions (unless he/she also works in this domain) and as a result will not be able to help you determine if your questions are appropriate. A pilot will enable you to do the following:
![]() Catch embarrassing typos and grammatical errors
Catch embarrassing typos and grammatical errors
![]() Determine the time it takes to complete the survey (if it is too long, now is your chance to shorten it)
Determine the time it takes to complete the survey (if it is too long, now is your chance to shorten it)
![]() Determine the comprehensibility of the format, instructions, and questions
Determine the comprehensibility of the format, instructions, and questions
![]() In the case of a web survey, determine (a) whether there are any broken links, or bugs, and (b) whether the data are returned in the correct or expected format.
In the case of a web survey, determine (a) whether there are any broken links, or bugs, and (b) whether the data are returned in the correct or expected format.
A modified version of a technique referred to as cognitive interview testing can be valuable when pre-testing your survey. We say a “modified version” because formal cognitive interviewing can be quite labor-intensive. It can involve piloting a dozen or more people through iterative versions of your survey and then undertaking a detailed analysis. Unfortunately, in the world of product development, schedules do not allow for this. The key element of this technique that will benefit you in evaluating your survey is the think-aloud protocol.
Think-aloud protocol or “verbal protocol” as it is often called – is described elsewhere in this book (refer to Chapter 6, During Your User Requirements Activity, “Introducing Your Think-aloud Protocol” section, page 218). If you have ever run a usability test, you are likely familiar with this technique. When applied to survey evaluation, the idea is that you have someone complete your survey while literally thinking aloud, as you observe. As the participant reads through the questions they tell you what they are thinking. The person’s verbal commentary will allow you to identify problems, such as questions that are not interpreted correctly or that are confusing. In addition, during the completion of the survey, you can note questions that are completed with incorrect answers, skipped questions, hesitations, or any other behaviors that indicate a potential problem understanding the survey. After the completion of the survey, you should discuss each of these potential problem areas with the pilot participant. This is referred to as the retrospective interview. You can also follow up with the pilot respondent and ask for his/her thoughts on the survey: “Did you find it interesting?” “Would you likely fill it out if approached?” This is sure to provide some revealing insights. This type of pilot test can provide you with a wealth of information to help you improve your survey.
After you run your pilot, you will want to go back and make changes. It is wise to then run another pilot test. Continue with this process until you run a pilot that does not elicit any new problems. This process can be time-consuming, but it is worth every minute, as it will spare you from headaches that would have arisen later on down the road when they are very difficult (or impossible) to correct.
If you will be conducting a survey that is going to require a large number of responses (over 100), and you plan to conduct some complex data analysis, it is a nice idea to conduct a pilot with a group of 10 or so participants. Keep in mind that some of those people can be co-workers. This will allow you to test your data analysis methods.
Data Analysis and Interpretation
You have collected all of your survey responses, so what’s next? Now it is time to find out what all of those responses are telling you.
Initial Assessment
Your first step (if this did not happen automatically via the web) is to get the data into the tool that you are going to use. Microsoft® Excel®, SPSS, and SAS are some of the well-known programs that will enable you to accomplish your analyses. Typically, the data will be entered into a spreadsheet. The rows will be used to denote each participant and the columns will be used to indicate each question. Some statistical packages allow you to enter only numeric values so you may need to do some coding. For example, if you asked people whether they were male or female, you would not be able to enter male or female into the spreadsheet; you would have to use a code for each response, such as “male = 1” and “female = 2.” Figure 8.6 illustrates a sample of data entered in a spreadsheet format.

Once you have your data in the spreadsheet, you should scan it to catch any abnormalities. This is manageable if you have 100 or fewer responses, but it can be more difficult once you get beyond that. Look for typos that may have been generated at your end or by the participant. For example, you might find in the age column that someone is listed as age “400,” when this is likely supposed to be “40.” If you have the paper survey to refer to, you can go back and find out whether there was a data entry error on your part. If data entry was automatic (i.e., via the web), you cannot ethically make any changes. Unless you can contact that respondent, you cannot assume you knew what he/she meant and then change the data. You will have to drop the abnormal data point or leave it as is (your stats package will ignore any empty fields in its calculation). You may also find that some cells are missing data. If you entered your data manually, the ideal situation is to have a co-worker read out the raw data to you while you check your spreadsheet. This is more reliable than “eyeballing” it; but because of time constraints, this may not be possible if you have a lot of data.
Types of Calculation
Below we discuss the most typical forms of data analysis for closed-ended questions. Because we do not recommend open-ended questions for surveys we do not go into detail about how to analyze the data from them in this chapter. A discussion can be found in Chapter 7, Interviews, “Data Analysis and Interpretation” section, page 293.
The types of calculation that you will carry out for most surveys are fairly straightforward. They do not require advanced statistical knowledge. There are complex statistics that can be executed to extract subtleties in the data if you have responses from enough participants, but they are typically not necessary in the case of product design. If you are interested in analysis beyond what is covered below, consult Alreck and Settle’s book The Survey Research Handbook (see “Suggested Resources for Additional Reading,” page 315).
The key calculations that will be of importance to you for closed-ended questions can easily be calculated by any basic statistics program or spreadsheet. Our goal is not to teach you statistics, but to let you know what the common statistics are and why you might want to use them. These types of calculations can be illustrated effectively by using graphs and/or tables. Where appropriate, we have inserted some sample visuals.
Mean
The mean is the average of the scores in the population. It is probably the most frequently used calculation in survey analysis. It equals the sum of the scores divided by the number of scores. For example, you might want to know the mean amount of web experience of your respondents, or their mean age. If the ages in your sample were
the average age was 31.13 years (467 divided by 15). Figure 8.7 illustrates how you might want to display related means.

Median
The median of your sample is the point that divides the distribution of scores in half. Numerically, half of the scores in your sample will have values that are equal to or larger than the median, and half will have values that are equal to or smaller than the median. So, if the ages in your sample were
“32 years” would be the median age. The median is the best indicator of the “typical case” when your data are skewed.
Mode
The mode is the score in the population that occurs most frequently. The mode is not the frequency of the most numerous score. It is the value of that score itself. So, if the ages in your sample were
“37 years” would be the mode age because it appears most frequently. The mode is the best indicator of the “typical case” when the data are extremely skewed to one side or the other.
Measures of Dispersion
As discussed above, it is useful to know the average (mean) of your data, but it is also helpful to have an idea of the “spread” or dispersion of the data around the mean.
Maximum and minimum
The maximum indicates how far the data extend in the upper direction, while the minimum shows how far the data extend in the lower direction. In other words, the minimum is the smallest number in your data set and the maximum is the largest. So, if the ages in your sample were
“19 years” is the minimum age and “45 years” is the maximum.
Range
The range is the maximum value minus the minimum value, so it indicates the spread between the two extremes. So, if the ages in your sample were
Standard deviation
The standard deviation (SD) is a measure of the deviation from the mean. The larger the standard deviation, the more varied the responses were that participants gave. It is easily calculated by any spreadsheet program, so we will not go into the details here. The standard deviation is represented by the I-shaped device on each bar of the graph, as in Figure 8.7.
Frequency
The frequency is the number of times that each response is chosen. This is one of the more useful calculations for survey analysis. This kind of information can be used to create graphs that clearly illustrate your findings. It is nice to convert the frequencies to percentages (see Figure 8.8).

Measures of Association
Measures of association allow you to measure the relationship between two survey variables. Two of the most common measures of association are comparisons (or cross-tabulation) and correlation.
Comparisons
Comparisons are by far the most common measure of association for surveys. It can be insightful to find out how answers to one question are related to the responses to another question. Comparisons allow you to see these relationships. For example, let’s say we had a question that asked people whether they made hotel reservations via the web. As a comparison, we want to see whether the answer to this question relates to whether or not they book cars on the web.
For our first question – “Have you ever booked a hotel on the web?” – the response was
| Yes | No |
| 73% | 27% |
For the 73% who responded “Yes,” we want to determine how they answered the question “Have you ever booked a rental car on the web?” The breakdown can be seen as follows:
| Yes | No |
| 69% | 31% |
For the 27% who responded “No” to the first question, we want to determine how they answered the question “Have you ever booked a rental car on the web?” This breakdown can be seen below:
| Yes | No |
| 20% | 80% |
From this comparison, it appears that users who book hotels online are likely to also book rental cars online, while users who do not book hotels online are also unlikely to book cars online. This is an example of cross-tabulation.
Graphs are a great way to visualize these comparisons (see Figure 8.9). Microsoft Excel can help you complete this kind of comparison via “pivot tables.” A pivot table is an interactive table that enables you to quickly summarize large amounts of data. It allows you to rotate its rows and columns to see different summaries of the source data, filter the data by displaying different pages, or display the details for areas of interest. Microsoft Excel’s Help explains how to create this kind of table.

Correlations
Correlations are another measure of association. They are used to measure the degree to which two variables are related. It is important to note that correlations do not imply causation (i.e., you could not state that the presence of hotel deals caused people to book a hotel).
Correlation analysis generates a correlation coefficient, which is the measure of how the two variables move together. This value ranges from 0 (indicating no relationship) to plus or minus 1. A positive number indicates a positive correlation, and the closer that number is to 1, the stronger the positive correlation. By “positive correction,” we mean that the two variables move in the same direction together. For example, you might have a positive correlation that indicates that if people book hotels they are also likely to book airline tickets.
Conversely, a negative number indicates a negative correlation, and the closer that number is to − 1, the stronger the negative correlation. By “negative correction,” we mean that the two variables move in opposite directions together. For example, you may discover the negative correlation that if people book package vacations, they usually do not book a rental car. Below is an example of a negative correlation illustrated with data.
For our first question – “Do you use the internet at home?” – the response was
| Yes | No |
| 64% (16 of 25 respondents) | 36% (9 of 25 respondents) |
For the question “Do you use a travel agent?” the response was
| Yes | No |
| 32% (8 of 25 respondents) | 68% (17 of 25 respondents) |
We want to determine whether the responses to these two questions are related, so we calculate a correlation coefficient. Figure 8.10 illustrates the breakdown of the data. Microsoft Excel or any stats program can easily calculate correlation coefficients for you, so we will not go into the details.

The correlation coefficient for this data set equals −0.91, which indicates that those who use the Internet at home tend not to use a travel agent. It does not mean that use of the Internet causes people to avoid using travel agents. It simply implies that there is a relationship between the two items.
Complex Stats
Again, if you are interested in analysis beyond what is covered above, such as statistical measures of association and causality, Alreck and Settle’s book on survey design details types of calculations, such as analysis of variance, discriminate analysis, regression analysis, and correlation analysis (see “Suggested Resources for Additional Reading,” page 315). We recommend that interested readers review this book to learn more.
Communicate the Findings
Preparing to Communicate Your Findings
The specific data that you communicate to product teams can vary depending upon the activity you conducted, but some elements of how you communicate the results are the same regardless of the method. Because these strategies are common to all user requirements activities, they are discussed in detail in Chapter 14, Concluding Your Activity, page 636. We recommend that you read that chapter prior to relaying your results to your stakeholders. Topics discussed include:
The most important thing to keep in mind when presenting survey results is to make the results as visual as possible. You want those reviewing the findings to be able to see the findings at a glance. Bar charts, line graphs, and pie charts are the most effective ways to do this. Most statistics packages or Microsoft Excel will enable you to create these visuals with ease.
Obviously, you will need to explain what the results mean in terms of the study objectives, as well as any limitations in the data. If the results were inconclusive, highly varied, or not representative of the true user population, state this clearly. It would be irresponsible to allow people to draw conclusions from results that were inaccurate. For example, if you know your sample was biased because you learned the product team was sending only their best customers the link to your survey, inform the stakeholders that the data can be applied only to the most experienced customers. It is your responsibility to understand whom the survey is representing and what conclusions can be drawn from the results. Sometimes the answer is: “Further investigation is needed.”
Lessons Learned
The deployment of several surveys has taught us a few lessons. The first involves getting access to end-users. The last lesson learned involves asking open-ended questions in a survey.
Accessing End Users
Be sure you have a population available that will complete your survey. In one instance, we worked with a product team that assured us they had contacted their customers and that the customers were willing to complete the survey. When we deployed the survey, the response rate was abysmal and the responses were incredibly inconsistent. Part of the problem was our lack of understanding of the users’ job roles and titles. As a result, we stopped the survey and worked with the team to research users’ job roles and titles. The most important lesson learned here is to confirm that you know your user population. Unfortunately, sometimes it takes a failure to demonstrate what you or the product team doesn’t know. Additionally, if you plan to work with customers, confirm their interest in participating and have a backup plan in the event they do not follow-through.
A situation similar to the one above happened with a different product team. This time, the team wanted to understand their student users in the UK. Since we are not located in the UK, we were depending on our customers in the UK to distribute the surveys to their students. Before we began developing the survey, we knew we needed agreement from the customers themselves to distribute the survey – not just an assurance from the product team. When the rubber hit the road, we were unable to get the customers to agree to distribute the surveys because they did not feel that the results would provide enough benefit to them. They insisted that we conduct a usability test on the current product and didn’t want to “waste” their students’ time completing a survey. Despite the fact that the product team and usability group strongly agreed on the need for the information from the survey to improve future versions of the product, without support from the customers themselves we could not complete the surveys in the timeframe required. The only bright side was that we did not waste a great deal of time and effort developing a survey that was doomed to fail from the beginning. If you are depending on someone else to distribute your survey, obtain all assurances that your “supporter” will follow-through before you code a word of it, and then develop a backup plan if possible.
Asking Open-ended Questions
Make sure you ask only those questions that you plan to analyze the data for and that will provide meaningful responses. We once worked with a team that insisted on including a plethora of open-ended questions. We warned the team about the additional time it would take to analyze the responses. They ensured us that they had the bandwidth to do this. It was not until the responses were in that they realized just how much work the analysis of the open-ended questions involved. In the end, they dropped the data to these questions.
Pulling It All Together
In this chapter, we have illustrated the details of creating an effective survey. You should now be able to create valuable questions and format your survey in a way that is easy to understand and that attracts the interest of the potential respondents. You should also be equipped to deploy your survey, collect the responses, and analyze as well as present the data. You are now ready to hit the ground running to create a survey that will allow you to collect the user requirements that you need.
Using Online Surveys to Quantify Usability Issues
Kelly Braun, Senior Manager, eBay Usability Group eBay’s Usability Group has found that online surveys can be powerful tools in the user-centered design (UCD) process. We have used surveys to gather user requirements for new features and to obtain feedback on both newly launched and future designs. This case study presents an international research effort that used surveys to assess the general “usability health” of four international eBay sites. It also discusses some of the issues we have encountered while running surveys at eBay.
eBay is the World’s Online Marketplace™ providing a venue for people to buy and sell goods around the world. One way in which eBay differs from most e-commerce sites is that all items offered for sale are being sold by individuals or businesses, but not by eBay itself. There are currently over 16 million items a day available on eBay and users continue to add approximately 2 million new items a day. Most e-commerce sites focus only on how to help people find and buy items; eBay also has to focus on helping people list items for sale.
The eBay Usability Group proactively monitors the usability of the site. We conduct regular in-lab site usability reviews that test the usability of the buying and selling processes with a wide range of participants – including those who have never used eBay before. We gather a great deal of qualitative information during these site reviews, but we also wanted to quantitatively measure the impact of usability issues on the site. We have used surveys to gather this quantitative data.
Our Approach
In general, we believe that surveys are not effective at uncovering usability issues. Surveys need to present the hypothesized usability concerns so that users can choose those responses. Providing open-ended response fields can help you gather new data; however, this relies on the user to articulate the problem. We have found that surveys are very useful for quantifying usability issues that have been previously identified.
For this project, we decided to create a survey that displayed in a pop-up window as users left the site. When users exited the site, we asked what they thought about the eBay experience they had just completed. We chose a pop-up exit survey because the experience would be fresh in users’ minds and it would not interrupt their buying or selling activities.
Creating the Questions
We had recently completed field studies and in-lab usability studies in the United States (www.ebay.com), Germany (www.ebay.de), Italy (www.ebay.it), and Taiwan (www.tw.ebay.com). We used the data from these field and lab studies to create the questions for the surveys. The pop-up survey allowed us to ask very targeted questions based on what page the person had just left. For instance, if the user left the site on the final page of registration, we presented questions about the registration process. We also created surveys for intermediate steps along a particular process so that we could ask specific questions about steps within that process. For instance, if a person left the registration process on the page where they needed to enter a credit card, we could include “I am uncomfortable putting my credit card online” as an answer choice for why they left the site.
First, we identified the processes and the pages within those processes that we wanted to investigate. We identified more than 30 pages where we wanted to know why a user might leave the site. Since this research was being conducted in four languages, we ended up creating (and managing) over 120 surveys. We created a framework for the surveys that included questions that were asked in every survey as well as answer choices that were unique to each survey. By controlling the standard questions we were able to look at some data across all processes and all countries. By creating unique answer choices per flow we were able to investigate the specifics and thus make the survey contextual and more usable for the respondent.
One of the processes we chose to survey was finding an item to buy on eBay. One way to find items is to type keywords into the search box located on most pages. The user is then presented with a search results page. Typically, users look at the returned list of items and then click on one item of interest. Clicking on the title of this item takes them to the description of the item that the seller has listed for sale. People usually go back and forth between the search results page and individual items until they find the item they want to buy.
We created a survey that was delivered to every 100th person who left the eBay website from the search results page. We ensured that users received only one exit survey no matter where they exited the site.
Figures 8.11A and B are a representation of the survey we presented when people exited the search results page. This survey was presented on two pages because it looked too long and daunting all on one page. We took the last three questions (13 through 15) that were also the most complicated-looking and put them on the second page, with a message stating that these were the last questions. Participants clicked on the “Next” button after question 12. Questions 1-12 were part of the standard questions, while 13-15 were specific to the Search process flow.


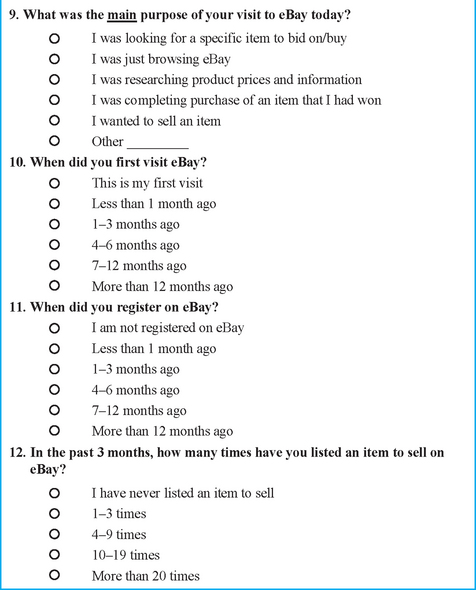

This may seem like a long and complex survey; however, we have learned from previous experience that eBay users are motivated to tell us what they think about eBay. Of the people who started this survey, 88% of them completed it.
Survey Vendors
We completed this research using a self-service survey vendor. Self-service vendors usually offer the ability to create your own survey and provide basic tools for data analysis. Many self-service vendors also provide professional services such as survey creation and more complex data analysis for a fee. On average, a self-service survey with 1200 respondents costs $2000, assuming we do all the analysis ourselves.
Full-service vendors create, field, and analyze the survey for you. While the self-service option can be five to ten times less expensive, you will need to invest your time and effort. For more complex analyses that the self-service tools do not provide, you may want to bring in a consultant.
For most surveys we need only basic statistics like means and standard deviations, and identifying whether there are statistically significant differences within the results. For this project, we wanted to create a model that could quantify the effects of addressing specific findings. We hired a consultant to build a regression-based model that helped us prioritize which issues to address first.
Self-service survey vendors usually offer basic statistics capabilities, but you should double-check that their tools can do the analysis you need or can put the data into a format you can use. One of the biggest surprises we had working with self-service vendors was discovering that some do not understand the research side of surveys. For instance, we found one vendor who could present the survey questions in random order but could not randomize the responses within a question. Re-ordering the response choices is a common need in surveys – doing so eliminates the bias of people choosing the first response. For our needs, randomized order for response choices is much more important than randomized question order. This vendor focused their resources on creating the survey delivery technology but they did not have market research resources to tell them whether the functionality they were building made sense to a researcher.
We ran these surveys for a set period of time. Most self-service survey vendors offer pricing options of either paying per number of respondents or paying for the amount of time the survey runs regardless of the number of responses. We did not want our users to be presented with a pop-up that said “Sorry the survey is closed,” so we opted for the pay-per-time option for this project.
Since we were running these surveys internationally, we wanted to find a vendor who could support multiple languages. Here we found two types of vendor: those who have the capability to adapt their survey creation tools into different languages, and those who provide an English-only interface for creating the surveys, but support the survey elements (buttons, etc.) in various languages. One of the most important factors for us when creating international surveys is the amount of customization permitted within the standard survey elements. For instance, one vendor provided a standard “Thank you” message at the end of the survey. When eBay’s linguistic team reviewed the Italian message they felt the translation was inappropriate. The survey provider told us there was no opportunity for us to customize this final message, so we had to choose another vendor.
One of the most difficult things for us was finding a survey vendor who could handle the traffic we knew this survey would generate. Even when we present the pop-up survey to a subset of our users (1 in 100), we have brought down vendor sites. If you are planning to put a link on your website to a survey, our advice is to involve the folk who run the technical operations of your site. They will be able to identify potential problems with a vendor’s traffic capabilities.
We deliver surveys to our users in one of three ways: by posting links to the survey on the site, by sending e-mail invitations, and via pop-up on-exit surveys. Exit surveys generate the most traffic to a vendor’s site because the survey loads into every pop-up window, regardless of whether or not the person chooses to respond to the survey. With links in e-mails or links on the site, users initiate the survey only if they have some intention of taking the survey. If you use a vendor who cannot handle traffic from your e-mail or site link invitations, don’t even consider doing an exit survey with them.
Analyzing the Data
Once we successfully gathered all of this survey data, we needed to analyze it. The selfservice survey tool provided the basic statistics so that we could see how many people responded to each answer choice. We were also able to look at basic cross-tabulations which helped us answer questions like “Of the people who said they did not bid on or buy an item today (question 5), how many also responded: ‘I was just browsing or researching today’ to question 6?” For more complex data analysis, we hired consultants to help us answer questions like “Of the people who did not bid or buy (question 5), and who also said they left the site because ‘Using eBay is difficult’ (question 6), which options in question 7 (a list of possible usability issues) did they choose, and did those options vary by country site?”
The consultants created statistical models to help us understand the magnitude and the impact of issues on the overall usability of the site. This model was able to provide an estimate of the positive impact of improving usability issues, as well as an estimate of potential losses that could occur if existing usability decreased. These data were helpful for prioritizing what issues should be addressed first, as well as providing input for analyzing return on investment.
Findings
While we cannot discuss the bulk of our findings, one of the most interesting things we found was that there were no differences in the direction of the data between country sites. Language and cultural differences did not play a role in how people were trying to find items on the site.
Lessons Learned
We have found that surveys can be an effective tool to assist usability engineers to quantify usability issues. Here are a few things to keep in mind that we think will help you be successful with your survey efforts:
![]() Have a thorough understanding of what you want to learn from the research before you create a survey. You need to understand the issues in order to create the most effective survey with targeted questions and responses. You also need to understand what information you want to get from your respondents in order to identify the data analysis you will need.
Have a thorough understanding of what you want to learn from the research before you create a survey. You need to understand the issues in order to create the most effective survey with targeted questions and responses. You also need to understand what information you want to get from your respondents in order to identify the data analysis you will need.
![]() Apply the same experimental design standards to surveys that you would to usability testing. Surveys are not a fishing expedition where you hope the users will guide you to an answer.
Apply the same experimental design standards to surveys that you would to usability testing. Surveys are not a fishing expedition where you hope the users will guide you to an answer.
![]() Get buy-in from all stakeholders before launching the survey. We went through an extensive iterative process to refine the surveys for this project. It was time-consuming but it also ensured that when the surveys were complete we had answers to everyone’s research questions. When you are putting this much effort into a project you don’t want people asking, “Did you consider asking about x?” after you have your data collected.
Get buy-in from all stakeholders before launching the survey. We went through an extensive iterative process to refine the surveys for this project. It was time-consuming but it also ensured that when the surveys were complete we had answers to everyone’s research questions. When you are putting this much effort into a project you don’t want people asking, “Did you consider asking about x?” after you have your data collected.
![]() Carefully choose the vendor based on the features and amount of support you need for the project. Problems with a vendor can make your job much harder than it needs to be. We experienced problems with the vendor not being able to handle the traffic on our site. This forced us to reduce the rate at which we presented the survey, which, in turn, required the survey to run a few days longer than expected.
Carefully choose the vendor based on the features and amount of support you need for the project. Problems with a vendor can make your job much harder than it needs to be. We experienced problems with the vendor not being able to handle the traffic on our site. This forced us to reduce the rate at which we presented the survey, which, in turn, required the survey to run a few days longer than expected.
![]() If the survey will be launched from your site, ask your webmaster or other technical expert to review the survey company’s technology. Any third-party that interfaces with our site must go through a stringent technical evaluation.
If the survey will be launched from your site, ask your webmaster or other technical expert to review the survey company’s technology. Any third-party that interfaces with our site must go through a stringent technical evaluation.
![]() If you will need assistance with data analysis and intend to bring in a consultant, make sure the consultant reviews the survey before you launch it. The consultant can ensure that the structure of your survey permits the data analysis you need.
If you will need assistance with data analysis and intend to bring in a consultant, make sure the consultant reviews the survey before you launch it. The consultant can ensure that the structure of your survey permits the data analysis you need.
![]() When calculating the cost of a survey done in-house with a self-service vendor, be sure to include your time and the time of anyone else on the team needed to create, field, and analyze the survey. It might be more cost-effective to send the survey out to a full-service vendor.
When calculating the cost of a survey done in-house with a self-service vendor, be sure to include your time and the time of anyone else on the team needed to create, field, and analyze the survey. It might be more cost-effective to send the survey out to a full-service vendor.
Acknowledgments. I should like to thank Sonia Wong from the Product Management Group who devised the survey framework and ensured that this enormous international effort ran smoothly. I also thank Paul Fu from the Usability Group and Teri Morris from Project Management who worked tirelessly on the technical details and implementation of over 120 surveys.