
PrimeFaces offers one base component named chart, which provides different charting according to the provided type attribute. In this recipe, we will create line, area, bar, and pie charts using this component.
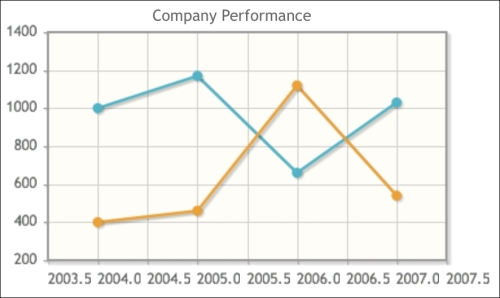
A basic definition of a line chart with two series of data is given here:
<p:chart type="line" model="#{chartBean.model}"
  style="height:250px" />
The model defined for the line chart is given here:
private LineChartModel createLineModel() {
  LineChartModel model = new LineChartModel();
  LineChartSeries sales = new LineChartSeries();
  sales.setLabel("Sales");
  sales.set(2004, 1000);
  sales.set(2005, 1170);
  sales.set(2006, 660);
  sales.set(2007, 1030);

  LineChartSeries expenses = new LineChartSeries();
  expenses.setLabel("Expenses");
  expenses.set(2004, 400);
  expenses.set(2005, 460);
  expenses.set(2006, 1120);
  expenses.set(2007, 540);

  model.addSeries(sales);
  model.addSeries(expenses);
  model.setTitle("Company Performance");

  return model;
}
The visual output of the chart is given here:
By default, the chart component renders axis labels with decimal points, and sometimes, it might not make sense for values such as years. To disable this, a JavaScript definition should be added and attached to the chart with the extender definition of the model, as given here:
model.setExtender("chart");The value defined in the extender will be the name for the JavaScript method. Then, we can access the axis that we'd like to correct and set its format as follows:
<script type="text/javascript">
  function chart() {
    this.cfg.axes.xaxis.tickOptions = {
      formatString : '%d'
    };
  }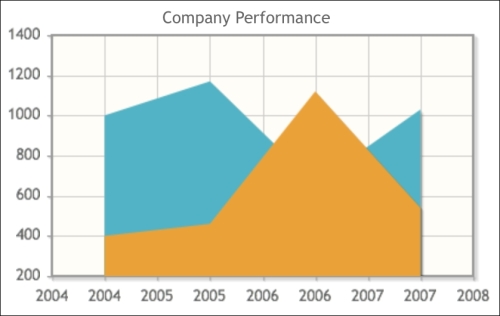
</script>To create area charts, we will use LineChartModel and its series given when creating the line chart, but we will set fill to true here:
sales.setFill(true);
expenses.setFill(true);
The visual output is as follows:
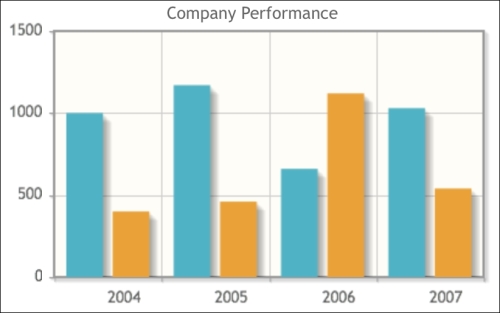
It's also possible to create a bar chart using the same chart series. The model that will be used for binding should be an instance of BarChartModel and type should be set to bar. Here's how you can create the bar chart:
<p:chart type="bar" model="#{chartBean.barModel}" />The visual output of the bar chart is given here:
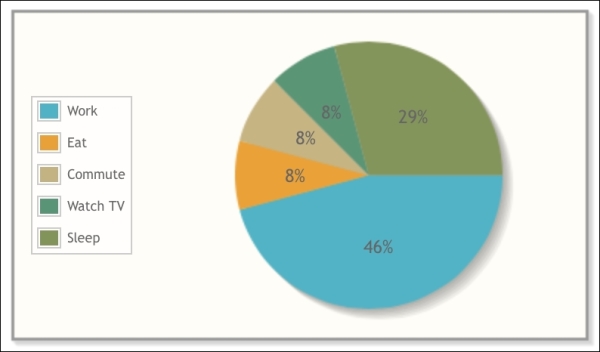
To create a pie chart, we need to define an instance of PieChartModel and set values into it by configuring its legends and labels as follows:
PieChartModel model = new PieChartModel();
model.setLegendPosition("w");
model.setShowDataLabels(true);
model.set("Work", 11);
model.set("Eat", 2);
model.set("Commute", 2);
model.set("Watch TV", 2);
model.set("Sleep", 7);
The definition of the chart component for the model is as follows:
<p:chart type="pie" model="#{chartBean.pieModel}" />The visual output of the pie chart with legends is given here:
This recipe is available in the demo web application on GitHub (https://github.com/ova2/primefaces-cookbook/tree/second-edition). Clone the project if you have not done it yet, explore the project structure, and build and deploy the WAR file on application servers compatible with Servlet 3.x, such as JBoss WildFly and Apache TomEE.
The showcase for the recipe is available at http://localhost:8080/pf-cookbook/views/chapter9/chart.jsf.