
Preface
Photograph of Jenny Preece courtesy of Ben Shneiderman.
Fig. 1.1 The marble answering machine. Adapted from Gillian Crampton Smith: “The Hand that Rocks the Cradle” ID Magazine, May/June 1995, pp. 60–65 Fig. 1.2(a) The TiVo remote. TiVo Inc. Fig. 1.3(a) Beatbug interactive music toy. Reproduced by permission of MIT Media Lab. Fig. 1.3(b) Interactive mirror. Photo courtesy of Philips. Fig. 1.3(c) “Illum” Commuting Jacket. Photo courtesy of PDD, www.pdd.co.uk Fig. 1.5 Four different team members. Based on figure under section heading 32.1 Interdisciplinary Cooperation, Chapter by S. Kim in The Art of Human Interface Design, edited by B. Laurel (1990), Addison Wesley. Fig. 1.6 Wireless cell phones for Telespree. IDEO, http://www.ideo.com/portfolio/re.asp?x=50088 Fig. 1.7 iPod advertisement. Apple Computer Inc., http://www.apple.com/ipod/ipod.html Fig. 1.8 Anna the online sales agent. IKEA, http://www.ikea.com/ms/en_GB/ and http://www.ikea.com/ms/en_US/ Fig. 1.9(a) A safe and unsafe menu. Screenshots from QUALCOMM Eudora Products www.qualcomm.com/eudora Fig. 1.9(b) A warning dialog box for MacOSX. Apple Computer Inc. Fig. 1.10 Are attractive interfaces more or less usable? Figures 1(a), 1(b), 2(a) & 2(b) Tractinsky, N. (1997) “Aesthetics and Apparent Usability: Empirically Assessing Cultural and Methodological Issues”. CHI 97 Electronic Publications: Papers. http://www.acm.org/sigchi/chi97/proceedings/paper/nt.htm Fig. 1.11 A sign at the restrooms in Cincinnati. http://www.baddesigns.com/ Fig. 1.12 Menu showing restricted availability of options. Adobe product box shot reprinted with permission from Adobe Systems Incorporated. Fig. 1.13 Where do you plug the mouse and keyboard? http://www.baddesigns.com/
Fig. 2.1(a) Overlaying X-rays on a patient. Reproduced by permission of Michael E. Leventon Fig. 2.1(b) Interactive windshield. Hewlett-Packard, reproduced from http://www.ibiblio.org/jlillie/cooltown/lillie.htm Fig. 2.2 Visicalc screenshot. Reproduced from http://www.bricklin.com/firstspreadsheetquestion.htm Fig. 2.3 Microsoft Excel. Microsoft product screen shot reproduced with permission from Microsoft Corporation. Fig. 2.4(a)(b) The Xerox star and GUI. Reproduced from http://www.thocp.net/hard-ware/3 Fig. 2.5(a)(b) Two virtual calculators. Mullet, K. and Sano, D. Designing Visual Interfaces, Prentice Hall, 1995. Fig. 2.7(a) An online agent, Anna. http://www.ikea.com Fig. Ask for kids. http://www.askforkids.com/ Fig. 2.9 Cricket components. Reproduced from http://llk.media.mit.edu/projects.php?id=1942 Fig. 2.10(a) Original Mac desktop interface. Screenshot of Macintosh desktop interface © Apple Computer Inc. Fig. 2.10(b) Recent Mac desktop interface. Screenshot of Apple MacOSX © Apple Computer Inc. Fig. 2.11 Example of a 3D virtual city. The Equator Interdisciplinary Research challenge. http://www.cs.ucl.ac.uk/research/equator/gallery/images/all_city2_med.jpg Fig. 2.12(a) CAVE insect. Reproduced from http://www.ento.vt.edu/%7Esharov/3d/cave.html Fig. 2.12(b) A life-like simulation of a newly designed train station. Reproduced from http://www.answers.com/topic/cave Fig. 2.13 NCSA's CAVE. Reproduced from http://cave.ncsa.uiuc.edu/ Fig. 2.15 A game using a text-based instruction mode of interaction. Screenshot from Zork© Infocom. Fig. 2.16 A 3D virtual game (Voodoo Island. Reproduced from http://www.3dgamers.com/screenshots/games/voodooislands/387479/ Fig. 2.17 Conceptual models. Fig. 1.10, p. 16, Norman, D The Psychology of Everyday Things, Perseus Books, 1988
Fig. 3.2 Two different ways of structuring the same information at the interface. Reproduced by permission of Dr T. S. Tullis, from his Ph.D. Dissertation “Predicting the Usability of Alphanumeric Displays”, Rice University, Houston, Texas, USA. Fig. 3.3 The Google search engine. Reproduced by permission of Google Inc. Fig. 3.4 Two ways of structuring information on a webpage. Figures 3 & 4, D. Weller: “The Effects of Contrast and Density on Visual Web Search” from Usability News, 2004. Fig. 3.5 Apple Computer's Spotlight search tool. Screenshot from Mac OS X Searchlight © Apple Computer Inc. Fig. 3.6 Cook's College screenshots. Reproduced from http://wwwstatic.cc.gatech.edu/fce/ecl/projects/dejaVu/cc/ Fig. 3.8 The Google help center. Reproduced by permission of Google Inc. Fig. 3.9 Bridging the gulfs of execution and evaluation. Adapted from p. 40, D. Norman (1986): “Cognitive Engineering” in D. Norman and S.W. Draper User Centered System Design, LEA pp. 31–62. Fig. 3.10 Zstep 94: An early debugging tool. H. Lieberman and C. Fry (1995): “Bridging the Gap Between Code and Behaviour in Programming”, Proc. CHI'95 ACM, pp. 480–486. Fig. 3.11 Human information processing model. Redrawn and adapted from Barber, P. (1988) Applied Cognitive Psychology, Figure 3.1 (page 63) published by Routledge and reproduced by permission of ITPS Ltd. Fig. 3.12 The human processor model. Card, S., Moran, T. and Newell, A. (1983) The Psychology of HCI, Figure 2.1, page 26, reproduced by permission of Lawrence Erlbaum Associates, Inc. Fig. 3.13 ComMotion. Reproduced from http://alumni.media.mit.edu/∼nmarmas/comMotion.html Fig. 3.15 Preece, J. and Keller, L. (1994) Human-Computer Interaction, Figure 3.5 (page 70) Addison Wesley, 1994.
Fig. 4.1(a) Text-based conversation from an early MUD. Reproduced from http://www.nwe.ufl.edu/%7Eltaylor/temp/muds.html Fig. 4.1(b) A conversation held at the virtual ‘the U’. Reproduced from http://www.digitalspace.com/avatars/book/chus/chus1.htm Fig. 4.2 The Hydra System. A. Sellen, W. Buxton and J. Arnott (1992): “Using Spacial Cues to Improve Videoconferencing”. Proc. Of CHI'92 pp. 651–652 Fig. 4.3 The Video Window system. Reproduced by permission of Promethean Ltd. Fig. 4.4 The Dynamo system. H. Brignull, S. Izadi, G. Fitzpatrick, Y. Rogers and T. Rodden (2004): The Introduction of a shared interface surface into a communal space”. In Proc. Of the 2004 Conference on Computer Supported Cooperative Work CSCW '04. Fig. 4.6 Group system layout. Reprinted from D ecision Support Systems, 5(2) Nunamaker et al: Experiences at IBM with Group Support Systems 183–196 (1989), with permission from Elsevier Science. Fig. 4.7 ACTIVBoard whiteboard. Reproduced from http://www.caedmon.n-yorks.sch.uk/pages/subjects/english2/pages/activboard.htm Fig. 4.8(a) One of BT's early videophones. © British Telecommunications Plc. Reproduced with permission. Fig. 4.8(b) Recent mobile “visualphone” developed in Japan. Fig. 4.9 Hypermirror. Reproduced from http://staff.aist.go.jp/morikawa.osamu/soft/int01.htm Fig. 4.10 BiReality. N.P. Jouppie (2002) “First steps towards mutually-immersive mobile telepresence”. In Proceedings of the 2002 ACM Conference on Computer Supported Cooperative Work, CSCW '02, pp. 354–363 Fig. 4.11 Fill-in record table. Figure 3, Y. Rogers (1993): “Coordinating Computer-Mediated Work” in “Computer Supported Cooperative Work” 1(4) pp.295–315, Kluwer Fig. 4.13 Screen dump of Portholes. Reproduced by permission of the Xerox Research Centre Europe. Fig. 4.14 Sticker tickertape interface. Reproduced from http://www.tickertape.org:8080/projects/sticker/index.html Fig. 4.15 The Babble interface. Reproduced from http://researchweb.watson.ibm.com/SocialComputing/babble.htm
Fig. 5.1 Kismet.© Peter Menzel, reproduced with permission. Fig. 5.2(a)(b) Smiling and sad Apple Mac icons. Mullet, K. and Sano, D. Designing Visual Interfaces, Prentice Hall, 1995. Fig. 5.2(c) Sad iPod icon. Reproduced from http://docs.info.apple.com/article.html?artnum=61771 © Apple Computer Inc. Fig. 5.3 A collection of graphical smiley icons used in MSN Messenger. Icons from MSN Messenger,© Microsoft. Fig. 5.4(a)(b) Round and square dialog boxes. Marcus, A. (1993) “Human communication in advanced UIs”, Figures 2 and 4 (pages 106 and 107) in Communications of the ACM, 36(4), 101–109. Fig. 5.5 “At Home with Bob” software screenshot. Microsoft product screen shot reproduced with permission from Microsoft Corporation. Fig. 5.6 Microsoft's agent Clippy. Microsoft product screen shot reproduced with permission from Microsoft Corporation. Fig. 5.8 Error message. Reproduced from http://www.nsf.gov/ Fig. 5.9 Pokemon Pikachu virtual pet. Reproduced from http://www.pokemon.com Fig. 5.10 Waterbot monitoring system. Ernesto Arroyo, Leonardo Bonanni, Ted Selker (2005): “Waterbot: Exploring Feedback and Persuasive Techniques at the Sink” in CHI 2005. Fig. 5.11 Cigarette counter. Reproduced from http://www.cgets.com/item–Cigarette-Counter-:-Quit-Smoking-Aid–cigarette_counter Fig. 5.12 Playmates interactive doll Amanda. Reproduced from http://www.playmatestoys.com/html/amazing_amanda/ Fig. 5.13(a) Early virtual popstar, E-cyas. Reproduced by permission of I-D Media. Fig. 5.13(b) Virtual newscaster, Ananova. Reproduced by permission of Ananova Ltd. Fig. 5.14 The Woggles. Figure 1, J. Bates (1994), “The role of emotion in believable characters”, in Communications of the ACM 37(7) Fig. 5.15(a)(b) Silas the virtual dog. Reproduced by permission of Prof. Bruce Blumberg. Fig. 5.16(a)(b) Cellular squirrel and rabbit. S. Marti and C. Schmandt (2005) “Physical Embodiments for Mobile Communications Agents” in Proceedings of UIST'05 Fig. 5.17(a)(b) Rea, the life-like realtor. Reproduced by permission of Professor Justine Cassell. Fig. 5.18 Norman's model of emotional design. Reproduced from http://www.mprove.de/script/04/nng/expectationdesign.html
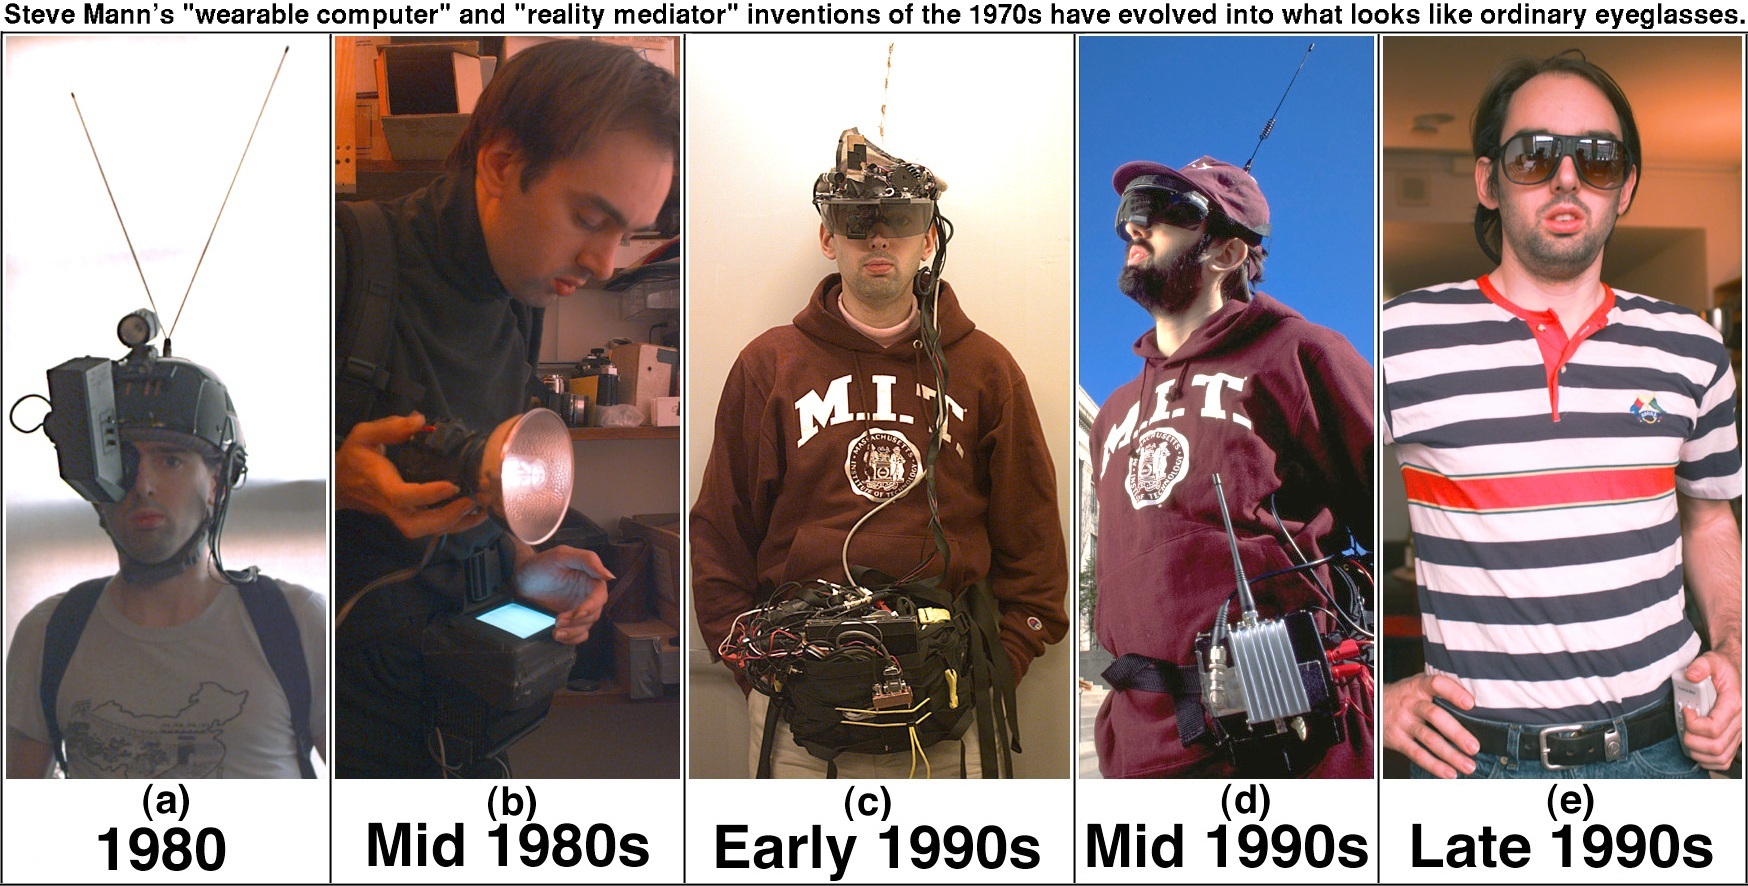
Fig. 6.1(a) Rich Gold Xerox PARC. Reproduced by permission of Rich Gold Fig. 6.1(b) Typical HCI—tangible UI. Reproduced by permission of Hiroshi Ishii. Fig. 6.1(c) BlueEyes. Reproduced from http://www.almaden.ibm.com/cs/BlueEyes/ Fig. 6.2(a)(b) AutoCAD LT Screenshot. Microsoft product screen shot reproduced with permission from Microsoft Corporation. Fig. 6.3 First generation of GUIs. Mullet, K. and Sano, D. Designing Visual Interfaces, Prentice Hall, 1995. Fig. 6.4 Window management technique. Screenshot of Mac OS © Apple Computer Inc. Fig. 6.5 A scrolling menu. Screenhot of Camino browser, © The Camino Project. Fig. 6.6 Two different ways of classifying menus designed for different cultures. Reproduced from http://www.cheeseburgerinparadise.com/pdf/Menu.pdf and http://ccms.ntu.edu.tw/∼fss/coconet/mos/menu.JPG Fig. 6.7Acascadingmenu. Reproduced by permission of the British Standards Institute. Fig. 6.8 Standard design for a menu. Exert from BS-EN-ISO 9241, © The British Standards Institute. Fig. 6.9 Poor icon set. Mullet, K. and Sano, D. Designing Visual Interfaces, Prentice Hall, 1995. Fig. 6.10 Mac icon designs for the TextEdit application. Icons from TextEdit © Apple Computer Inc. Fig. 6.11 Contrasting genres of Aqua icons used for the Mac. Icons from Apple Mac © Apple Computer Inc. Fig. 6.12 Logo-based icons for Microsoft and Macromedia applications. Icons from Microsoft applications © Microsoft Corporation. Reprinted with permission from Adobe Systems Incorporated. Fig. 6.13 Examples of simple and distinguishable icons used in Windows XP toolbar. Icons from Windows XP, © Microsoft Corporation. Fig. 6.14 Icons used by Toshiba for three of its digital camera operations. Reproduced from http://www.toshiba.com/taisisd/isd_svc/svcdsc/_pdf/t20/t20_icons_erase.gif Fig. 6.15 Screen dump from the multimedia environment BioBlast. Screenshot from BioBlast, © Wheeling Jesuit University. Fig. 6.16 The Virtual Gorilla Project. Reproduced from http://gtresearchnews.gatech.edu/reshor/rh-sf96/gorillas.htm Fig. 6.17 Magic Cap's 3D desktop interface. Reprinted by permission of General Magic Inc. Fig. 6.19 Two types of visualizations. Reproduced from http://www.cs.umd.edu/hcil/millionvis/million-treemap.gif Fig. 6.20 The front page of the Aftonbladet newspaper. Reproduced from http://www.aftonbladet.se/ Fig. 6.21 Three main areas of a web page. Reprinted by permission of New Riders Publishing/Jeff Veen. Fig. 6.22 Sony's EyeToy. Reproduced from http://www.firingsquad.com/media/gallery_image.asp/170/12 Fig. 6.23 Microsoft's Digital Ink in action. Reproduced by permission of Dennis Groth. Fig. 6.24 Ubi-Finger. Reproduced from http://mobiquitous.com/ubi-finger-e.html Fig. 6.26 The Blackberry 7780 wireless device. Reproduced from http://www.blackberry.com/products/blackberry7700/blackberry7780.shtml Fig. 6.27 The AVLA MPO model 550. Reproduced from http://www.afb.org/afbpress/pub.asp?DocID=aw050305 Fig. 6.28(a) Treo 65. Reproduced from http://www.the-register.co.uk/2005/05/17/review_palmone_treo650/ Fig. 6.28(b) VodafoneSimple Sagem VS1. Reproduced from http://www.theregister.co.uk/2005/05/23/vodafone_phone_phobe/ Fig. 6.29 BlueEyes. Reproduced from http://www-06.ibm.com/jp/ibm/ibmtopics/year2000.html Fig. 6.30(a) Smartboard.©2006 SMART Technologies Inc. Used with permission. Fig. 6.30(b) Mitsubishi's interactive tabletop. Reproduced from http://www.merl.com/projects/?proj_area=Off+the+Desktop+Inter-action+and+Display Fig. 6.31 Drift table. Reproduced from http://www.interaction.rca.ac.uk/equator/weight_furniture.html Fig. 6.32 Roomware furniture. By permission of AMBIENTE. Fig. 6.33(a) Tangible flow blocks. Figure 5, Zuckerman et al (2005): Extending Tangible Interfaces for Education: Digital Montessori-inspired Manipulatives. In Proceedings of Conference on Human Factors in Computing Systems. ACM Press, 2005 Fig. 6.33(b) Urp. Figure 1, B. Ullmer and H. Ishii: Emerging Frameworks for Tangible User Interfaces (http://www.research.ibm.com/journal/sj/393/part3/ullmer.html). Fig. 6.34(a) A scanned womb. Reproduced from http://www.cs.unc.edu/%7Eazuma/azuma_AR.html Fig. 6.34(b) Head up display. Reproduced from http://avmag.com.ar/n3/evs.html Fig. 6.35 Augmented map and PDA device. http://mi.eng.cam.ac.uk/%7Egr281/augmentedmaps.html Fig. 6.36 The Giant Heart. Reproduced from http://www2.fi.edu/exhibits/permanent/giant-heart.php Fig. 6.38 The evolution of wearable computing. Reproduced from http://wearcam.org/steve5.jpg Fig. 6.39 The SensVest prototype. Reproduced from http://www.eee.bham.ac.uk/wear%2Dit/LOT/ Fig. 6.40(a) Mel, the penguin robot. Reproduced from http://www.merl.com/projects/hosting/ Fig. 6.40(b) Paro, an interactive seal. Reproduced from http://paro.jp/english/
Fig. 7.1 Smileyometer. Figure 2, Janet Read, Stuart MacFarlane, Chris Casey: “Endurability, Engagement and Expectations: Measuring Children's Fun” Department of Computing, University of Central Lancashire. Fig. 7.2 The cut up and remixed big idea. Figure 2, M.L. Guha, A. Druin, G. Chipman, J.A. Fails, S. Simms and A. Farber (2005): “Working with young children as technology design partners”, CACM 48(1), 39–42. Fig. 7.3 The probing tool in the ambient wood project. Figure 3, Y. Rogers, S. Price, C. Randell, D.S. Fraser, M. Weal and G. Fitzpatrick (2005): “Ubi-learning integrates indoor and outdoor experiences”, CACM 48(1), 55–59. Fig. 7.4 Cybelle the intelligent agent. Reproduced from http://www.agentland.com/ Fig. 7.10 Mars Exploration Rover. Reproduced by permission of NASA Jet Propulsion Laboratory (NASA-JPL). Fig. 7.11 MERboard. Figure 2 & 8, J. Trimble, R. Wales and R. Gossweiler (2002): “NASA position paper for the CSCW 2002 workshop on Public, Community and Situated Displays: Merboard.” Fig. 7.12 Homepage of Lycos search engine. Reproduced from http://www.lycos.com Fig. 7.13 Lycos people screen. Reproduced from http://www.lycos.com Fig. 7.14 Tangible objects collected by participants involved in a study about a jazz festival. S. Carter and J. Mankoff (2005): “When participants do the capturing: the role of media in diary studies” CHI 2005 pp. 899–908. Fig. 7.15 A display from WebLog. Reproduced by permission of University of Maryland, Human-Computer Interaction Lab.
Fig. 8.4 The cantina in SWG's Coronet City. Reproduced from N. Ducheneaut and RJ Morris (2004): “The social side of gaming: a study of interaction patterns in a massively multiplayer online game” in Proceedings of CSCW 04. Fig. 8.5 Summary of the activity in the cantina over the course of a day. Reproduced from N. Ducheneaut and RJ Morris (2004): “The social side of gaming: a study of interaction patterns in a massively multiplayer online game” in Proceedings of CSCW 04. Fig. 8.6 Interaction profiles of players in the cantina. Reproduced from N. Ducheneaut and RJ Morris (2004): “The social side of gaming: a study of interaction patterns in a massively multiplayer online game” in Proceedings of CSCW 04. Fig. 8.7 Interaction profile of players in the starport. Reproduced from N. Ducheneaut and RJ Morris (2004): “The social side of gaming: a study of interaction patterns in a massively multiplayer online game” in Proceedings of CSCW 04. Fig. 8.8 Bell interviewing a German family. Reproduced from http://www.intel.com/technology/techresearch/people/bios/bell_g.htm#publications Fig. 8.9 The structure of an affinity diagram. Figure 9.1, p. 155, Hugh Beyer and Karen Holtzblatt: Contextual Design 1998, Morgan Kaufman. Fig. 8.10 Building the affinity diagram of Indian ATM usage. Figure 1, A. DeAngeli, U. Athavamker, A. Joshi, L. Coventry and GI Johnson (2004): “Introducing ATMs in India: a contextual inquiry” in Interacting with Computers 16(1) pp. 29–44. Fig. 8.11 Excerpt from a transcript of a think aloud protocol when using an online educational environment. Reproduced from Armitage, U. (2004) “Navigation and learning in electronic texts”. PhD thesis, Centre for HCI Design, City University London. Fig. 8.12 Criteria for identifying usability problems from verbal protocol transcriptions. Reproduced from Armitage, U. (2004) “Navigation and learning in electronic texts”. PhD thesis, Centre for HCI Design, City University London. Fig. 8.13 The excerpt in Figure 8.11 using the categorisation scheme in Figure 8.12. Reproduced from Armitage, U. (2004) “Navigation and learning in electronic texts”. PhD thesis, Centre for HCI Design, City University London. Fig. 8.14 Axial coding for the Technology category. Reproduced from Figure 1, S. Sarker, F. Lau and S. Sahay (2001): “Using an adapted grounded theory approach for inductive theory building about virtual team development”. The Data Base for Advances in Information Systems, 32(1), pp. 38–56. Fig. 8.15 An excerpt from an early draft of an integrative memo for the technology category. Excerpt from S. Sarker, F. Lau and S. Sahay (2001): “Using an adapted grounded theory approach for inductive theory building about virtual team development”. The Data Base for Advances in Information Systems, 32(1), pp. 38–56. Fig. 8.16 Joan's workplace and shared resources used by the operators. Reproduced from Ackerman, M.S., and C.A. Halverson (2000) “Re-examining organizational memory”. Communications of the ACM, 43(1), 58–64. Fig. 8.17 A diagram showing the propagation of representational states for the employee verification process. Reproduced from Ackerman, M.S., and C.A. Halverson (2000) “Re-examining organizational memory”. Communications of the ACM, 43(1), 58–64. Fig. 8.19 Engeström's activity system model. Reproduced from Y. Engeström Perspectives on Activity Theory CUP, 1999. Fig. 8.20 Examples of activities, actions and operations. Reproduced from K. Kutti (1996) “Activity Theory as a potential framework for Human-Computer Interaction”. In B.A. Nardi (ed.) Context and Consciousness. MIT Press. 17–44.
Fig. 9.2 The Tech Box at IDEO. Reproduced by permission of IDEO. Fig. 9.3 The web page for metal injection moulding. Reproduced by permission of IDEO. Fig. 9.4 Items from the Techbox used in the design of a medical product. Reproduced by permission of IDEO, photographs by Jorge Davies. Fig. 9.5 Overview of the synch-and-stabilise approach. Reproduced from Figure 2, p. 57, Michael A. Cusumano and Richard W. Selby (1997): “How Microsoft Builds Software” in CACM, 40(6). Fig. 9.6 Milestones in the synch-and-stabilise approach. Reproduced from Figure 3, p. 57, Michael A. Cusumano and Richard W. Selby (1997): “How Microsoft Builds Software” in CACM, 40(6). Fig. 9.9 Netpliance's spiral development circle.©1988 IEEE. Fig. 9.11 The DSDM lifecycle model. Reproduced from http://www.dsdm.org/en/about/lifecycle.asp Fig. 9.12(a)(b) Sample Image produced from SketchBookPro v2.0. Reproduced from http://www.alias.com/glb/eng/community/image_gallery_details.jsp?itemId=6900001&start=4 Fig. 9.13 Cycle 0 and its relationship to later cycles. Based on L. Miller (2005): “Case Study of Customer Input for a Successful Product” in Proceedings of Agile 2005 IEEE. Fig. 9.14 The parallel interaction design and implementation tracks. Based on L. Miller (2005): “Case Study of Customer Input for a Successful Product” in Proceedings of Agile 2005 IEEE. Fig. 9.15 The Star lifecycle model. Reproduced by permission of Academic Press Ltd. London, UK. Fig. 9.16 The Usability Engineering Lifecycle. Reproduced by permission of Academic Press, Orlando, Florida. Fig. 9.17 The ISO 13407 human-centered design lifecycle. The ISO 13407 human-centered design lifecycle© British Standards Institute.
Fig. 10.1 An example requirement using the Volere shell. Reproduced from Figure 10.3, p. 184, Robertson and Robertson, Mastering the Requirements Process, Addison Wesley, 1999. Fig. 10.2 Every pixel counts. Reproduced from Fig. 4, p. 86, Eric Bergman and Rob Haitani: “Designing the PalmPilot: a conversation with Rob Haitani” from Information Appliances and Beyond ed. Eric Bergman, Morgan Kaufmann, 2000. Fig. 10.3(a) The KordGrip interface. Reproduced by permission of Wet PC. Fig. 10.3(b) The KordGrip in use under water. Reproduced by permission of the Australian Institute of Marine Science. Fig. 10.4 A cultural probe package. Reproduced from Figure 1, p. 22B. Gaver, T. Dunne and E. Pacenti (1999): “Cultural Probes” from Interactions 6(1) pp.21–29. Fig. 10.7 The living memory box. Design and Copyright Florian Vollmer, Interaction and Product Design, [email protected] Fig. 10.8 The Volere shell for requirements. Reproduced from http://www.volere.co.uk/template.htm Fig. 10.10 A scenario showing how two technologies, a Smartphone and wCommerce (wireless commerce) might be used. Reproduced by permission of Symbian Ltd.
Fig. 11.1 An example storyboard. Reproduced from Figure 8.2, p. 169, B. Hartfield and T. Winograd: “Profile: IDEO” in Bringing Design to Software ed. by Terry Winograd, Addison Wesley, 1996. Fig. 11.5 The patient kit for experience prototyping. Reproduced from Figure 1, Boyarski and Kellogg: DIS 2000—Design Interactive Systems, Processes, Practices, Methods, Techniques, Conference Proceedings, ACM. Fig. 11.6(a)(b) The third age suit: riding a bike & mobile phone. Photographs reproduced by permission of ICE Ergonomics Ltd., Loughborough, UK. Fig. 11.7 An example of a process-oriented conceptual model. From pp.212–214, The Usability Engineering Lifecycle by Deborah Mayhew, Morgan Kaufman, 1999. Fig. 11.8 Example plus and minus scenarios. Reproduced from “Scenarios in user-centered design—setting the stage for reflection and action” by Bodker, in Interacting with Computers Vol 13, Issue 1, 2000 Elsevier Science. With permission from Elsevier. Fig. 11.15 The “computer” highlights a term the user has just clicked on. Reprinted from “Paper Prototyping: Fast and Simple Techniques for Designing and Refining the User Interface” Caroline Snyder, 2003, with permission of Elsevier. Fig. 11.16 A newspaper cutting showing a parcel sorting machine mock up. Reproduced from P. Ehn and M. Kyng (1991): “Cardboard computers: mocking-it-up or hands-on the future” in Design at Work: Cooperative Design of Computer Systems, ed by J. Greenbaum and M. Kyng. Fig. 11.18 DENIM. Reproduced by permission of Prof. James Landay.
Fig. 12.2 Mockup of a household overview. Reproduced from S. Grisedale, M. Graves and A. Grunsteidl (1997): “Designing a graphical user interface for healthcare workers in rural India” in Proceedings CHI'97 pp. 471–478. Fig. 12.3(a) Icons drawn by ANWs in Punjab. Reproduced from S. Grisedale, M. Graves and A. Grunsteidl (1997): “Designing a graphical user interface for healthcare workers in rural India” in Proceedings CHI'97 pp. 471–478. Fig. 12.3(b) Representing people by gender and age. Reproduced from S. Grisedale, M. Graves and A. Grunsteidl (1997): “Designing a graphical user interface for healthcare workers in rural India” in Proceedings CHI'97 pp. 471–478. Fig. 12.3(c) Modal icons reflect state of patient. Reproduced from S. Grisedale, M. Graves and A. Grunsteidl (1997): “Designing a graphical user interface for healthcare workers in rural India” in Proceedings CHI'97 pp. 471–478. Fig. 12.4(a) The display shows the physiological data, two participants and a screen of a game they played. Reproduced from Mandryk and Inkpen (2004) “Physiological Indicators for the Evaluation of Co-located Collaborative Play”, CSCW 2004, pp. 102–111. Fig. 12.5(a) A participant's skin response when scoring a goal against a friend versus against the computer. Reproduced from Mandryk and Inkpen (2004) “Physiological Indicators for the Evaluation of Co-located Collaborative Play”, CSCW 2004, pp. 102–111. Fig. 12.5(b) Another participant's response when engaging in a hockey fight against a friend versus against the computer. Fig. 12.6 The preliminary design showing a view of the entrance into HutchWorld. Reproduced by permission of Springer-Verlag. Fig. 12.7 The Hutch V-Chat prototype. Reproduced by permission of Springer-Verlag. Fig. 12.8 A sample of the structured tasks used in the HutchWorld evaluation. Reproduced by permission of Springer-Verlag. Fig. 12.9 A fragment of the analysis of participant's ratings of ease of use of features encountered in the structured tasks. Reproduced by permission of Springer-Verlag. Fig. 12.10 The Olympic Message System kiosk. Reproduced from figure 12.4, p. 265, J. Gould, S.J. Boies, S. Levy, J.T. Richards and J. Schoonard (1990): “The 1984 Olympic message system: A test of behavioral principles of system design”. In J. Preece and L. Keller (Eds.) Human Computer Interaction (Readings) pp. 260–283. Prentice Hall. Fig. 12.11 Parent leaving a voice message for an Olympian. Reproduced from figure 12.4, p. 265, J. Gould, S.J. Boies, S. Levy, J.T. Richards and J. Schoonard (1990): “The 1984 Olympic message system: A test of behavioral principles of system design”. In J. Preece and L. Keller (Eds.) Human Computer Interaction (Readings) pp. 260–283. Prentice Hall. Fig. 12.12 The Hello.Wall. Reproduced from Figure 1, p. 45, Streitz et al. (2005) Designing smart artifacts for smart environments. IEEE Computer 38(3), pp.41–49. Fig. 12.13 Communication zones which depend on the distance from the display. Reproduced from Figure 2, p. 45, Streitz et al. (2005) “Designing smart artifacts for smart environments”. IEEE Computer 38(3), pp.41–49.
Fig. 14.3 The Tracksys “lab-in-a-box system”. Reproduced by permission of Dr. Harry Brignull. Fig. 14.4 The Tracksys system being used with a mobile device camera. Reproduced by permission of Dr. Harry Brignull. Fig. 14.5 The sequence of activities involved in remote usability testing using Userzoom. Reproduced from http://www.userzoom.com/ Fig. 14.6 Homepage of MedlinePlus. Reproduced by permission of Prof. Keith Cogdill. Fig. 14.7 Clicking Health Topics on the home page produced this page. Reproduced by permission of Prof. Keith Cogdill. Fig. 14.8 Categories of links within Health Topics for knee injuries. Reproduced by permission of Prof. Keith Cogdill. Fig. 14.9 The script used to greet participants in the MedlinePlus study. Reproduced by permission of Taylor & Francis Ltd. http://www.tandf.co.uk/journals Fig. 14.10 The script used to explain the procedure. Reproduced by permission of Taylor & Francis Ltd. http://www.tandf.co.uk/journals Fig. 14.11 The script used to introduce and describe the initial exploration task. Reproduced by permission of Taylor & Francis Ltd. http://www.tandf.co.uk/journals Fig. 14.12 The script used to direct the participant's behaviour. Reproduced by permission of Taylor & Francis Ltd. http://www.tandf.co.uk/journals Fig. 14.13 The debriefing script used in the MedlinePlus study. Reproduced by permission of Taylor & Francis Ltd. http://www.tandf.co.uk/journals Fig. 14.14 Homepage of revised version of MedlinePlus. Reproduced from http://medlineplus.gov/ Fig. 14.15 Clicking Health Topics on the home page of the revised version produced this page. Reproduced from http://medlineplus.gov/ Fig. 14.16 An example context-aware experience sampling tool running on PDA. Reproduced by permission of Stephen Intille. Fig. 14.17 Learning artifacts one month after delivery when trying to achieve the cinema experience. Reproduced from Figure 5, p. 85, M.J. Peterson, K.H. Madsen and A. Kjaer (2002): “The usability of everyday technology: Emerging and fading opportunities” in Transactions on Computer-Human Interaction (TOCHI) 9(2) pp.74–105. Fig. 14.18 Learning artifacts two months after delivery: finally establishing the cinema experience. Reproduced from Figure 6, p. 86, M.J. Peterson, K.H. Madsen and A. Kjaer (2002): “The usability of everyday technology: Emerging and fading opportunities” in Transactions on ComputerHuman Interaction (TOCHI) 9(2) pp.74–105. Fig. 14.19 Schematic image of tagging communicative utterances. Reproduced from S.C. De Souza The Semiotic Engineering of Human-Computer Interaction, MIT Press, 2005. Fig. 14.20 The homepage of the International Children's Digital Library. Reproduced from http://www.icdlbooks.org/ Fig. 14.21 American children make drawings to represent themselves and their community. Reproduced by permission of Anita Komlodi. Fig. 14.22 Mexican children working with an early prototype using a tablet PC. Reproduced by permission of Anita Komlodi.
Fig. 15.1 Curve showing the proportion of usability problems. Usability Inspection Methods, J. Nielson & R.L. Mack ©1994. Reproduced with permission of John Wiley & Sons Inc. Fig. 15.2 Homepage of REI.com. Reproduced from http://www.rei.com Fig. 15.3 A screen showing MoFax on a cell phone. Reproduced from T. Wright, P. Yoong, J. Nable, R. Cliffe, R. Hoda, D. Gordon and C. Andrease (2005): “Usability methods and mobile devices: A evaluation of MoFax” in Proceedings of HCI International LEA. Fig. 15.4(a) A bus indicator. Reproduced from Figure 1, p. 170, J. Mankoff, A. K. Dey, G. Hsich, J. Kientz, S. Lederer and A. Morgan (2003): “Heuristic evaluation of ambient devices”. In Proceedings of CHI 2003, ACM. Fig. 15.4(b) Lightness and darkness indicator. Reproduced from Figure 1, p. 170, J. Mankoff, A. K. Dey, G. Hsich, J. Kientz, S. Lederer and A. Morgan (2003): “Heuristic evaluation of ambient devices”. In Proceedings of CHI 2003, ACM.
Tables
Table 8.5 An illustration of open coding. Adapted from Table 4, S. Sarker and S. Sahay (2003) “Understanding Virtual Team Development: an interpretive study”, Journal of the Association for Information Systems 4, 1–38. Table 11.1 Relative effectiveness of lowvs. high-fidelity prototypes. Reproduced from J. Rudd, K.R. Stein and S. Insensee (1996): “Low vs. High-fidelity Prototyping Debate” in ACM Interactions Magazine, January 1996 pp.76–85. Table 11.2 Design guidelines for tabletop displays. Reproduced from S.D. Scott, K.D. Grant, & R.L. Mandryk (2003). “System Guidelines for Co-located, Collaborative Work on a Tabletop Display”. In Proceedings of European Conference Computer-Supported Cooperative Work (ECSCW) 2003 pp. 159–178 Kluwer Academic Publishers. Table 12.3 Mean subjective ratings given on a user satisfaction questionnaire. Reproduced from R.L. Mandryk and K.M. Inkpen (2004) “Physiological indicators for the evaluation of co-located collaborative play”. In Proceedings ACM Conference CSCW, pp.102–111. Table 12.4 Usability issues ranked according to importance. Reproduced by permission of Springer-Verlag. Table 14.1 The resources visited by participant A for the first task. Reproduced by permission of Taylor & Francis Ltd. http://www.tandf.co.uk/journals Table 14.2 Performance data for task 1. Reproduced by permission of Taylor & Francis Ltd. http://www.tandf.co.uk/journals
Cartoons
Chapter 1 ©Randy Glasbergen. Chapter 2 © Randy Glasbergen. Chapter 3 © CartoonStock http://www.cartoonstock.com/ Chapter 4 © CartoonStock http://www.cartoonstock.com/ Chapter 6 A Guide to Usability, Jenny Preece, © 1993 Pearson Education Limited. Reproduced with permission. Chapter 6 DOONESBURY © 1993 G. B. Trudeau. Reprinted with permission of UNIVERSAL PRESS SYNDICATE. All rights reserved. Chapter 9 © CartoonStock http://www.cartoonstock.com/ Chapter 11 © Roger Penwill. Chapter 12 © Randy Glasbergen. Chapter 13 © CartoonStock http://www.cartoon-stock.com/ Chapter 15 © The 5th Wave, www.the5thwave.com