
Apart from JQL and filters, JIRA also provides specialized reports to help you get a better understanding of the statistics for your projects, issues, users, and more.
Most reports in JIRA are designed to report on issues from a specific project, however, there are some reports that can be used globally across multiple projects, with filters. The following table shows all the reports that come with JIRA out of the box:
|
Description | |
|---|---|
|
Shows the relative workload for assignees of all issues in a particular project or issue filter. | |
|
Shows how much work a user has been allocated and how long it is estimated to take, based on values in the estimate fields. | |
|
Shows how much outstanding work there is (per user and per issue) before a given version is complete. | |
|
Shows progress towards completing a given version, based on issues' work logs and time estimates. | |
|
Shows the search results from an issue filter, grouped by a field of your choice. | |
|
Shows the number of issues created versus the number of issues resolved over a given period of time. | |
|
Shows the average time taken to resolve issues. | |
|
Shows the search results from a specified issue filter (or project) in a pie chart, based on a statistic of your choice. | |
|
Shows the average age (in days) of unresolved issues. | |
|
Shows the rate at which issues are being created in the current project. | |
|
Shows the number of issues for which your chosen date field (for example Created) was set on a given date. |
All JIRA reports are accessed from the Browse Project page of a specific project, regardless of if the report is project-specific or global. The difference between the two types of report is that a global report will let you choose a filter as a source of data, while a project-specific report will have its source of data predetermined based on the project you are in.
When generating a report, you will often need to supply several configuration options. For example, you might have to select a filter, which will provide the data for the report, or select a field to report on. The configuration options vary from report to report, but there will always be hints and suggestions to help you work out what each option is.
Perform the following steps to create a report; you will first need to get to a project's browse page:
- Bring up the drop-down menu from Projects.
- Select the project you wish to report on, or View All Projects if the project does not show up in the list.
- Click on the Summary tab if it is not already selected.
- Select the report you wish to create under the Reports heading. This will often bring you to the Report Configuration page.
- Specify the configuration options for the report.
- Click on the Next button to create the report.
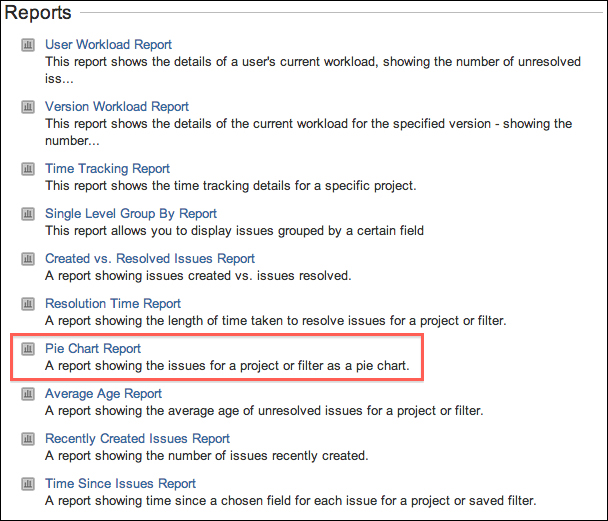
In the following example, we will be creating a pie chart report. We will first select the type of report to be generated by selecting it from a list of available report types that come with JIRA:
We will then configure the necessary report parameters. In this case, you need to specify if you are generating a report based on a project or an existing filter; by default, the current project will be preselected. You also need to specify which issue field you will be reporting on:

Once you have configured the report and hit on the Next button, JIRA will generate the report and present it on the screen:

The report type determines the report's layout. Some reports have a chart associated with it (for example, Pie Chart Report), while other reports will have a tabular layout (for example, Single Level Group By Report). Some reports will even have an option for you to export its content into formats such as Microsoft Excel (for example, Time Tracking Report).
The dashboard is the first page you see when you access JIRA. Dashboards host "mini-applications" known as Gadgets , which provide various data and information from your JIRA instance. The dashboard acts as a portal, which provides users with a quick one-page view of information that is relevant or of interest to them.
When you first install JIRA, the default dashboard you see is called the System Dashboard , and it is preconfigured to show some useful information, such as all issues that are assigned to you.
Since everyone shares the system dashboard, you as a user cannot make changes to it, but can create your own dashboards, and each dashboard's functions are configured independently:
- Bring down the drop-down menu from Dashboards.
- Select the Manage Dashboards option. This will bring you to the Manage Dashboards page:

From this page, you can edit and maintain dashboards created by you, search dashboards created and shared by others, and mark them as favorite, so that they will be listed as tabs for easy access.
When a dashboard is marked as favorite by clicking on the star icon in front of its name, the dashboard will be accessible when you click on the Dashboards link at the top menu bar. If you have more than one favorite dashboard, each will be listed in the tabs and you can select which one to display.
The default System Dashboard cannot be changed by users, so if you want to have a personalized dashboard displaying information that is specific to you, you will need to create a new dashboard. Perform the following steps to create a new dashboard:
- Bring up the drop-down menu from Tools.
- Select the Create Dashboard option. This will bring you to the Create New Dashboard page.
- Provide a meaningful name and description for the new dashboard.
- Select if you wish to copy from an existing dashboard or start with a blank one. This is similar to creating a new screen from scratch or copying an existing screen.
- Select whether or not the new dashboard should be a favorite dashboard (for easy access) by clicking on the star icon.
- Select if you wish to share the dashboard with other users. If you share your dashboard with the Everyone option, then users that are not logged in will also be able to see your dashboard.
- Click on the Add button to create the dashboard.
The following screenshot shows how you can create a new dashboard from scratch (blank dashboard) and share it with the members of the jira-users group, which by default, are all logged-in users:

Once you have created the new dashboard, you will be taken immediately to it. As the owner of the new dashboard, you will be able to edit its layout and add gadgets to it. We will be looking at these configuration options in the next section.
For dashboards created by you, you can edit its name and description, and choose to share it with other users so that they can access the dashboard by choosing it as a favorite:
- Browse to the Manage Dashboards page.
- Click on the Edit option for the dashboard you with to edit. This will bring you to the Edit and Share Dashboard page.
- Update the details of the dashboard.
- Select the group/project role to share the dashboard with.
- Click on the Update button to apply the changes.
For you to be able to share a dashboard, you will also need to have the Create Shared Object global permissions (please refer to Chapter 8, Securing JIRA, for more information on global permissions).
Dashboard creators can also delete dashboards they have created. However, it is important to note that if you have shared the dashboard, by removing it from JIRA, all other users that are using it will be affected:
- Browse to the Manage Dashboards page.
- Click on the Delete option for the dashboard you wish to remove. This will bring up the Delete Dashboard confirmation dialog box.
- Click on the Delete button to remove the dashboard.
The Delete Dashboard dialog box will alert you if there are users who have added the dashboard as favorite.
All custom created dashboards can be configured once they have been created. As the owner, there are two aspects of a dashboard you can configure:
- Layout: This describes how the dashboard page should be divided.
- Contents: This describes the gadgets that are to be added to the dashboard.
You have to be the owner of the dashboard (created by you) to set the layout. Setting a dashboard's layout is quite simple and straightforward. If you are the owner, you will have the Edit Layout option at the top-right corner while you view the dashboard.
JIRA comes with five layouts that you can choose from. These layouts differ in how the dashboard page's onscreen real estate is divided. By default, new dashboards have the second layout, which divides it into two columns of equal size:

After selecting a layout from the dialog box, it will be immediately applied to the dashboard. Any existing contents will automatically have their size and positions adjusted to fit within the new layout.
After you have decided on your dashboard's layout, you can start adding contents, known as gadgets, onto your dashboard. But before you get to that, let's first take a brief look at what gadgets are.
If you are familiar with the personalized Google homepage (iGoogle), you should be fairly familiar with gadgets by now. As a matter of fact, JIRA and iGoogle gadgets are built on the same technology.
Gadgets are like mini applications that live on a dashboard in JIRA. Each gadget has its own unique interface and behavior, for example, the Pie Chart gadget displays data in a pie chart while the Assigned to Me gadget lists all the unresolved issues that are assigned to the current user in a table.
To discuss the in-depth details of gadgets and OpenSocial is beyond the scope of this book, but there is much information on this topic available on the Internet, if you are interested in creating your own gadgets to use with JIRA. A good place to start will be the Atlassian documentation at http://confluence.atlassian.com/display/GADGETDEV/Getting+Started+with+Gadget+Development.
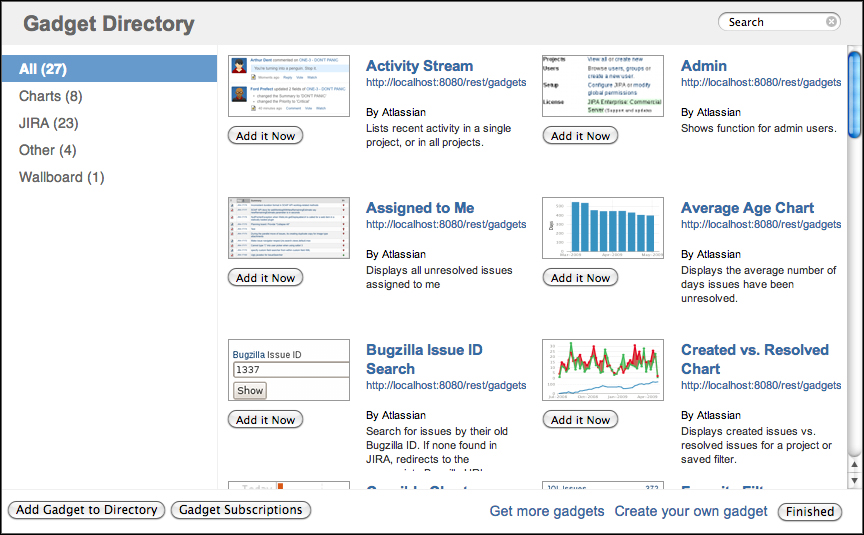
All gadgets are listed in the Gadget Directory. JIRA comes with a number of useful gadgets, such as the Assigned to Me gadget that you see on the System Dashboard. The next screenshot shows the gadget directory, listing all the bundled gadgets in JIRA.
Perform the following steps to place a gadget onto your dashboard:
- Bring up the drop-down menu from Dashboards.
- Select the dashboard you wish to add a gadget to.
- Click on the Add Gadget option at the top-right corner. This will bring up the Gadget Directory window:
- Click on the Add it Now button for the gadget you wish to add.
- Click on the Finish button to return to the dashboard:
Depending on the gadget you have selected, some gadgets will require additional options to be configured. For these gadgets, you will be presented with their configuration screen on the dashboard. Fill in the options and click on the Save button.
The next screenshot shows the configuration screen for the Assigned to Me gadget, where you can control the number of results to show and the fields to include. One common parameter is the Refresh Interval option, where you can decide how often the gadget should refresh its content, if you stay on the dashboard or stay static if you choose never. Whenever you refresh the entire dashboard, all gadgets will load the latest data, but if you stay on the dashboard for an extended period of time, each gadget can automatically refresh its data, so the content will not become stale overtime:

When you add a gadget, it's usually added to the first available spot on the dashboard. This sometimes may not be where you want the gadget to display, and in other cases, you might want to move the existing gadgets around from time to time. As the owner of the dashboard, you can easily move gadgets on a dashboard, through a simple drag-and-drop interface:
- Browse to the dashboard that has gadgets you wish to move.
- Click on the gadget's title and drag it to the new position on the dashboard.
As soon as you drop the gadget to its new location (release your mouse button), the gadget will be moved permanently until you decide to move it again.
After configuring your gadget when you first place it onto your dashboard, the gadget will remember this and use it to render its content. You can update the configuration details or even its look and feel.
- Browse to the dashboard that has gadgets you wish to update.
- Hover over the gadget and click on the down arrow button at the top-right corner of it. This will bring up the gadget configuration menu.
- Click on the Edit option.
- This will change the gadget into its configuration mode.
- Update the configuration options.
- Click on the Save button to apply the changes:

The preceding screenshot shows the edit menu for the Assigned to Me gadget. You can force a refresh with the Refresh option. Since gadgets retrieve their data asynchronously via AJAX, you can use this option to refresh the gadget itself, without refreshing the entire page. The edit, delete, and color options are only available to the owner of the dashboard.
As the owner of the dashboard, you can remove the existing gadgets from the dashboard when they are no longer needed. When you remove a gadget from a dashboard, please note that that all the other users who have access to your dashboard will no longer see it:
- Browse to the dashboard that has gadgets you wish to delete.
- Hover over the gadget and click on the down arrow button at the top-right hand corner of it. This will bring up the gadget configuration menu.
- Click on the Delete option.
- Confirm the removal when prompted.
Once removed, the gadget will disappear from the dashboard. If you choose to re-add the same gadget again at a later stage, you will have to reconfigure it again.