
1. You, Inc.
“...I am technically broke because I have little money in the bank, I owe money on my credit cards, and I have no retirement savings....”
—Myth #1
Let’s go back to the very beginning of financial life and let me introduce an entity called You, Inc. This is a small, tightly controlled, privately held company with the bulk of its productive assets invested in nontraded units of your future salary and wages. Your objective as CEO, CFO, and chairman of the board is to maximize shareholder value of You, Inc. while minimizing the financial risks faced by the corporation.
In fact, the financial and risk management strategies plotted in corporate boardrooms of large businesses can be applied to the management of your daily finances. Like any corporate executive, you must take a long-term view when making financial decisions, but at the same time, you have to monitor and control the risks that You, Inc. faces over your entire lifecycle.
The Wall Street Journal doesn’t report on the activities of You, Inc. very often, but its corporate history is well known: You, Inc. started life as a subsidiary of a larger company called Parents, Inc., and for much of its first two decades, You, Inc. was an asset (or liability) on Parents, Inc.’s balance sheet. In purely financial terms, Parents, Inc. likely found You, Inc. to be a poor investment: According to conservative estimates, parents spend at least $100,000 on a child during the first 18 years of his or her life, and might never see substantial dividends. Consequently, the board of Parents, Inc. tends to anxiously look forward to the day when it can spin You, Inc. off into a separate entity.
As the human lifecycle continues, You, Inc. will eventually consider merger opportunities otherwise known as marriage. Marriage is the largest merger and acquisitions (M&A) activity undertaken by You, Inc., and might occur more than once. Most business mergers usually have a breakup fee attached to the deal. This is meant to protect the interests of the larger and more established company, in the event things go sour prior to consummation. Modern marriages have adopted similar, albeit longer dated, provisions under the ominous name of prenuptial agreements. Once again, this contract is meant to protect the economic interests of the party that stands to gain the least from the merger. In fact, many a merger in the human capital industry of which You, Inc. is part have been scuttled over the meager terms of such agreements.
After the assets are successfully combined and management cultures reconciled, the enlarged You, Inc., which is perhaps now rightfully called Family, Inc., usually looks to acquire new headquarters. Besides the productivity potential of your human capital, your home is your second largest asset. But the investment in a home is undiversified and illiquid, because it can’t be sold off piecemeal; hence it can be considered riskier than most publicly traded investments such as stocks and bonds. Millions of homeowners who are currently facing foreclosure on their homes because the value has dropped under the amount of debt they owe on the house are experiencing the fact that a personal residence is not a risk-free investment. Like education and college tuition, the purchase of a house is usually financed with debt, a deal that requires the best of your CFO skills. Each of the myriad loan and mortgage options has its own risks and rewards. But as every good CFO knows, speculating on the direction of interest rates is an ill-advised endeavor. The choice between long-term fixed or short-term floating debt, as well as the maturity of the “bond” (the mortgage), depends on corporate needs, tax considerations, and budgeting issues. If, for example, your budget can allow for potential spikes in fluctuating payments, you are better off with a variable or adjustable mortgage, but if cash is tight, fixed is the way to go. The global push toward shareholder activism has not gone unnoticed within You, Inc., and the various stakeholders, such as children, spouse, and in-laws, will eventually push for a place in the corporate boardroom. You might be the largest single shareholder, but your family members are minority shareholders with protected rights. If anything should happen to jeopardize your lifespan or future productivity, they would suffer grave financial consequences. Prudent risk management dictates that you purchase a variety of insurance policies to protect your largest asset, as well as other investments, projects, and assets you couldn’t afford to lose. Practically speaking, the median 30-year-old with $600,000 to $800,000 worth of future earnings would be well advised to buy a similar amount in life insurance.
As your life cycle continues, You, Inc. will likely have some spare cash, and you face difficult dividend-policy choices. A vocal (and likely teenaged) minority on the board might be pushing for big jumps in dividends. However, a savvy CEO will lean toward retaining the earnings because You, Inc. is likely saddled with severe credit constraints and needs to fund future growth.
Because You/Family, Inc. is not a publicly traded company, it can’t tap the capital markets to finance new investment projects. After all, you have little in the way of hard assets to pledge as collateral until much later in the life cycle, and financial institutions tend to frown on purchasing shares in You, Inc. on account of slavery being illegal. That leaves you with the option of using internal cash (that is, personal savings) or the much costlier alternative of borrowing from the bank. For many, credit cards are the last (or at least most convenient) resort. But, with effective credit card interest rates being stratospheric, finding a use for that borrowed money that’s worth the cost is hard.
The preceding analogy might be pushing the limits of reality, but I believe the underlying idea, that you should think of yourself as a company and manage your financial affairs using similar techniques, leads to a number of practical insights and takeaways. Thinking like this can help you make better financial decisions. I will get to them later in this chapter and the book, but at this point I want to go back to the first principles and ask, “What is You, Inc. worth?”
What Are You Worth?
Although I can’t answer this question for you personally, I can give you a look at a snapshot of the finances of the typical U.S. household, which I have called “Family, Inc.” I can do so using comprehensive data from the Survey of Consumer Finances (SCF), conducted by the U.S. Federal Reserve Board. This survey provides a very comprehensive picture of various financial aspects of the personal balance sheet, and I will start with the tangible assets (also known as the left side of the personal balance sheet).
The numbers are slightly out of date because these surveys take time to complete, but in 2009 the typical U.S. family unit had median assets of $192,100, which represents a decline of 10.7% in real (inflation-adjusted) terms since the 2007 financial crisis. This median number means that if we were to rank the assets of “richest” to the “poorest” American family, the halfway point would be $192,100. This means that 50% of families have more assets and 50% of families have less. Now, remember, assets don’t necessarily imply wealth. If you have $192,100 in assets and exactly $192,100 in offsetting debt, then you have zero equity or net worth and have no real wealth. So for now, let’s focus just on assets of the typical American and then later we can get to the debts and family net worth.
The total assets reported in the SCF can be further subdivided into financial and nonfinancial assets; Table 1.1 shows the median market value of the financial assets that Family, Inc. has accumulated. U.S. family assets include transaction accounts, such as checking, savings, and money market deposit accounts and low-risk certificates of deposit. Assets also include tax-sheltered retirement assets such as IRAs (or individual retirement accounts), pooled investment funds (including hedge funds and real estate income funds), and the cash-value of life insurance policies. Other assets include trusts, annuities, managed investment accounts, futures contracts, and loans made to others. There should be no surprises here. In fact, you might recognize your own personal balance sheet as having very similar assets.
Table 1.1. Financial Assets of Family, Inc.
Source: U.S. Federal Reserve, “Surveying the Aftermath of the Storm: Changes in Family Finances from 2007 to 2009,” Table 5; IFID Centre calculations.

Table 1.1 allows us to imagine a typical American family that is in their early forties. They have a checking account and a money market mutual fund account collectively valued at $4,000 and retirement assets of $48,000, which they have accumulated through their work pension plans. They have accumulated $7,300 in tax-deferred savings within an insurance policy, something I discuss further in Chapter 3, “Diversification over Space and Time.” They have invested a large portion of their financial capital—$50,000—in government, corporate, and foreign bonds, and $12,000 in publicly traded stocks. In fact, you should construct your own personal balance sheet listing of assets, which is an important exercise to do on an annual basis. It should look similar to Table 1.1.
It is evident from Table 1.1 that the financial crisis took a significant toll on the assets of Family, Inc., with every asset class (except savings bonds) seeing considerable declines in value since 2007. The worst-hit financial asset was stocks, declining by more than 35%, whereas the impact on money market accounts (CDs) was less pronounced with a decline of only 3%. Taking the relative weighting between money market instruments and equities (stocks), we see that investors have flocked toward safer assets such as cash during the financial crisis. This can be confirmed through a study done by UBS Wealth Management Research. UBS found that before the financial crisis, money market assets as a percentage of S&P 500 market capitalization were on average below 20%. During the financial crisis, this spiked in excess of 60% and has stayed well-above average ever since. Clearly, investors are reluctant to recommit their cash to equity markets, instead opting for a low-risk, low-return strategy.
Another consequence of the financial crisis is that the value of the average retirement account has declined by more than 5% since 2007—normally it would be expected to increase by that amount on a yearly basis. For some soon-to-be retirees, this 5% average hit to their nest egg might be significant enough to delay retirement. Consequently, the financial crisis has added a new dimension to retirement planning; prospective retirees must now carefully review their retirement goals, increase their funding levels (if appropriate), and reevaluate their risk budgets.
Table 1.2 moves on to the nonfinancial and illustrates that the median family has various personal use assets that they might consume or use in their daily lives. The most common nonfinancial asset is a vehicle. If we think in terms of medians, they would have purchased a new car less than two years ago, and its current market value is estimated at $12,000. The house they reside in is valued at $176,000 and they have a vacation property that they’ve recently acquired for $150,000. According to Table 1.2, approximately 11.9% of American families have equity in a privately held business. The median value of this business holding (for those who own this type of asset) is $94,500.
Table 1.2. Nonfinancial Assets of Family, Inc.
Source: U.S. Federal Reserve, “Surveying the Aftermath of the Storm: Changes in Family Finances from 2007 to 2009,” Table 5; IFID Centre calculations.

As expected, with the influx of foreclosed properties on the market as well as the bursting housing bubble, Americans naturally saw the value of their real-estate holdings decline by more than 15%. Coupled with their high mortgages, this 15% drop has eroded the average American’s home equity and is a major contributing factor to declines in Family, Inc’s net worth (which will be discussed later in this chapter).
Your human capital is going to be more important than ever before.
Once again, this is as good a time as any to encourage you to sit down and create a similar list of all your financial and nonfinancial assets. There is little point in creating a long-term financial plan without having a detailed snapshot of your current assets. At the very least, the type of information contained in Tables 1.1 and 1.2 will enable you to benchmark yourself relative to the population as a whole. Remember, though, we will return later to one asset class that is missing from both tables—the value of your human capital. For now, let’s stick to the traditional accounting numbers.
Either way, I have just reviewed the various assets of You/Family, Inc. The main takeaway, of course, is that approximately 56% of families report having money in “retirement accounts” and the median amount of money in these accounts is $48,000. Will it be enough to finance retirement? That is one of the main questions addressed later in the book. For now, let’s move on to some other financial metrics and benchmarks.
The pretax “bottom line” of Family, Inc. is shown in Table 1.3. It lists the average versus the median pretax income per family unit, measured over a 15-year period. The average numbers are consistently higher than the median numbers. This is because the median treats all families equally, whereas the average places a greater weight on the wealthier families. Keeping this distinction in mind is important. Remember that the median “value” of the three numbers {1,10, 88} is exactly 10 units. It is the halfway mark. However, the average “value” is a much larger 33, because if you add these three numbers together and divide by three, you get 33 units.
Table 1.3. Pre-Tax Incomes Per Family Unit in Constant Dollars (in Thousands)
Source: U.S. Federal Reserve Consumer Finances Survey 2010, Table 1 89–98, Table 1 01–10.

Either way, in 1989, the family unit earned an average income of $69K (in year 2010 dollars), and by the year 2007 it increased to more than $88K. This is obviously good news—the sign of a growing corporation. However, recently released 2010 data shows that the financial crisis has pushed both the average and median values of income down to $78.3K and $45.7K respectively because of higher unemployment and downward pressure on wages. In fact, at the peak of the financial crisis, the unemployment rate was 10%, the highest it had been in the U.S since the 1980s.
Of course, the opposite of all the assets listed in Tables 1.1 and 1.2, which occupy the left side of the balance sheet, are Family, Inc.’s liabilities on the right side. Remember that accountants traditionally place the assets of a corporation on the left side and the liabilities plus “equity capital” on the right side. I’ll get to a picture of that in a moment.
Indeed, whether one wants to buy a brand-new car, finance a graduate degree, or purchase a new home, in North America we have access to a number of credit and lending sources that allow us to make such purchases today even if we do not have sufficient financial assets to do so. I discuss the merits and pitfalls of debt in much greater detail in Chapter 4, “Can Debt Can Be Good at All Ages?,” but now let’s look at what people are actually doing. It seems people hold debt in a number of forms and use it to accomplish numerous goals. So what do Americans owe? How does the level and composition of this debt evolve over the life cycle?
About 77.5% of the population carries at least some form of debt, and the median total debt equaled $75,600 in 2009, according to the U.S. Federal Reserve Consumer Finances Survey published in 2009. This is an increase of 7.5% since 2007.
Table 1.4 focuses in on Family, Inc.’s liabilities. Unquestionably, the most prevalent and the second biggest type of debt on Family, Inc.’s balance sheet, which has increased significantly in recent years among the population, is its outstanding mortgage. The 49% of families with this type of debt are carrying a balance of $112,000. A mere 5% have other forms of home-equity credit in the amount of $130,000.
Table 1.4. Liabilities and Debts of Family, Inc.
Source: U.S. Federal Reserve, “Surveying the Aftermath of the Storm: Changes in Family Finances from 2007 to 2009,” Table 5; IFID Centre calculations.

Credit card debt, a very widely used source of credit among the U.S. population, is totaled at $3,300 on Family, Inc.’s balance sheet. Note that 43% of the population has this credit card debt. This number only includes families who are not paying off the balance in full at the end of the month. Approximately 7% have other forms of debt with a median amount owed of $4,000. Note that this “other” category is a catch-all that can include wonderful strategies such as margin debt (or borrowed money used to purchase investment assets—a concept I discuss in detail in Chapter 4). This category can also include items such as loans against a pension in a current job or against a cash value life insurance policy, or perhaps even an informal loan from the neighborhood loan shark. It seems like Americans have a robust and diversified portfolio of debts. Although some debts make perfect sense, other types of debt such as credit cards and installment loans might raise an alarm bell or two if the funds are being used to acquire depreciating assets that lose value over time.
Table 1.5 examines the debt data from a more formal corporate accounting perspective. It compares the amount that a family owes relative to the value of their assets. In some sense, the lower the ratio of debt to assets, the more healthy the family; although exceptions to this rule exist, it generally holds true. In families whose major breadwinner is under the age of 35, the amount of debt they have relative to assets is roughly $97 per $100. If you remember the fundamental formula that net worth or equity equals assets minus liabilities, then the typical family under the age of 35 has equity of $3 and debts of $97, which implies a debt-to-equity ratio of more than 32 to 1. Such a high ratio in this stage of life is a good reason to think in a more integrated fashion about debt management.
Table 1.5. Debts Versus Assets of Family, Inc.
Source: U.S. Federal Reserve, “Surveying the Aftermath of the Storm: Changes in Family Finances from 2007 to 2009,” Appendix Table 3B and Appendix Table 4B; IFID Centre calculations.

One other observation that emerges out of Table 1.4 is that households seem to be diversifying their liabilities among a number of credit sources that charge different interest rates and maintain different terms. Even though the principle of diversification goes a long way as a portfolio hedging tool, it should not be overextended as it has no place in your debt strategy. In fact this is the one area of your personal finances where your eggs should be placed in one basket. To optimize one’s debt strategy, outstanding balances in different loan “silos” should be consolidated at the lowest possible rate. This can add up to substantial savings over time.
This brings me to the last and very important number that conveys information about the financial state of You, Inc.—the median net worth. This value also rests on the right side of the traditional balance sheet as “Equity” and simply equals the family unit’s assets minus its liabilities. The median net worth of Family, Inc. was $96,000 in 2009, representing a precipitous decline of 23.4% in inflation-adjusted terms since the onset of the financial crisis in 2007. At first you might wonder why this 23% change in equity is so high compared to the 11% drop in assets and 7.5% increase in debt. Well, the reason for this is that equity is a function of both debt and assets and therefore captures both the fall in assets and rise in debt.
Table 1.6 presents some interesting data for the population at large. This table displays the extent to which the family unit median net worth varies with the income percentile of the primary breadwinner. Although this observation is somewhat expected because of increased savings that might accompany higher income, the variation in net worth is quite remarkable. This disparity also highlights the potential benefit of tailored financial recommendations and strategies.
Table 1.6. Median Net Worth (Ranked by Income Percentile)
Source: U.S. Federal Reserve, “Surveying the Aftermath of the Storm: Changes in Family Finances from 2007 to 2009,” Appendix Table 1B; IFID Centre calculations

Particularly relevant to our discussion of You, Inc., and the lifelong risk management process that you must undertake, is the question of how net worth changes over the lifecycle. Economists summon the so-called “lifecycle hypothesis” to describe the change in financial net worth or wealth as we age. At young ages we have little financial capital or often a negative net worth. Many people borrow money to invest in their education, such as student loans and the like, and therefore start their financial life cycle with little if any net worth. This changes as we grow older, pay back our debts, invest in housing and other assets that might appreciate over time, and gradually approach the retirement years. While we continue to spend, our growing income allows us to accumulate savings. Our financial net worth peaks at the end of our working years and is gradually reduced as we continue to spend throughout retirement. We try and smooth our spending patterns and standard of living throughout these periods in our lives. Remember that this is an economic hypothesis or theory and obviously doesn’t imply that everyone behaves this way, nor does it mean that you personally should behave in this manner.
Real-world data is, in fact, consistent with this hypothesis and is summarized in Table 1.7. Households where the main breadwinner is less than 35 years of age have the low median net worth of $9,000. With each age group, you can see that the net worth figure rises substantially as we work toward our financial goals and retirement. The number peaks just prior to retirement with a median net worth of $222,300 for the age 55–64 age group and falls to $191,000 for the group above the age of 75. In other words, it seems that despite some notable exceptions, many individuals do, in fact, behave according to the axioms of the life cycle hypothesis. Stated differently, if you want to smooth your consumption over the course of your financial life—which makes sense on multiple levels—then your financial net worth will rise as you accumulate wealth up until the age of 65, and then fall as you manage risk well into retirement.
Table 1.7. Median Net Worth by Age of Household Head
Source: U.S. Federal Reserve, “Surveying the Aftermath of the Storm: Changes in Family Finances from 2007 to 2009,” Appendix Table 1B; IFID Centre calculations

Let’s return for a minute to the early stages of the human life cycle—your late teens and early 20s.
At this age, what was previously a corporate shell becomes an operating unit, and you face the first, and perhaps most important, decision as the head of You, Inc: how to develop and where to invest the company’s human capital. “Human capital” refers to your abilities and skills, which you acquire genetically and through education. Through investing in education, job training, and business networking, you can build a large stock of human capital that can be mined by You, Inc. for many years, and perhaps generations, to come. Your human capital is converted into financial capital through the earnings and wages you receive during your work career. Hence, we measure your human capital through estimating the value of all your future earnings and wages. The greater your income prospects, the greater your human capital, and the greater the value of You, Inc.
In Table 1.7, the net worth numbers for the median American under age 35 tell a bleak tale. Yet one of the main ideas in this book is that when you are young, broke, and possibly in debt, you likely have 30 to 40 productive years of income-generating work ahead of you. Also, although some readers might find the prospect of so many years of work to be depressing, the fact is that the present or discounted value of this income can be in the millions of dollars. This is no different than any major publicly traded mining company or an oil producer that owns mines and wells that are deep underground and years away from producing any cash flow. It might take decades before they will generate any profits for the company, yet these same companies are allowed to display and value these assets on their balance sheet with the full blessing of financial accountants and securities regulators. Why should it be any different for You, Inc? Thus, I argue that the total asset and net worth values we just examined are understated. As you assess your net worth, the traditional accounting-approach balance sheet should be modified to include human capital along with tangible assets to truly reflect the value of You, Inc. (see Figure 1.1).

Figure 1.1. We reach the main point—human capital.
Let me repeat this point again because it is crucial for the next few chapters and for most of the book. The single most precious asset on your personal financial balance sheet is not your savings account, your investment portfolio, your jewelry, or even your house. Rather, it is the discounted value of all the salary, wages, and income you will earn over the course of your working life. This asset is called human capital, and though its precise numerical value might be hard to obtain and difficult to calculate, the fact remains that it’s the best asset you have until well into your middle age.
Figure 1.2 was created by considering a hypothetical person, John, who graduates from college at the age of 22 and earns a starting salary of $35,000. John has a steady stream of earnings that grow by 2% yearly until he retires. These earnings are discounted by a relatively low discount rate of 2% due to the stability of his job. John also saves 20% of his salary every year, converting it into financial capital to be used later in retirement. Figure 1.2 shows John’s ratio of human capital to total capital at different stages of his life. Although this graph was generated using values specific to John, your personal graph will look very similar.

Source: IFID Centre calculations, 2012.
Figure 1.2. Even retirees can still work, if they want to.
The figure illustrates that in the years when we think we are worth the least in pure financial terms, we are actually the wealthiest in terms of our human capital. Once again, you are wealthier than you think.
You might be thinking, what good is knowing the value of an asset that you can’t immediately use, spend, or borrow against? But I argue that this is precisely the asset that you should take into account when making many of your financial decisions from your initial years of work to beyond retirement. At the very least, get into the habit of computing the value of your human capital each time you get an account statement from the bank, insurance company, or mutual fund listing the value of your financial investments. By doing this exercise, you will get a comprehensive picture of your true net worth and not just a partial view. In many cases, your (limited, narrow) financial investments might have declined in value, but your human capital might have increased by much more. In other cases, it will be the other way around. Either way, it is the sum of the financial capital and human capital, together with the value of your house and other nonfinancial assets, that should truly matter for your financial decisions and well-being.
The concept of human capital as a driver and motivator of household economic decisions was popularized by Professor Gary Becker from the University of Chicago, who was awarded the 1992 Nobel Laureate in Economics. Back in 1964 he published a book with the simple title, Human Capital, in which he argued the importance of education in promoting economic development. In his work, using U.S. Census data, he documented that the rates of return from investing in education were substantial. His analysis showed that not only was investing time and effort in acquiring and refining one’s education worthwhile, but it was also a key differentiator of economic success in different countries.
His path-breaking analysis, which was considered rather controversial at the time, was one of the first to justify human capital as a legitimate asset class. At the time, many viewed an advanced college or university education as a luxury item that only the rich could afford. What Professor Becker showed was that spending on education was best viewed as an investment as opposed to consumption or expenditure.
So, for example, if you decide to become a brain surgeon, you invest some 15 years of your life, along with the forgone wages during that time, to develop a gold mine of human capital invested in the medical industry. As a newly minted medical resident, you have few financial assets and likely a large debt from financing the education, but the value of your human capital will be in the millions. If, on the other hand, you opt to enroll in a six-month course in auto mechanics, you invest little human capital. Although this investment might lead to positive cash flow relatively soon, it is not associated with much income stability. The rate of return on “cheap” human capital, when you don’t invest much time and effort in developing that human capital, should be quite low.
Table 1.8 summarizes the trade-off between spent tuition dollars and additional education, and its consequences. So while you sacrifice time and foregone wages as you study, you ultimately increase the size of your human capital. And, in fact, this increase in the present value of your future earnings might quite easily justify your expenditure on additional years of school. For example, from the analysis in Table 1.9, if you are currently earning $50,000 and decide to invest in a particular graduate degree that costs $80,000, your income will only need to increase by $6,550 or 13.1% to justify this seemingly large expense.
Table 1.8. School and Human Capital Analysis
Source: Moshe Milevsky and the IFID Centre, 2012.

Table 1.9. By How Much Does Your Salary Have to Increase to Justify Investing in Education?
Assumptions: 2 years education, 3% wage growth, and 20-year career.
Source: Moshe Milevsky, Calculations, Fall 2010.

Obviously a number of assumptions are built into the numbers displayed in the table, but the general relationship holds true regardless.
For those who are not yet convinced, then Table 1.10 further illustrates the aforementioned points by showing the annual returns on various investments. In this study done by the Brookings Institute, data was taken from 1950 up until 2010 and the annual return was calculated in real terms (that is, adjusted for inflation). The results are remarkable; financial and nonfinancial assets generate meager annual returns between 0.4% and 6.8%, while human capital is the true star of the asset side of the balance sheet, earning in excess of 15% yearly. Essentially, a $102,000 investment in a college degree (tuition fees plus foregone earnings over a 4-year period) yields a 15% annual return. According to this same study, over a lifetime, this is on average $570,000 more than someone with only a high school diploma. This demonstrates the importance of building up your human capital as early as possible, so you can reap the rewards of a high annual return for a longer period of time.
Table 1.10. Median Net Worth by Age of Household Head
Source: The Brookings Institute, “Where is the Best Place to Invest $102,000—In Stocks, Bonds, or a College Degree?” 2011

Simply having a general college degree is not sufficient in building up your human capital. Table 1.11 illustrates this by showing the eight majors with the highest salary offers. Naturally, all eight engineering-related jobs share something in common—they are highly technical fields. If you contrast these salary offers to the national average of $48,350, or the $32,555 average by liberal arts majors, you see a major disparity. Clearly, those who studied engineering have more valuable human capital than those who studied liberal arts (or any other major).
Table 1.11. Average Bachelor Degree Salary Offer in Winter 2010
Source: National Association of Colleges and Employers, “Winter 2010 Salary Survey of Employee Offers” 2010
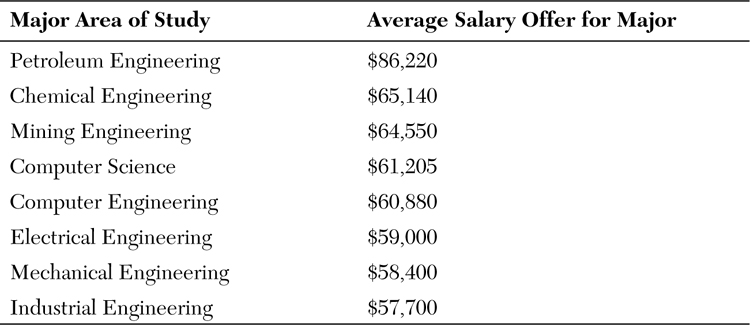
Why is engineering a more valuable degree? First, there is a low supply of skilled engineers. Very few people go into engineering programs, and even fewer successfully graduate. Comparatively, many more Americans pursue liberal arts degrees and flood the job market with an endless supply of workers upon graduation. Also, because these positions require a highly technical skill set that isn’t easily learned, engineering jobs cannot easily be substituted with other skilled labor. Finally, engineering jobs are typically recession proof, and thus the associated human capital is relatively stable over time.
Looking back at the financial crisis, someone with a personal balance sheet that had very little human capital and was mostly comprised of financial capital would have suffered a great blow to their net worth. However, someone with large amounts of human capital, such as an engineer, would be relatively unscathed, because their skill set and ability to earn income would remain relatively untouched. Thus, the value of human capital cannot be understated; it earns a high annual return and shields your net worth in times of economic distress.
Alas, You, Inc. only has a limited amount of human capital. As shown in Figure 1.3, as your life cycle approaches its twilight and enters the retirement phase, the ability to generate new financial capital using human capital decreases dramatically.

Source: Ibbotson Associates.
Figure 1.3. A snapshot of your evolving economic life.
Hence, the ongoing health of You, Inc.’s financial situation depends on converting your finite human capital into financial capital, and ensuring that you grow your financial capital sufficiently to support you and your family when the “gold mine” of human capital can no further be mined.
You will see in the future chapters that the size of this important asset has relevance for numerous investment decisions that you will be faced with throughout your life cycle. The value of your human capital is what you should consider when purchasing life and other forms of insurance, and your human capital’s riskiness should be incorporated into all your investment decisions.
Summary
• The typical 40-year-old has more than $55 of debt per $100 of assets. Overall, the typical family unit has more than $37 of debt per $100 of assets. The median amount of money in retirement accounts is a mere $48,000, and 44% of American families do not have any retirement account. All this implies that many Americans will have to drastically reduce their standard of living at retirement or retire much later than they expected.
• The traditional accounting measures of personal financial net worth and equity are computed as the value of assets minus the value of liability.
• Even though you might have very little if any financial equity, you are wealthier than you think. In fact, you probably have an asset worth millions of dollars. It’s called human capital. Think of it as the “nest embryo” that will eventually become your “nest egg.”
• As you age you convert human capital into financial capital. Your total capital, which is the sum of both types of capital, should be increasing over time.
• Depending on how risky your job is, you might think of your human capital as a stock or as a bond or some combination in between. This analogy will come in handy later, when we talk about comprehensive asset allocation—considering both your human and financial capital—over the life cycle.
• In particular, individuals who expect to receive little or no income from a defined benefit pension plan must be even more careful to manage the conversion of their human capital into financial capital so that they secure a smooth income stream over their entire life cycle.
• The financial crisis has wreaked havoc on Family, Inc.’s balance sheet—debt has grown, assets have plummeted in value, and net worth has fallen by more than 23%. Those approaching retirement must reconsider the impact of this crisis on the sustainability of their retirement strategy.
Endnotes
Modigliani (1986) describes his path-breaking research that led to his Nobel prize, as well as how he developed the life cycle hypothesis. The book by Becker (1993), yet another Nobel laureate, contains a number of his pioneering articles on the economic returns to human capital investment. Bodie, Merton, and Samuelson (1992) wrote the first formal article within financial economics to treat human capital as an asset class that can be primarily treated as a bond. The monograph by Ibbotson, Milevsky, Chen, and Zhu (2007) provides a more technical and mathematical analysis of the value of human capital, in addition to a number of actual case studies and examples that expand on the ideas in this chapter and the next one. Lee and Hanna (1995) wrote another early and relevant paper on how to think about human capital within the context of financial planning. The book by Lleras (2004) is an accessible book on the international returns to investing in human capital. On a separate note, and for a readable account of the events surrounding the financial crisis, the book by former Treasury Secretary, Henry M. Paulson (2010) as well as the book by Andrew R. Sorkin (2009) called Too Big to Fail provide a wealth of fascinating information.