
7. Longevity Is a Blessing and a Risk
“...According to the National Centre for Health Statistics life expectancy in the U.S. is approximately 80 years, so I should plan for about 15 years of retirement....”
—Myth #7
The life expectancy number is quite true, and one often reads that at the end of the 20th century, life expectancy in the U.S. hit a record high of approximately 73.6 years for males and 79.2 years for females. Based on statistics from the Social Security Administration (SSA), which apply to the U.S. population in its entirety, these numbers have been steadily increasing over time: In 1950 the respective values were 65.6 for males and 71.1 for females. Yet, you might wonder why there is all the fuss about financing a long period of retirement. Yes, people are living longer compared to 50 years ago and they are living healthier. But can saving enough money during your working years to generate an average of 10 to 15 years of income be that onerous?
Of course, most financial professionals will know that these numbers do not apply to their healthier and wealthier clients. More critically, these numbers apply only at birth, not at retirement, and do not account for any possible reductions in future mortality. They are based on today’s death and survival rates.
If you are a 75-year-old-male or -female, your life expectancy is much higher than at age zero. In this case, using the same SSA statistics, the numbers are now 84.6 and 86.9, respectively. The headline values—73.6 and 79.2—only apply to newborns. As you age and, hence, survive hazards such as infant mortality, teenage accidents, child bearing years, and so on, your life expectancy at these higher ages increases.
Yet, when talking to individuals who are outside the financial services (or medical) profession, I find that pervasive confusion exists regarding what these life expectancy numbers actually mean. These misunderstandings can lead to behaviors that result in undersaving and underestimates of retirement income needs. In this chapter, I take a closer look and discuss some of the misconceptions as they relate to longevity and the amount of time your financial capital truly must last.
Life Expectancy Is Not That Meaningful
To start off, I think that life expectancy averages are not the best way to explain these ideas. Averages can be deceiving. In fact, there is a silly joke about a statistician who immerses one hand in scalding hot water and the other in freezing ice water, and then declares that the temperature is fine “on average.”
I believe that a better way to think about longevity risk and uncertainty is via actuarial probability tables, such as that shown in Table 7.1.
Table 7.1. Probability of Survival at Age 65
Using a “moderate” mortality assumption.
Data Source: RP2000 Mortality table; IFID Centre calculations.

For example, Table 7.1 shows that if you are a 65-year-old male, using a moderate mortality assumption, there is a greater than 45% chance that you will live to the age of 85. That would obviously require 20 years of retirement income, if you decide to retire exactly at the age of 65. Likewise, the same 65-year-old male has a 24% chance of living to the age of 90, which necessitates 25 years of income. For females the numbers are higher. A female who is 65 years of age has roughly a 35% chance of living to 90. Compare this number to the 24% probability for a male, and you can see the relative impact and magnitude of female longevity. In other words, if you have a large group of 65-year-old males, then slightly less than a quarter of them will live to the age of 90. Of course, we can’t know in advance who will be included in that lucky quarter, so to be prudent they all plan for the possibility of 25 years of retirement income. The number increases significantly to 50%, if you consider the chances that at least one member of a male-female couple will survive to age 90.
Another way to think about longevity risk is by interpreting the risk in a more pessimistic manner. Indeed, according to the same actuarial tables, the probability that a 65-year-old male does not reach the age of 70 is approximately 8%. This mortality rate comes from subtracting the listed survival rate of 92.2% from the total of 100%. Yet, as you can see, there is the same 8% chance that he reaches age 95. One group gets 30 years while the other group doesn’t even get 5 years. They are of equal odds. This is longevity risk.
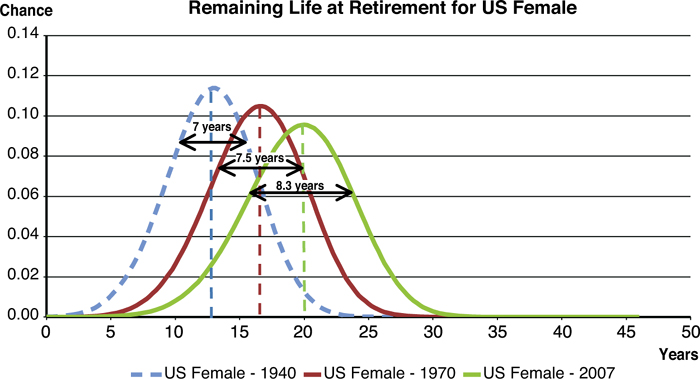
Figures 7.1 and 7.2 provide another perspective on longevity risk and lifetime uncertainty. Both graphs show the probability of living a certain number of years after retirement for females and males, respectively. These figures allow us to make some interesting observations. First, between 1940 and 2007, the average lifespan after retirement has steadily increased. This is evident by the entire curve shifting rightwards. For instance, in 1940, females, on average, remained alive approximately 13 years after retirement. In 2007, this average increased to 20 years.
Source: Human Mortality Database. University of California, Berkeley (USA), and Max Planck Institute for Demographic Research (Germany); calculated by Minjie Zhang, 2012
Figure 7.1. Another perspective on female longevity after retirement.

Source: Human Mortality Database. University of California, Berkeley (USA), and Max Planck Institute for Demographic Research (Germany); calculated by Minjie Zhang, 2012
Figure 7.2. Another perspective on male longevity after retirement.
Also, over time, the graphs are becoming wider. Mathematically, this means that the standard deviation of remaining life at retirement is increasing. For example, in 1940, the standard deviation was 7 years, while in 2007, it was 8.3 years. Thus it is becoming more uncertain how long you will live. It could be as few as 5 years or as many as 35.
What is the key takeaway? Longevity has increased over time, but so has its uncertainty. This makes planning for retirement more difficult than it was in past generations. How do you know if your nest egg will last long enough to sustain your retirement? How much should you withdraw each year for consumption? How can you shield against the uncertainty of your longevity? These topics will be addressed throughout the remainder of the book.
Now is a good time for me to reemphasize the fact that many possible mortality assumptions or actuarial tables exist. For example, the Social Security Administration uses very different tables for calculating benefits and projecting future deficits and liabilities. This is because it works with the population as a whole as opposed to a subset of possibly healthier and longer-lived pensioners. In the opposite direction, if you are ever interested in purchasing an immediate life or income annuity, a topic that I discuss in Chapter 9, “Annuities Are Personal Pensions,” the insurance company actuaries will use a completely different table. The annuity table assumes much higher survival odds when determining how long you are projected to live and, hence, how much you are to be paid for the rest of your life. This is another example of the effect of asymmetric information, which I discussed in Chapter 2, “Insurance Is a Hedge for Human Capital.” In fact, there are so many possible actuarial tables that I often joke that they are like snowflakes; no two are ever alike.
Do People Understand the Odds?
Factors that are likely to improve longevity are continuously being studied and, in addition to data that I have summarized in Chapter 2, some fascinating findings are emerging from demographers, biologists, and gerontologists. Improving longevity is a topic of ongoing and continuing research. According to a recent study by the U.S. Society of Actuaries (www.soa.org), twelve factors actually affect or influence retirement mortality. They are
• Gender
• Race and ethnicity
• Education
• Income
• Occupation
• Marital status
• Religion
• Health behaviors
• Smoking
• Alcohol consumption
• Obesity
In other words, the knowledge of any one of these factors can help predict or better estimate your retirement mortality rate, sometimes by a factor of 2-to-1.
As just one example of these factors, the Max Planck Institute in Germany has recently confirmed, using a large database of actual mortality experience, that although males in general don’t live as long as females, interestingly, married males tend to live longer than single males. But oddly enough marriage is not associated with greater longevity for females. For them, being widowed, single, or divorced is a factor associated with reduced mortality. The findings are summarized in Table 7.2 and are quite controversial, besides being somewhat amusing. Why is marriage “better” for males’ longevity compared to females’ longevity? Does this study apply broadly across different demographic groups? The research is still ongoing.
Table 7.2. What Reduces Your Retirement Mortality Rates (Beyond the Obvious)?
Source: Rasmus Hoffmann, “Do Socioeconomic Mortality Differences Decrease with Rising Age?”, Max Planck Institute for Demographic Research, 2005.

Along the same lines, Table 7.3 displays data showing that life expectancy at age 70 is related to one’s income level. Falling within the 80th versus the 20th income percentile can mean the difference of three years in life expectancy for a healthy male or female. The wealthy are healthier.
Table 7.3. Health and Wealth: Life Expectancy at Age 70
Source: Federal Reserve Bank of Chicago, WP 2005-13 (De Nardi, French, and Jones).

As I emphasized in Chapter 2 on the topic of life insurance, please do not confuse the statistical relationship between these factors and actual causality. We are not sure exactly what causes this relationship and whether other factors are at play that impact the link between wealth and longevity, or marital status and longevity. All we can say for certain is that mortality rates are lower among these groups of people. Once again, from a practical perspective, if you are a member of the groups identified as having more favorable mortality experience, you likely should plan for a much longer retirement compared to the average person in the population.
Even status has been linked with an increased life expectancy. Table 7.4 displays the results of a study that examined the impact on life expectancy of being nominated for a particular award versus actually winning it. The difference can mean as much as an extra four years of life.
Table 7.4. Status of a Long Life
Source: D. Redelmeier and S.M. Singh, Annals of Internal Medicine, 134(10):955; M.D. Rablen and A.J. Oswald, Warwick Economic Research Papers, January 2007.

Just as important as the wide variation in longevity estimates depending on the group in question, for any given group, predicting what these numbers will look like 10 or 20 years from now is virtually impossible. Will some pharmaceutical company discover a drug that eliminates most cancers or heart disease, which will then add five to ten years of life? Or will the epidemic of adult obesity continue to erode public health and thus reduce longevity probabilities? Once again the experts can’t answer these questions with any degree of accuracy; this is yet another aspect of what is called aggregate longevity risk.
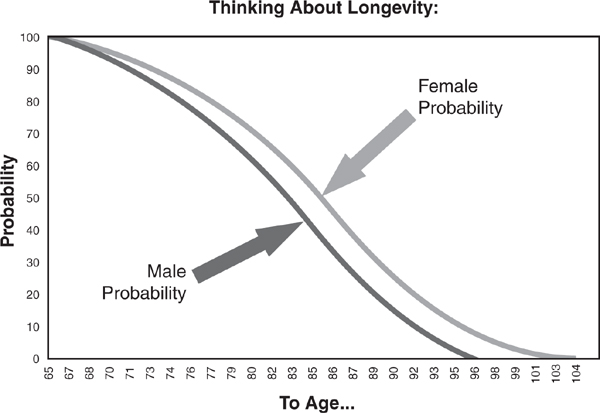
What is the take-away point from all of these numbers? The most important one is to realize that you are chasing your life expectancy as you age. Table 7.5 summarizes this point once again using U.S. Social Security tables. Don’t confuse or misunderstand the numbers you see mentioned and quoted by the media. The next point is that you need to recognize and understand the concept of longevity risk. For those who prefer pictures to numbers, Figure 7.3 provides a graphical illustration of this risk. Although a 60% to 80% chance exists that you will spend 10 to 20 years in retirement, a 10% to 20% chance exists that you might get to the high 90s or perhaps even triple digits. It’s a matter of probabilities. This is a risk. Recall that the opposite risk is premature death that must be hedged using some sort of insurance or risk management strategy.
Table 7.5. Chasing Your Life Expectancy
Source: Life Tables for the United States Social Security Area 1900–2100 Actuarial Study No. 116.

Source: RP2000, SoA; IFID Centre calculations.
Figure 7.3. Aging down a curved slope.
Again, when you are young you should take a “long” position in mortality risk. This means that you should be buying or acquiring insurance investments that pay off if and when your mortality rate jumps up unexpectedly. When you are old, you should reverse the hedge and take a “short” position in mortality. If there is a downward shock and your mortality rate declines, and you, therefore, live longer, you face the risk that your nest egg will not suffice or provide enough income to last for the rest of your life. Note that going short mortality in your old age is the equivalent of buying or purchasing some sort of longevity insurance, which is a topic I return to in Chapter 9.
The uncertainty of how long you will live, along with rising life expectancy rates, makes retirement planning increasingly difficult. One way of shielding yourself against financial ruin requires converting as much of your human capital as possible into financial capital. An example of this principle is as follows. If you are a healthy 65-year-old married male with parents who both lived beyond the age of 75, then as mentioned previously your retirement mortality rate is low. You are likely to live for a long time after you retire, and thus working for a few extra years to convert your remaining human capital into financial capital might be prudent.
Remember, after you retire, your human capital has very little value (if any). Your personal balance sheet predominantly consists of financial capital that must sustain you through retirement. Stockpiling as much financial capital as possible will allow you to better navigate the perils of longevity.
You also need a longevity risk management strategy. You need to develop a plan for the possibility of 30 to 40 years of retirement. As you can see from Table 7.6, more than 72,000 Americans above the age of 100 are alive today. The U.S. Census Bureau projects that by the year 2050 there will be more than 600,000 centenarians alive. Are you one of them? Will you be one of them?
Source: U.S. Census Bureau, 2010.

People often assume that during economic prosperity we live longer, whereas during recessions we die younger. You might be surprised to find out that the opposite is true. A study done by the University of North Carolina shows that for every 1% increase in the U.S. unemployment rate, mortality is reduced by 0.5%. Another study done by the University of Michigan shows that almost every recession in the twentieth century has preceded a spike in life expectancy. For instance, average life expectancy in the U.S. jumped by more than six years after the Great Depression in the 1930s.
Why is this the case? One reason is that during strong economic growth, employees are pressured to work faster, stay at work for longer hours, and are subjected to more stress. Stress is often accompanied by unhealthy practices such as smoking, sleeping less, drinking alcohol, or eating fast food. During a recession, the opposite is the case. People cut back on bad habits such as smoking and drinking because of their costs. The unemployed have more time and can exercise and sleep.
Another study, recently published by the Center for Retirement Research at Boston College, proposes another reason for increased longevity. The study shows that as the economy prospers, it becomes easier for low-skilled and low-paid health workers to find better jobs outside of nursing homes. Consequently, labor shortages occur at retirement homes during a booming economy, driving down the quality of care and life expectancy for seniors. However, during a recession, a much larger supply of labor exists, allowing staffing levels to reach desired levels and raising senior longevity.
Given the severity of the most recent financial crisis, it is no surprise that data has already been released pointing to higher life expectancy rates. According to preliminary data from the Centers for Disease Control and Prevention, life expectancy has increased by 0.8 years between 2007 and 2010. Although this might seem “good,” it can also be viewed in a more morbid manner. With higher life expectancy, many retirees and soon-to-be retirees are going to find their nest eggs too small to sustain their unexpectedly longer retirement. Although the overall effect of these economic factors on mortality and longevity might be relatively small in the big picture—especially when considering your personal health factors, genetics, and so on—it is worth noting that longevity risk has increased in the aftermath of the Great Recession. This will be the focus of the next chapter as I strive to explain the sustainability of retirement plans.
Summary
• You chase your life expectancy as you age. The average life expectancy numbers of 77 for males and 80 for females you might see in the newspapers apply at birth only. Healthier, wealthier, and more educated individuals tend to have lower mortality rates and better longevity.
• When you reach your retirement years, in good health and wealth, there is a high probability you will reach the advanced 90s. There is a nontrivial chance you will reach triple digits, and the odds are better for females.
• Our inability to precisely know how long we are going to live and spend in retirement falls under the label of “longevity risk.” As the evidence I present in Chapter 1, “You, Inc.,” regarding pension plans illustrates, this risk is one that companies are running away from in droves.
• Personal longevity is a risk-management issue. With very little human capital on your personal balance sheet at retirement, you must have a strategy in place to preserve your financial capital over the course of your retirement.
Endnotes
A great book that addresses the entire topic of longevity projections is the book by Olshansky and Carnes (2001). Alternatively, you might want to spend some time browsing the Society of Actuaries website, www.soa.org, where you can find many helpful and interesting articles on the topic of mortality and longevity estimates. The Centre for Retirement Research at Boston College study by Stevens, Miller, Page, and Filipski (2012) provides further details about why life expectancy might go up during recessions.