
5. Personal Inflation and the Retirement Cost of Living
“...Inflation is much lower than it has been in the past due to the financial crises and the Great Recession, so I don’t have to worry about this too much....”
—Myth #5
Growing up in Latin America during the 1980s, I quickly learned how to adapt to the impact of inflation in daily life. With annual inflation rates reaching over triple digits, even young children knew to never expect the same price twice. Cash wasn’t allowed to sit idle and interest rates on bank deposits were designed to outpace inflation. We knew that salaries were linked to the U.S. dollar and pension income was stated in unidades reales, which is effectively a pseudo-currency consisting of a basket of consumable goods. Yes, complicated, but a fact of life.
Then, as I moved back to a monetarily stable North American environment, the debilitating power of inflation moved to my mental back burner. It toppled down my list of risks and worries. After all, the consumer price index (CPI) in the U.S. has increased by an average compound rate of only 2.92% per annum over the last quarter century of available data. Indeed, 30 years ago I was just starting high school and 2.92% was considered a decent weekly rate of inflation in many parts of the world. So clearly, the U.S. has been quite fortunate and blessed with low inflation rates. Figure 5.1 lists the somewhat varied, yet relatively low average rates of inflation for recent decades. One can easily get lulled into a false sense of security that inflation is just not an issue anymore. The Federal Reserve’s main policy mandate is to keep prices stable, and even a whiff of unexpected pressure sends them into a tightening tizzy.
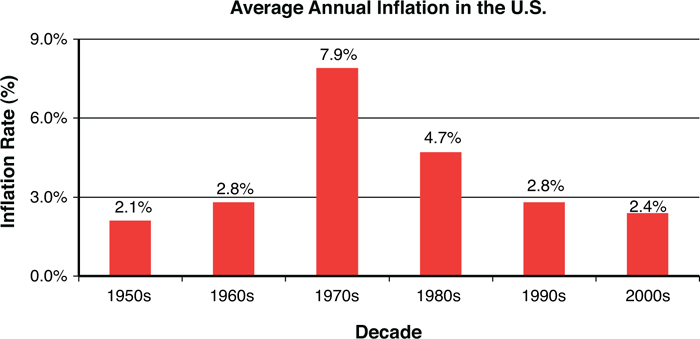
Data Source: CPI-U index, Bureau of Labor Statistics; IFID Centre calculations.
Figure 5.1. Average annual inflation in the U.S.
In this chapter, I take a much closer and more careful look at inflation and show you how it actually varies depending on your age and how, exactly, it is impacted by the way you spend your money. Oddly enough, you create your own inflation, and I’ll explain what that means. When you are young, earning a salary and, therefore, in the process of converting human capital into financial capital, your equity-based investments tend to keep up with inflation. In all likelihood wages grow at a positive real (after inflation) rate over time, so that inflation is just not that much of a threat in your working years. If inflation picks up, you will likely demand a raise or bonus from your employer to keep up with the cost of living. Inflation is not high on the list of financial enemies during your working years.
However, in the area of retirement income planning, things are very different. I believe that the relatively low inflation rates Americans have experienced in the last quarter century might actually be just as dangerous as the hyperinflation rates I grew up with in Latin America. This is because low numbers can be easily ignored. Yet, over long horizons they can be just as deadly, especially if you are not compensated for this risk and don’t know your own inflation rate. Once again, one of the main financial risks you face as you age is your unknown and age-specific personal inflation rate. It is at retirement that management of inflation risk is especially important because you tend to have the most financial capital at stake and might no longer have your human capital to mine.
Back to Basics: Inflation’s Impact
Table 5.1 illustrates the impact of relatively benign inflation rates over long periods of time. Here is how to read this table: Imagine you are getting a $1,000 pension income check every single month of your retirement years, but that this check is not adjusted for inflation. What this means is that your nominal income stays at $1,000, but its real purchasing power declines steadily with time. As you age, the same check buys you less. The table tells exactly how much $1,000 will buy you in today’s dollars, depending on the value of inflation going forward.
Table 5.1. Inflation: What Does a $1,000 Payment Really Buy You?
Source: Moshe Milevsky and the IFID Centre, 2012.

Notice that increasing the inflation rate from 2% to 4% per year can erode the purchasing power of $1,000 by almost 40%, from $610 to $375, at the 25-year horizon. I picked 25 years because it is the median remaining lifespan for a newly retired couple, and a 2% to 4% inflation rate is arguably a reasonable aggregate range. For instance, since 1990 inflation levels have only fallen outside of the 2% to 4% range five times, and never by a large amount.
Actually, the inflation story gets even more interesting. It seems the U.S. Department of Labor (DoL), via its Bureau of Labor Statistics (BLS), has created an entirely new experimental inflation index for the elderly. It called this index the CPI-E and it is meant to better capture the inflation rate that is unique for Americans age 62 and older, the group that comprises roughly 17 percent of the U.S. population.
Why would inflation be different for the elderly? In fact, how does inflation get measured, at all? Let me back up a bit. The answer to these questions comes down to our spending habits. Boiled down to inflation’s essence, statisticians measure it partially based on how people spend their money.
Basically, statisticians measure price changes for hundreds of categories and items each month. Some of these items increase in price while others decline or stay the same. The weights placed on the different categories and items reflect average spending habits. If the typical American spends three times more money on banana products than avocado products, then the index weight placed on bananas is three times as high as the index weight placed on avocados. This is regardless of whether you personally are allergic to bananas and love avocados.
The consumer price index for wage earners and clerical workers is labeled and abbreviated CPI-W. The letter W is meant to remind us that this is the inflation rate experienced by wage earners. This index reflects the spending habits of this group, which is about 32% of the U.S. population. As of the end of 2009, working Americans spend about four times the amount on food and beverages than on apparel, and they spend approximately seven times more on housing-related expenditures than they do on recreation, and so on. These weights do change over time, but the relative values are fairly stable. The components in Table 5.2 provide the weights on the various categories that make up the CPI-W at the end of 2009, and they, of course, must add up to 1. Notice that each subcategory has its own inflation rate. The higher the group weighting or relative importance, the more a price change for the group will impact the overall inflation rate.
Table 5.2. What’s Your Inflation Rate?
Data Source: Bureau of Labor Statistics data to end of 2009.

As you can see from Table 5.2, the relative importance placed on the various subcomponents differs for the regular (CPI-W) versus the new and experimental elderly (CPI-E) version. For example, in the CPI-E, Medical Care has more than twice the weight as it has in the CPI-W. The reason for this is because the elderly spend a greater fraction of their income on medical care. At the opposite end is the weighting that is placed on Food and Beverage. Its relative importance in the elderly inflation rate is 0.12 compared to 0.16 for the working rate. Table 5.3 shows the change in median expenditure over the entire U.S. population on these two items as we age. You can see that while in our forties and fifties, we spend two times more on food and beverage than on medical care. By the time we get into our late seventies, our food and beverage expenditure is only a fraction of our medical care expenses.
Table 5.3. Consumer Expenditure Survey: U.S. Department of Labor (BLS) 2010
Source: Consumer Expenditures Survey 2010, U.S. Department of Labor, Bureau of Labor Statistics.

I often see surprised reactions when people learn that a private room in a nursing home can cost as much as $435 per day, depending on the geographical location. Table 5.4 displays a sample average for this expense, which partially contributes to the rise in medical care costs that are seen in retirement. And while the topic of long-term care insurance—as well as general estate planning, Medicare, Medicaid, and other retirement risks—is well beyond the scope of this book, suffice it to say that one should give serious considerations to these issues. Health-related expenditures will become a much larger component of your spending and financial constraints as you age, which, among other things, means that inflation for medical care will have a greater impact on your personal inflation rate.
Table 5.4. Nursing Home Cost, Private Room
Data Source: “The MetLife Market Survey of Nursing Home & Assisted Living Costs,” October 2010; IFID Centre calculations.

Here is the bottom line regarding retiree inflation as it pertains to retirement income planning. From early 1982 until late December 2006, the compound annual inflation rate in the U.S. as measured by the regular inflation rate for wage earners was 2.96% per annum. During the exact same period, the inflation rate for the elderly was 3.30%, which is an average of almost 35 basis points per annum (or 0.35%) more over the last 25 years. This adds up to a difference of almost 15% over the 25-year period.
Now, my main point here is not that you should add another percentage point to your retirement income inflation projections. I don’t think the CPI-E is relevant to you either, because it is also an average over a very large and diverse group of people. Rather, my main point is the fact that the Department of Labor bothers to compute an inflation rate for retirees should remind us that inflation is personal and unique. After all, if there is a CPI-E, why not a CPI-ME or a CPI-YOU? Depending on where you live, how you spend your money, how old you are, and even your gender, inflation is different.
Here is yet another example. The average inflation rate for the last ten years in Atlanta was 1.7%, compared to an average of 2.8% in San Diego. Likewise, a 2007 research report by Merrill Lynch quantifies the extent to which inflation is gender-based. According to their chief economist, the inflation rate for females was about 3.6% and for males it was closer to 0.2%. Why? Their spending habits are different.
We all have slightly different and personal inflation rates based on spending habits. As the owner of You, Inc., your task is to make sure that your newly invested financial capital keeps up with your very personal inflation rate, not some macro-economic average. This is the true liability benchmark.
If you think about it for a moment, all else being equal, your human capital does a better job of keeping up with inflation compared to your financial capital. After all, salary and wages tend to be linked to inflation, albeit indirectly. However, after you are retired and have spent or converted most of your human capital into financial capital, inflation becomes a greater threat.
For those who are not yet convinced, Figure 5.2 provides yet another way to think about this and is a graphical illustration of the numbers in Table 5.2. As you can see, the elderly spend differently.
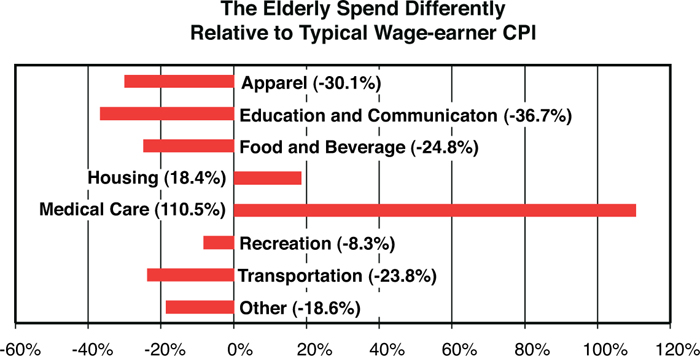
Data Source: Bureau of Labor Statistics; IFID Centre calculations.
Figure 5.2. Inflation is not an atmospheric phenomenon.
What is the practical side of all of this? First, sit down and conduct a very careful analysis of your expenditures and spending allocations. In fact, perhaps you might want to start by creating your rough inflation rate based on how you actually spend your money as well as where you live. Use the numbers and inflation rates in Table 5.2 to create a personal inflation rate, or do some extra homework and dig up the rate based on where you live.
Just as a very hypothetical example, imagine that your retirement spending consists of only two consumption goods: housing and medical care. You consume or spend money on these two categories in equal amounts. In this case your personal inflation over the last ten years would have been cumulative (34% + 48%)/2 = 41% and the annualized inflation rate would have been roughly (1.41)(1/10) – 1 = 3.5% per year.
Note, once again, that the BLS doesn’t calculate inflation by keeping these weights fixed for ten years—and it has a unique way of measuring house inflation—but you hopefully appreciate my basic point. Anyone can construct a rough personalized inflation rate that better reflects his expenditures.
Another important takeaway point is as follows: Because locating fixed-income investments that perfectly hedge your financial capital against a particular inflation rate is exceedingly difficult, the next best thing is to locate investments that have strong correlations with your liabilities.
For example, I would tilt my equity-based investment portfolio toward sectors and companies that stand to benefit from an (unpredictable) shock to my personal inflation rate. Companies in the pharmaceutical sector, biotechnology, health care, and even managers of nursing homes will all stand to benefit from further advances in longevity. If Pfizer, Merck, Wyeth, GlaxoSmithKline, or Bayer discover and develop a drug that extends my life by a handful of years, then my cost of longevity will obviously increase. More importantly, these companies’ stock prices will likely increase above and beyond the underlying markets in which they trade. Investing in these companies will then hedge or even partially insure against the unexpected increase in retirement expenditures, which is yet another form of personal inflation.
One topic I have not addressed is whether the calculation methodology for CPI is a good measure of the economy’s overall inflation rate. Many financial commentators believe that, irrespective of the personal nature of inflation, the true level of inflation in the economy is actually much higher, and that the reported numbers are lower than they should be. This is because the statistical methodology is biased by artificial values for many of the consumer prices that are hard to measure. Either way the end result is the same. It’s time to pay more attention to this.
Finally, in today’s post-economic-crisis environment, being cognizant of inflation’s impact on the financial capital of retirees is more important than ever. In fact, as of early 2012, real rates of return have been negative for the previous few years and pose a threat to those with very low levels of human capital.
Why are real rates of return negative? First, to combat the financial crisis, the Federal Reserve (“the Fed”) dropped short-term nominal interest rates in December 2008 to an all-time low of 25 basis points (0.25%). The rationale behind these low rates was to help households and businesses finance new spending, inject liquidity into the money markets, and keep the prices of homes stable. Rates have not risen since the end of 2008 and the Fed projects they will remain this low through at least late 2014. Second, inflation has also been relatively high. For instance, in 2011 inflation was more than 3%.
A fundamental relationship exists between real (inflation-adjusted) and nominal rates. The real rate of return is approximately the nominal rate minus inflation. Given the Fed’s low interest rate policy, the nominal yields on T-Bills, CDs, and bank accounts are extremely low. In fact, these rates are much lower than the 3% inflation rate. Using the previously mentioned fundamental equation, you can see that real returns are indeed negative because inflation exceeds the nominal rate.
What does this all mean? Retirees now have very little protection against inflation. Previously, they could get away with investing in money-market instruments such as T-Bills that would earn a similar rate of return to inflation. Now, they are unable to beat inflation, and the real value of their cash holdings is slowly eroding due to inflation. An even greater concern is that retirees often have higher inflation rates than wage-earners. This augments the losses in purchasing-power experienced by retirees.
Retirees are most affected by this because their human capital is non-existent and is unable to shield losses to their personal balance sheet, which is entirely made of financial capital. Conversely, workers who have considerable human capital are not as affected because the bulk of their net worth rises in tandem with inflation.
Summary
• True inflation is personal and not an atmospheric phenomenon. Learn to distinguish between your personal cost of living and the population inflation rate.
• The Consumer Price Index, which is the widely cited measure of inflation, is calculated as an average of an average and is meant to give a picture of the economy as a whole and not your personal experiences.
• As you age your inflation rate is likely higher, as measured by the newly created CPI-E for the elderly. The CPI-E has often exceeded the CPI since it has been calculated. Likely, this is because the elderly spend their money on goods and services that tend to appreciate at a higher rate over time.
• Make sure your investments and your retirement income keep up with your personal inflation rate. Although you might need less money during retirement—and that is debatable—I would assume that your required expenses and your personal inflation will increase by 5% to 8% per year.
• Your human capital is generally well-protected against inflation, because it tends to rise in tandem with the CPI. Conversely, financial capital is more sensitive to the CPI and must earn a return greater than the rate of inflation to preserve its value.
Endnotes
See the book by Eisenberg (2006) and the collection of articles by Evensky and Katz (2006) for additional information on the “cost of living” for retirees. Visit the Bureau of Labor Statistics (BLS) website, www.bls.gov, to learn more about the components of the Consumer Price Index (CPI) as well as the CPI-E for the elderly. Alternatively, spend some time reading the recent speeches and testimony of Professor Ben Bernanke, who is the chairman of the U.S. Federal Reserve and one of the world’s leading scholars on the topic.