3. Diversification over Space and Time
“...It is a good idea to allocate most of my 401(k) account to my own company’s stock, since I can keep an eye on things here and the stock price has been doing really well, lately....”
—Myth #3
The famous economist John Maynard Keynes was once quoted as saying that he did not believe in diversifying his investments. He felt that the best investment strategy was to buy a few good stocks, and just hold on to them. In stark contrast, Peter Lynch, the legendary Fidelity Investments guru, is rumored at one point to have owned more than 1,000 different stocks as part of Fidelity’s mutual fund portfolio.
Keynes’s comments aside (how do you find those few good stocks?), by now it is accepted wisdom that diversifying your investments makes good strategic business sense. The Nobel committee has awarded quite a number of prizes to economists who developed and furthered these ideas about diversification during the last 30 years. Yet, the idea, “Don’t put all your eggs in one basket,” was a philosophy preached long before the emergence of modern portfolio theory. In fact, the Babylonian Talmud, compiled more than 2,000 years ago, recommends that a person split his wealth into three parts. One-third should be placed in real estate, one-third in money, and the remaining third in business assets, which I liberally interpret to include equities. Overall, not bad investment advice, especially if you could have followed it for the last 2,000 years.
Why does diversification work? After all, wouldn’t you think that the more stocks you own, the more likely you are to catch a loser? Or at least that you’re as likely to catch a loser as you are to bag a winner? Is it possible to be overdiversified and own too many stocks? And if it is possible, wouldn’t these same general issues apply to mutual funds as well? Thousands of mutual funds are available in North America today. Does any one mutual fund have enough stocks in it to be labeled “diversified?” How many mutual funds should you own to be properly diversified? Given the emerging global economy, how much international exposure should your investments have? And finally, now that we have moved beyond the traditional view of the personal balance sheet in Chapter 2, “Insurance Is a Hedge for Human Capital,” what adjustments must we make to the diversification concept?
To answer these and related questions on the benefits of diversification, in this chapter I want to focus on the core reasons for diversifying, and I want to do that by examining the odds the investments you choose go up, go down, or go nowhere. After you understand the exact reasons for diversifying while you are saving for retirement, you can then transition into what exactly happens after you arrive at retirement. My main argument here is that when you are accumulating wealth (but not withdrawing any funds or money from the portfolio), the most important concept you must understand is diversification.
Why Does Diversification Work?
One thing I should make clear about the whole subject of diversification is that nothing is inherently magical about splitting your 401(k) or IRA money into many small parts and putting each part into a different investment vehicle. The benefit is not derived from the process of splitting the money, or placing it into different mutual funds. Rather, it’s the simultaneous movement of these investments that’s important. In other words, how do they behave, move, and grow over time? Do they move in lockstep? If one zigs, does the other zag? Obviously, these are critically important questions, because if the various investments all move in the same direction at the same time, up or down, you’re not likely to benefit very much from diversifying. If they’re all moving up, you might as well pick one good fund, or stock for that matter, and stick with it. And if they’re all moving down, diversification clearly hasn’t helped.
The secret to successful diversification is an old axiom: Opposites attract. In investment terms, that means you want to diversify into sectors of the global and local economy that do not share the same up and down influences. For example, if you invest in both the financial services sector and the consumer products sector, you hope that when one is faltering, the other is not. Or if you further diversify into oil and gas and other resource industries, then ideally, if the first two sectors suffer, the third will prosper. The way to quantify this parallel movement is by using something statisticians label a correlation coefficient, which can range from negative 100% up to positive 100%. The language can be a bit technical, but the concept is simple, so let me explain how the correlation coefficient works, and why it is so fundamental to the investment process and diversification issues.
A Diversification Example
To make these concepts a bit more concrete, here’s an example that illustrates the effect of diversification and the trade-off involved. Consider three hypothetical mutual funds where one fund exactly tracks or mirrors the performance of the stock market as proxied by the S&P 500 total return index, one fund tracks a U.S. diversified Bond Index, and the third fund invests entirely in one-year Treasury Bills (T-Bills). Figure 3.1 graphs the value of an initial $1,000 invested and held in each of the three funds from January 2007 to December 2011.
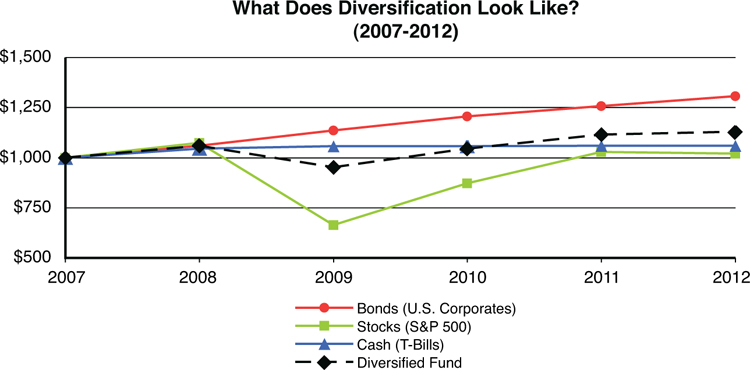
Note: Diversified fund consists of an equal allocation among the three asset classes.
Source: IFID Centre calculations.
Figure 3.1. Predicting the future is very hard.
The initial $1,000 invested in the S&P 500 Index fund in January 2007 is worth $1,073 in December 2007. Similarly the initial $1,000 investments in the U.S. Aggregate Bond Index fund and T-Bills in January 2007 are worth $1,059 and $1,044, respectively, in December 2007.
Although 2007 brought a favorable return of 7.31% for the S&P 500, it was also followed by the financial crisis in 2008, where almost 40% of the S&P 500’s value was wiped out. Although historically the return from stocks has followed a positive trend in the long-term, by the end of this volatile five-year period, the fund tracking the S&P 500 lost the race and ended with the lowest balance. With perfect foresight, one would, of course, select the U.S. Bond Index fund to benefit from the higher returns realized over the period.
Now, assume you didn’t have a crystal ball and that you decided to invest $1,000 in a portfolio consisting of equal weights of these three distinct asset classes; in other words, you diversified your portfolio by investing $333.33 in each. The growth of this investment is represented by the dashed line in Figure 3.1. Now, the $1,000 you invested in January 2007 is worth $1,128 in December 2011. As you can readily see, the final balance of this diversified fund is lower than the balance you would have earned if you had invested in the Bond Index alone. But it is also higher than either the S&P 500 Index fund or the T-Bill fund. Now here is my main point: Notice the smoother, less jagged path that is followed by the diversified investment. Such is the effect of diversification. With hindsight you might regret not choosing the best-performing asset; but while you forego the positive extremes and don’t fully realize the returns on high-performing assets, you also avoid the disappointment and volatility of negative extremes.
So regardless of whether you are looking at 3 or 300 stocks or funds, there’s an implicit trade-off when you diversify. Still, there is universal agreement that diversification is an essential investment strategy. To gain a deeper understanding of why and how the benefits of diversification outweigh the potential gains of investing in a single outstanding stock, you have to consider the risk dimension.
Decomposing Risk: Systematic Versus Non-Systematic Risk
One must recognize that the risk associated with a stock is really a combination of two types of very distinct risks. One is called general market risk, and the other is called individual security risk. Let me briefly explain what I mean by these types of risk, and why keeping track of both is important.
General market risk, or systematic risk, refers to risk associated with changes to stock prices that have nothing to do with an individual company, but are instead due to changes in the overall economy. For example, if the U.S. Federal Reserve decides to raise interest rates unexpectedly, it will affect the market as a whole, probably in a negative manner. In other words, there will be more sellers than buyers and stock prices will fall. Similarly, if the economy were to slip into a recession, it would affect the entire market, not just a handful of stocks.
A stock whose price changes closely follow the price changes of the market, as proxied by a stock index, contains more general market risk than a stock whose changes are not closely related to changes in the general stock market.
Aside from general market risk, a company as represented by its stock price also faces risks unrelated to general economic or market risk. Individual security risk, or non-systematic risk, refers to risk associated with changes in the stock price that are due to events associated with the firm itself, independent of changes in the overall economy or the market.
Numerous potential sources of individual security or firm-specific risk exist. Sales might decline or rise sharply. The company might fall victim to a fire, sabotage, class-action lawsuit, or accounting fraud. Alternatively, the company might acquire rights to a proprietary patent or might have just hired a star sales manager or new CEO. All the preceding, as well as their less dramatic parallels in day-to-day operations, can yield stock price changes and volatility entirely independent of the broader market.
Back to my main point here: An essential difference exists between market risk and individual security risk. Market risk cannot be erased by diversification; unique firm-specific risk can. That’s because the source of market risk changes in the overall economy. Although a single firm might face a catastrophic event on a single day, it is far less likely that a number of firms will face similar catastrophes on the same day. Hence, the importance of unique risk diminishes as the number of firms in the portfolio increases.
A fundamental axiom of modern financial economic theory is that investors are only rewarded for risks that cannot be diversified away. Individual security risk can be virtually eliminated by holding other stocks in the same industry or sector; general market risk cannot be eliminated by holding more stocks of the same or any industry or sector.
Here’s an analogy a student of mine once used to explain this back to me after one of my classes on investment theory. It might sound odd at first, but it makes the point.
One of the more dangerous competitions athletes can participate in is NASCAR auto racing. Clearly, a NASCAR driver with an opportunity to participate in one of the frequent races will evaluate whether the danger associated with racing around a track at 200 miles an hour is offset by the many benefits, including the potential for lucrative endorsements if he or she wins one of the races. Indeed, one can treat the expected value of these benefits as the reward for taking on the risk associated with participating in the NASCAR race. As I said many times, risk and reward are linked.
Now, suppose that a driver has agreed to participate in the Daytona 500, for example, but for whatever reason, has also decided to forgo all the protective gear typically used by drivers, such as protective helmets and clothing manufactured from inflammable materials. Clearly, this driver would be increasing his or her personal risk greatly (and might be prohibited from doing so by the official organizers). However, is it sensible to claim that these drivers receive extra compensation because of these additional risks? Would a NASCAR driver with no helmet get a better endorsement deal?
The logical answer is no. From a strictly economic point of view, drivers cannot avoid certain risks associated with auto racing. Hence, these risks should be compensated. But if a risk can be avoided, they are not compensated for acting carelessly. Because the proper protection can eliminate or reduce avoidable risk, there is no benefit to assuming such risk.
The takeaway is that diversification of your 401(k) plan has two attributes:
• If you diversify across different funds and companies, you will smooth out the fluctuations and volatility.
• If you don’t, you will not be compensated for this extra risk. The fund units and investments will just bounce around, with little to show for it in the long run.
The Importance of International Investing
I have focused so far on domestic stock diversification. In reality, of course, an investor can choose to diversify not only across individual stocks or sectors, but also across different types of investments and more importantly across geographical regions.
Unique risks are associated with individual country markets. Most investors trade in stocks of domestic firms in a particular market. Therefore, if that market were to experience a political or economic catastrophe, the domestic firms traded on the market would all be affected. But these events might have less of an effect on companies and stocks in other countries.
Through international diversification, an investor can avoid the risks associated with a single country. Note, however, that domestic events in some countries can impact international stocks as well. For example, insulating against unique risk associated with powerful economies such as the United States or Japan is difficult due to the impact that events in these countries have on other countries in their region or in the world.
Similarly, other types of diversification might be useful as well. Diversifying across different investment asset classes or categories is important. For example, the fixed income asset class is a category that includes savings bonds, government bonds, and other “safe” products that pay coupons and interest. Another asset class is real estate, which can help reduce inflation risk. The value of fixed-income investments decreases as inflation increases. Conversely, the value of real estate increases as inflation increases. A portfolio containing all of these asset classes will be insulated against shocks or surprises to inflation risk.
Diversifying across investments with different levels of liquidity might be useful as well. Liquidity refers to the speed and cost with which investors are able to liquidate all or some of their portfolio, such as when faced with a medical emergency or a family business on the verge of bankruptcy. For example, real estate is commonly perceived as an illiquid investment, due to the time and various fees (agent, lawyer, tax) associated with a purchase or sale. Conversely, money market investments can be quickly and cheaply liquidated.
Consider, for example, two broad stock market indices—for example, in the U.S. and Europe. If you think about it for a moment, you’ll see that three broad possibilities exist for how these two markets might behave vis-à-vis one another or move at any point in time. Statisticians call these a positive correlation, a negative correlation, and no correlation.
The first possibility, the positive correlation, simply means or implies that both markets move together in roughly the same direction. When European stock markets are having a relatively strong week, month, or year, then U.S. markets are doing the same. And when European markets are experiencing difficult times, so are the U.S. markets. They share the same ups and the same downs. The stronger (or closer) this parallel is, the higher the correlation coefficient. In fact, if the two markets moved in perfect lockstep, a statistician would say that they have a correlation coefficient of 100%.
On the other side is negative correlation. This means, for example, that when one market does better than average, the other performs worse than average. When one market has a relatively good week, month, or year, the other has a relatively bad week, month, or year. In the extreme, a correlation coefficient of –100% implies that the markets move in exactly opposite relative directions.
Of course, in the new global economy, finding such negatively correlated markets is tough. Indeed, more typically, a rising tide lifts all ships (and vice versa). But if you look hard enough, you should be able to find some market segments that are countercyclical to others. This is why diversifying your 401(k) and IRA investments internationally as well as across asset classes is so important.
Now, just to get a clearer sense of how correlation operates, here is an example. Over the last 20 years, the correlation between U.S. equity returns and European equity returns has been roughly 60%. This means that when the European stock market is having a better-than-average month, the U.S. market is also having a better-than-average month.
Reviewing the last two decades, statisticians have measured the strength of this positive parallel movement on a scale of 0 to 100 and come up with the number 60. This is definitely a positive correlation coefficient, but not necessarily a very strong correlation. Still, it makes a certain amount of intuitive sense that global capital markets should move at least partially in tandem.
So why am I so preoccupied with correlations? Who cares if or how different markets move together? Well, as I suggested earlier, correlation is the key and the secret to diversification’s success—and why international investing is so important.
Going Global with Exchange-Traded Funds
One excellent way to achieve international diversification is to invest your money into an exchange-traded fund (ETF). For those not familiar with this investment class, ETFs are traded on stock exchanges and track entire indices of investments. For instance, the largest U.S. ETF, SPDR S&P 500, tracks the performance of the S&P 500. ETFs also charge a relatively low fee for the management of the fund, typically referred to as an expense ratio.
Why would an investor purchase an ETF over individual stocks? Well, ETFs offer a variety of advantages such as lower volatility, reduced risk, and cost-effective asset allocation. Because ETFs track broad indices composed of many securities, much of the previously discussed non-systematic risk is diversified away. Thus, ETFs are only exposed to market risk, which the investor is compensated for. Additionally, ETFs are a cost-effective way to diversify because you pay a small fee (on average less than 0.5%) to essentially hold thousands of securities captured by the index that the ETF tracks. Holding a portfolio of 1,000 individual stocks would cost much more because of the associated commissions for stock trading.
Index mutual funds are similar in nature to ETFs—they track a benchmark, they offer an efficient method of diversification, and fees are generally low. However, the two do differ in some key ways:
• ETFs trade throughout the day, much like stocks, allowing investors to execute trades immediately rather than waiting until the end of the day, as is the case with index mutual funds.
• ETFs are generally more tax efficient, because investors can sell ETFs to one another, rather than having to undergo a redemption process of liquidating the underlying holdings.
• ETFs do not reinvest dividends automatically. Instead the money sits in the investor’s brokerage account, forcing ETF investors to reinvest this money on their own and leading to additional transaction costs. Most index mutual funds automatically reinvest dividends.
• Also, because ETFs track an underlying index, they do not regularly incur trading fees, analyst fees (to pay for active portfolio management), and commissions. This allows ETFs to generally charge lower management fees than index mutual funds.
But don’t get me wrong: Both (passive) ETFs and index funds are very good instruments to use at the core of your global investment portfolio—and the differences between them are much smaller than the differences between actively managed mutual funds.
So, now that you have a solid understanding of ETFs, let’s explore international diversification by looking at ETFs offered by one of the many available investment management companies called the Vanguard Group. Vanguard offers a variety of ETFs. Fair disclosure warning here—I own some of their funds. One of my favorites is the Vanguard Total World Stock ETF (symbol VT), which invests in 3,750 stocks, both U.S and foreign. The composition of this ETF (as of February, 2012) is as follows: 4.5% Canadian, 45.2% U.S., 36.1% European and Pacific Rim, and 14.2% emerging markets. Vanguard’s expense ratio on VT is 0.2%.
Between July 2, 2010 and February 7, 2012, VT earned an annual return (geometric) of 23.96% with a standard deviation of 23.60%. The standard deviation essentially represents the risk of the investment. (Generally, the higher the standard deviation of the investment, the more volatile it is.)
At first glance, this seems like a great return for investors while simultaneously providing them with international diversification, all at a low cost of 0.2%. Although this is obviously one way to invest in just a single instrument and then have global exposure to stocks all over the world, other ways exist to do so—and perhaps at a slightly lower cost as well.
In one interesting study I recently completed with Maxwell Serebryanny—a really bright student in our BBA program—we found that we could take pieces of the VT ETF and replace them with lower ETFs, all the while maintaining the same composition of international diversification. For instance, at the time of the study, the Vanguard ETF, VEA, tracked the European and Pacific Rim markets at an expense ratio of 0.12%. VWO tracked emerging markets at an expense ratio of 0.2%, VTI tracked the U.S. market at an expense ratio of 0.07%, and the iShares fund, ACWI, tracked the Canadian market at an expense ratio of 0.52%.
Though I don’t want to get too bogged down with the details, we basically took each of these ETFs and constructed a portfolio, keeping the same weighting as was found in the earlier mentioned VT ETFs. The results were illuminating. This replicated geographically weighted portfolio had returns of 25.43% (higher than VT), standard deviation of 23.50% (lower than VT), and a weighted average expense ratio of 0.13% (lower than VT). Essentially, we had constructed a portfolio with identical country weights as VT but with higher returns and lower risk.
What does this mean? Well, one-stop-shopping and convenience clearly has a price. You might be able to get your international stock “fix” with just one investment “pill,” but working a little bit harder—perhaps with the help of an advisor—and searching for a combination of products that does the same job for less sometimes pays off.
Interestingly, since this study was conducted and we shared some of the results with practitioners in the field, Vanguard has actually lowered the expenses on many of its ETFs and the aforementioned advantage might have been eliminated. However, the techniques and the thought process behind the previously discussed replication strategy still apply. It again leads to a key takeaway: Don’t become complacent in your search for diversification. Buying one ETF or fund would easily allow you to diversify internationally; however, it would not be at the lowest possible cost. Combining funds to get a lower fee, higher return, and less risk would be a better course of action.
Correlations: The Magic Behind Asset Allocation
Think of financial correlation this way. Suppose you are faced with two investment funds. You expect both to make you a few dollars. Moreover, there is a significant additional benefit: The two markets in which you might invest are not perfectly correlated. They do not move together in a parallel direction. Thus, you have a better chance to gain by holding both of them. Let me explain why. Assume that you split your money equally between the two investments. For various hypothetical correlation scenarios, Table 3.1 shows the probability that you will earn less than you would if you invested instead in a one-year certificate of deposit (CD) earning 5% (we can only dream of such a rate in today’s markets).
Table 3.1. Your Money Is Split Equally Across Two Investments: What Is the Probability of Earning Less Than a One-Year 5% Certificate of Deposit (CD)?
Expected Return=15%, Investment Volatility=30%; Probability Each Asset Earns <5% = 36.94%
Source: Moshe Milevsky and the IFID Centre, 2012.
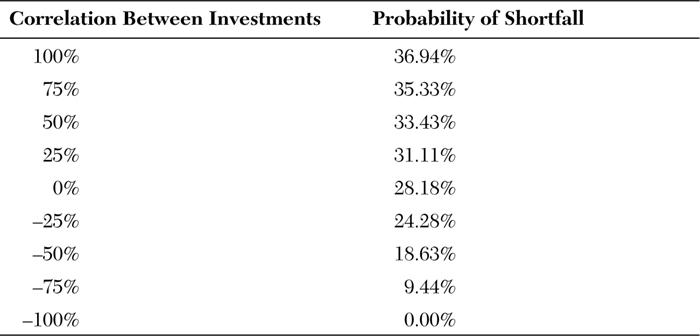
As you can see, in the most extreme case, when the correlation between the two investments is a perfect 100%, the probability of earning less than the CD is roughly 37%—very high, indeed. If you knew beforehand that there was almost a two-in-five chance that your investment would fare no better than what you could get from a very secure certificate of deposit at your neighborhood bank, you would think twice, wouldn’t you?
So it seems that with a perfect, 100% correlation, there are absolutely no benefits to diversification. If you split your money into two baskets that are in exactly the same place (two markets that are perfectly correlated), you have basically kept your eggs in the same basket. By analogy, then, if you diversify into perfectly correlated investments, the odds of earning less than a standard 5% deposit are the same as if you did not diversify.
At the other extreme is the correlation coefficient of –100%. In this case, if you split your money between two investments, the odds of earning less than a 5% CD are reduced to a perfect zero. In other words, you will never do worse than 5%. You have basically taken two risky investments, put them together in your investment portfolio, and created a situation in which you will never lose money. Not bad at all.
Wait a minute, you might be saying. What’s the catch? How can I guarantee that you won’t lose money?
Well, of course, I can’t guarantee that. Remember, this is purely a hypothetical example in which the correlation coefficient is artificially set to –100%. In the real world, you can never really find such a situation. Think again about the example. If one investment does better than average by x%, when the other performs worse than average by x%, then the good return more or less nullifies the bad return, and you are left with the average. In sum, the perfect negative correlation means that any bad surprises from one investment will be offset by good surprises from the other asset. Put them both together in the same portfolio, and you have no surprises.
Now, you might be thinking that if the two investments are perfectly correlated in a negative fashion, why don’t they completely cancel each other out, leaving you nothing at the end of the year? If one completely zigs, when the other completely zags, shouldn’t you be left with a flat profile?
Not exactly. Remember that negative or positive correlations are rarely 100%. More importantly, I did not say that when one investment goes up 8%, the other goes down 8%. I said that when one goes up by more than the average performance of the market, the other goes down by more than the average performance of the market.
In Table 3.1, I assumed both investments are expected to increase by 15% per year. The perfect negative correlation therefore means that when one market goes up 23% (8% more than the 15% average expected), the other will increase by only 7% (8% less than the 15% average expected). In other words, one has climbed 8% more than average, while the other has risen 8% less than average. But both have gone up.
Enough with perfect correlations. Let’s take a look at the more reasonable and more common middle ground. In other words, let’s see what happens when you diversify into investments that have correlations that are much greater than –100% and much smaller than +100%. For example, in Table 3.1, you will see that if the correlation coefficient is exactly zero—that is, there is absolutely no relationship between the two investments’ movements—the probability of earning less than a 5% CD is roughly 28%. Compare that with the 37% chance of doing worse than the CD by having all your eggs in one basket.
This is a reduction of 37% – 28% = 9%. In short, by splitting your money into two parts, you are reducing considerably the risk of underperforming the CD. Thus, as you can see, even though the correlation between the two investments is zero—that is, if one does better than average, there is no indication of how the other will perform—there are still benefits to diversifying.
Similarly, if the correlation coefficient is –25%, the odds of your portfolio doing worse than the term deposit is 24% (or about one in four). Compare that with the 28% chance of doing worse when the correlation is zero. Once again, the benefits are clear. The lower the correlation between the two investments, the lower your risk.
I like to call this the fundamental law of diversification: “The risk of the sum is less than the sum of the risk.”
What do I mean? Remember that you need two ingredients or factors for successful diversification. The first is non-perfect correlation; the second is an expectation of some profit from both investments. How much you benefit from diversification will depend on the strength of these two factors.
By investing in two imperfectly correlated assets, you are reducing the overall shortfall risk compared to the individual shortfall risks of each asset. Thus, the risk of the sum, which is the risk of the portfolio that consists of two assets, is less than the sum of the risks; that is, just adding the risk of each individual asset.
Let me clarify this point by walking through a detailed example. We know that if you put $100 in a term deposit that pays 5% per annum, you’ll have $105 at the end of the year. Not much of a payback, but very safe. Now, let’s pretend that you want to invest in the market, take some risk, and diversify. Instead of putting your money in the bank, you put $50 in one asset (let’s call it Fund XYZ), and $50 in another (Fund ABC).
Now, we know from Table 3.1 that if there is zero correlation between the price movements of these two investments, then you stand a 28% chance of having less than $105 at the end of the year. This is what I call the risk of the sum. It’s the risk of your capital, or the risk of your portfolio.
On the other hand, if you put the entire $100 in any one asset, either Fund XYZ or Fund ABC, the chance of earning less than $105 now rises to 37%. This is what I call the sum of the risk. The fundamental law of diversification in action means that the risk of the sum (28%) is less than the sum of the risk (37%).
An additional point to mention is that in Table 3.1, we are dealing with a 1-year horizon. It examines the shortfall odds over a 12-month period. What happens if we extend this correlation analysis to a longer time horizon?
Table 3.2 paints the longer-term picture. This time, the returns on money split equally between two investments (in various correlation scenarios) are compared at 5 years (with a five-year, 5% compounded CD) and at 10 years (with a hypothetical 10-year 5% CD).
Table 3.2. Your Money Is Split Equally Across Two Investments: What Is the Probability of Earning Less Than a 5-Year and a 10-Year 5% Compounded Certificate of Deposit?
Expected Return=15%, Investment Volatility=30%; Probability Each Asset Earns <5% Compounded For 5 yrs = 22.80%; For 10 yrs = 14.59%
Source: Moshe Milevsky and the IFID Centre, 2012.
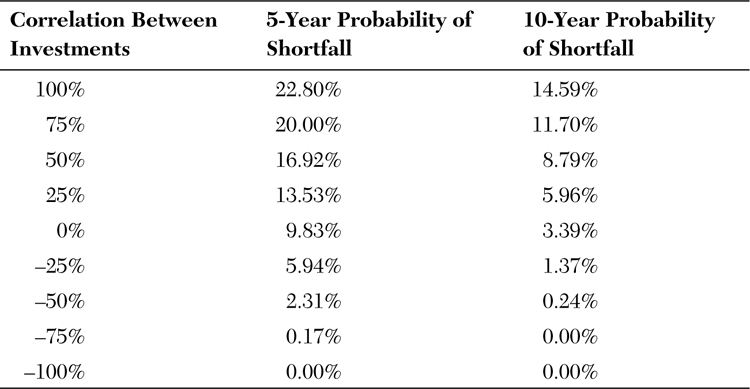
As you can see, Table 3.2 has uniformly lower shortfall probabilities than those in Table 3.1. What does that mean? It means that the odds of earning less than a five-year compounded 5% CD decrease the longer you hold the investment.
But even more important than the time-horizon effect in Table 3.2 is the fact that the amount by which the shortfall risk is reduced depends on the correlation coefficient between the two assets that you are mixing in your portfolio. In other words, the lower the correlation, the lower the risk.
Compare, for example, the zero correlation case. In Table 3.1, looking at risk over a one-year period, the probability of shortfall was roughly 28%. In the case of a five-year horizon with zero correlation between the assets, the probability of shortfall is reduced to roughly 10%. Over 10 years, the same zero correlation between the two investments leads to a shortfall risk of approximately 3%. Isn’t it remarkable what four (or nine) more years of investing can do?
The reduction is even more pronounced if you look at a –50% correlation. Remember, a negative correlation means that when one asset is doing better than average, the other is doing worse than average. In other words, they are generally moving in the opposite relative direction. The –50% is midpoint on a scale of –100% to 0% and measures the relative strength of this opposite movement. In Table 3.1, the one-year horizon case, the probability of shortfall is roughly 19%. In Table 3.2, the five-year horizon, the odds are reduced to a mere 2%. For 10 years, it is reduced to less than a quarter of a percentage point. Notice the effect of time and the effect of correlation.
What are the lessons from these observations? Two things will reduce the shortfall risk of your portfolio:
• The longer time horizon over which you hold the portfolio.
• The movement of the assets in your portfolio. The more independently they move—that is, the lower their correlation—the more your risk is reduced.
I like to argue that there are two dimensions to investment diversification—time and space. In other words, there are two aspects to diversification. By time, I mean the length of time you hold the portfolio—the longer you hold it, the more diversified your portfolio becomes. If you consider the essence of diversification to be the reduction of shortfall risk—owing to the imperfect correlation—then holding the portfolio for longer periods of time will also reduce shortfall risk.
I believe that if you invest in U.S. equities during the year 2010 and during the year 2011, you are essentially holding two different investments. Sure, they are the same asset class, namely, U.S. equities. But the returns from these two investments are most likely uncorrelated; that is, the return in one year is independent of the return in the next. If U.S. equities do better than average during 2010, the odds are still only 50/50 that they’ll do better than average during 2011. So I would argue that you diversify your investments by holding both equities in 2010 and equities in 2011. You see, in my opinion, the word diversification is not just about diversity at any one point in time; it’s actually about investing in products that do not move together, so that your shortfall risk (probability of regret) is reduced. Therefore, investing for long periods of time in one asset is qualitatively similar to investing in different assets over one period of time.
By space diversification, I mean that the more independent assets you have in your portfolio (independent in the sense of not moving in tandem with each other), the more diversified the portfolio becomes. I chose the word space to reflect this principle because when you diversify across geographic and economic boundaries, you are likely, though not necessarily guaranteed, to find investment assets that move independently.
I do hope you grasp the main point that emerges from this general approach. Specifically, the positive effect of more time (a longer holding period) and more space (more investments that move independently of each other) on your portfolio. Now let me address some of the real-world issues.
If you can find and invest in another asset class that is expected to increase but is not perfectly correlated with your U.S.-based equity investment, you will gain from the law of diversification. And the less correlated this asset class, mutual fund, or investment is with the U.S. market, the greater will be your gain.
The same diversification principle, of course, is applicable to more than just national stock markets. Bonds, real estate, precious metals, commodities, and even art do not move with perfect correlation to U.S. equity markets. The actual correlations vary over time but there is room for most of these asset classes in a well-balanced portfolio because they will all help to reduce your shortfall risk—the risk of doing worse than the risk-free benchmark (the 5% CD in our example). Remember the two ingredients, though: They must have imperfect correlation and they must have a reasonable chance of making some money over time. (The price of Elvis memorabilia is not correlated with the general stock markets, but I’m not sure about the growth prospects.)
So what, then, is the right amount of diversification for you? Precisely how much should you invest in each of these asset classes? What allocation is the right one given your circumstances? How much should you invest in the U.S., the U.K., Germany, or even Japan?
Good questions. Unfortunately, as is often the case with investment decisions, the answers depend on your personal circumstances, needs, requirements, fears, and phobias—otherwise known as your attitude toward risk. I do not have a cookie-cutter, formulaic answer that will fit all possible contingencies. In fact, I am very much averse to computer programs and black-box solutions to your investment needs. You must discuss these issues with your financial planner, investment adviser, broker, or even tax accountant.
How Does Time Impact Financial Risk and Volatility?
Imagine that you’ve just received a windfall inheritance from a distant relative. You decide to pay off some bills and, having done so, you discover that you still have $1,000 left over. You don’t really need the money right now, so you decide to put it away for a rainy day.
You call up your financial adviser and ask, “What should I do with the $1,000? Should I put it all into a well-diversified index fund? Or should I play it safe and buy a three-month T-Bill?”
Of course, the prudent response on the part of your financial adviser would be to suggest some form of diversification; after all, he might say, you don’t want to put all your eggs in one basket. Depending on your risk tolerance, long-term goals, and financial position, you should probably split the money into various piles and certainly not restrict yourself to the all-or-nothing bank deposit or stock market choice.
But let’s examine the all-or-nothing question in greater detail, focusing on the two extreme alternatives. If you “take the plunge” and invest the $1,000 in the stock market, what are the odds that you will regret this decision? What is the probability that the stock market is the wrong place to invest your money?
You might have noticed that those questions are pointless in a sense. They are pointless because no meaningful answer can be determined unless we specify an appropriate investment holding period. If you take the plunge, will you regret the decision tomorrow? Will you regret the decision in one year? Will you regret the decision in 10 years? When do you need the money?
Table 3.3 illustrates what I call the time-adjusted “probability of financial regret.” Using data from the last 80 years (approximately 1,000 months), we see that over a one-year time horizon, a 31% chance exists that a diversified portfolio of U.S. equities (the S&P 500 Total Return Index) will underperform the rate of return from a safe money market asset (three-month T-Bill). What about a 10-year horizon? In that case, the table shows that a diversified portfolio of U.S. equities has just a 14% probability of shortfall. In other words, there’s a better than four-in-five chance that, over the next decade, the U.S. stock market will experience a rate of return that is greater than the return currently available from a secure three-month T-Bill.
Table 3.3. Probabilities and Magnitudes of Financial Regret
Source: Federal Reserve Bank of St. Louis and Centre for Research in Security Prices 2012; IFID Centre calculations.

Looking at Table 3.3, you might wonder what the term pain represents. This is simply the average magnitude by which an investment in the S&P 500 has fallen short of T-Bills (on a $1,000 portfolio). For example, someone who invested $1,000 in the S&P would have a 31% chance of earning a lower rate of return than T-Bills over a 1 year period. If they did in fact earn a lower rate of return than T-Bills, then the amount by which they would have fallen short would on average be $142.90. Surprisingly, the “pain” from shortfall increases over time, reaching in excess of $200 over a 10-year period. How can this be? Isn’t diversifying over time supposed to reduce risk and not augment it? Well, the risk does indeed fall. For instance, if you hold a $1,000 portfolio in the S&P 500 for a 10-year period, then there is only a 14% chance of falling short of Treasury Bills, much less than the 40% probability of shortfall from only holding stocks for a month. However, if you are one of the 14% of unlucky people to fall short, your loss on your $1,000 will be big, totaling $244 less than what you would have earned on T-Bills. In other words, when you lose in the long run, even though the chance of it happening might be slim, you will lose big.
Finally, what if your time horizon is 34 years away? In this case, we look at the top panel of Figure 3.2, which is simply a curve fitted to the data of Table 3.3. By extending the curve outwards, the chart indicates a probability of financial regret of roughly 1%. As the time horizon increases, the probability of shortfall decreases rapidly; scientists like to say that it decays exponentially. It never actually hits zero—there are no guarantees in life—but it gets very close to zero. Time and financial risk are intricately intertwined. However, as we previously looked at, the magnitude of the shortfall (that is, the “pain”), continues to increase. This is illustrated in the bottom panel of Figure 3.2. If we were to extend the pain curve outwards, we would see that a “pain” of approximately $400 corresponds to a 1% probability of shortfall.

Source: Federal Reserve Bank of St. Louis and Centre for Research in Security Prices 2012; IFID Centre calculations.
Figure 3.2. The pain and probability of shortfall.
Just as we must know the appropriate unit of time to comprehend a given speed, financial risk has an embedded dimension of time. Talking about whether something is risky or safe without addressing the relevant time horizon and the financial alternatives is meaningless. Indeed, over a one-year horizon, the stock market is clearly quite risky—relative to the secure alternative of putting the money in a three-month T-Bill. That’s because the probability of shortfall, or regret from investing in stocks, is 31%.
On the other hand, if you adopt a 34-year horizon, the stock market has lower shortfall probability relative to the T-Bill alternative. That’s because the probability of regret would then be about 1%. The flip side of this implies a strong probability of success, of having made the right choice. That probability is close to 99%.
Should I Take More Risk When I’m Younger?
If you’re wondering whether to take more risk when you’re younger, the short answer is not necessarily, “It depends among other things on your human capital.” Now for the long answer. To recap, investing is all about taking advantage of probabilities. If in any given year in the future there is a 50% chance that the stock market will decline, then the odds of getting two bear-market years in a row is 25% (1/2 × 1/2), 12.5% (1/2 × 1/2 × 1/2) for three years, and so on.
In discussing the concept of investment diversification, I have up to this point excluded potentially the greatest asset on your balance sheet—your human capital. Although conceptually this asset is different from your tangible financial assets, it should actually be considered and diversified in tandem with your financial capital. This might sound like an abstract concept, but I will try to convince you that you can and should implement it as part of your risk management strategy over your life cycle. This is where the question, “Are you a stock or a bond?” comes in. By this I mean does your human capital exhibit the characteristics of a risky equity investment? For example, do you work in an investment banking firm where your compensation is somehow linked with the performance of an index such as the S&P 500? Or is your income more steady and predictable like a long-term government bond? For example, as a tenured university professor, I can say with confidence that I am a bond.
After you have analyzed the riskiness of your human capital, you should be using financial and investment capital to hedge it from potential losses; the same diversification principles that I discussed earlier are applicable.
Review the form of compensation that you receive in your place of work. For example, if you find that a significant portion of your compensation is received in the form of company stocks and options, then your total capital may be poorly diversified because the bulk of your human capital already rests with your place of work. Instead, and according to the main idea of diversification that I mentioned earlier, your invested assets should zig when your salary zags. If you find yourself in the situation in which your human capital and financial capital are zigging and zagging together, change the composition of one of them! Change your asset allocation, tilt your financial portfolio away from your human capital. Get compensated differently and revisit the structure of your 401(k).
Alternatively in the other direction, your human capital can be viewed as a hedge against losses in your financial capital. Remember that over time, the probability that your diversified stock portfolio will earn less than a risk-free money market fund or bank account will decline. However, as you saw from the figures and tables, over a 30-year horizon there is still a chance you will do worse. However, and this is one of the key messages from this chapter, even if markets do not perform as well as expected and even if returns are not as good as in the past, you always have the option to continue working, save more, and perhaps cut down on your spending and expenses. Sure, this is not an ideal to aim for or something to aspire to, but let’s be honest here. It is an option. This itself is valuable and can be used as a hedge against investment risk. Remember, after you are retired and moving toward the end of the life cycle, this option is not readily available and can’t be relied upon to smooth out the investment bumps in the market. But in the accumulation or saving-for-retirement phase, it is definitely a reliable crutch.
So, as a 50-, 40-, or especially 30-year-old, you should be willing to take more chances with your total portfolio, perhaps even borrow to invest or leverage into the stock market, because you have the ability to mine more human capital if needed. Practically speaking, if your career and investments work out well, you can retire (or reduce your work load) at the age of 65. However, if you happen to get unlucky, you can delay your retirement by a few years and make up the lost market returns with more human capital. Again, this is not an ideal situation and not something you want to aim for in advance, but it’s a fall-back strategy that also diversifies your total portfolio.
Diversification and the Financial Crisis
The financial crisis hit investors hard; even those who thought they were well diversified. For instance, between January 2008 and March 2009, the S&P 500 lost an astounding 52%. In other words, if you had a portfolio consisting of the 500 stocks that comprise the S&P 500, you would have lost 52 cents on each dollar invested over that time period.
Although holding stocks of 500 different companies from various industries might at first glance seem like a good diversification strategy, it is in fact not. This is because you are not diversified across space, as equities are not entirely independent of one another. In other words, movement in the equity markets is often guided by factors that are common to all equities such as market sentiment and economic conditions.
Instead, those investors who diversified across space and held assets such as gold and currency, in addition to their equities, were relatively shielded from the effects of the financial crisis. Between the aforementioned period of January 2008 and March 2009, gold prices rose by 9% and the U.S. dollar index gained 18%.
Putting this in perspective, someone who had invested $1,000 in the S&P 500 in January 2008 would have $480 in March 2009. However, imagine this person had diversified smartly and split her portfolio three ways: a third in the S&P 500, a third in a U.S. Dollar Index, and a third in gold. The portfolio balance on March 2009 would be $917, a total loss of only 8%, miniscule in comparison to the losses suffered by the majority of investors during the financial crisis.
A natural question to ask is why did equities fall but gold and the U.S. dollar go up? The answer lies in correlations. The U.S. dollar and the S&P 500 have a low (even negative) correlation; when equities plummet in value, investors flock to safe assets such as the U.S. dollar. Compared to many other countries, the U.S. had the size and power to weather the financial crisis, making its currency relatively safe. Thus, with increased demand for the U.S. dollar, its price naturally increased, rewarding those who invested in it.
Similarly, gold is a safe-haven asset and it has historically held its value over time. Investors also flocked to this commodity during the financial crisis because of its perceived safety. Furthermore, gold is an inflation hedge. As the Federal Reserve continued to pump money into the American economy, investor demand for gold quickly rose to protect against expected inflation.
As was illustrated by the previously mentioned financial crisis example, diversification does indeed work. By holding assets that are independent of one another over an extended period of time, you can eliminate some risk and shield yourself against extreme portfolio volatility.
We can even extend this concept to corporations. A study by the Boston Consulting Group shows that those companies with diversified operations recovered more rapidly and outperformed their peers during the financial crisis. These corporations were able to take advantage of the financial stability provided through diversification to avoid overreacting to the crisis (for example, layoffs, divesting business lines, and so on). They were instead able to invest in the future and pursue M&A, while leveraging the diversity of their cash streams to shift capital into high-return businesses.
Summary
• Diversification is very important at all stages in life. This implies, among other things, that you should not allocate more than a small fraction of your 401(k) tax-deferred savings plan to company stock. You should make sure to have exposure to international stocks and alternative asset classes as well.
• Remember that the most valuable asset on your personal balance sheet is your human capital, which has characteristics of a stock or bond. The riskier your human capital—for example, the more it resembles a stock—the fewer stocks you should have in your investment portfolio and financial capital; inversely, the less risky, the more it resembles a bond.
• Over long time horizons, the probabilities favor investing in stocks/equities. This does not mean the risk disappears or goes away. It simply means that you have better odds. On the flip side, if your equity investments do indeed fall short of money-market returns, the magnitude of the loss will be greater over longer time horizons.
• The real reason you can afford to take more diversified investment risk within your 401(k), when you are saving for retirement, is that you have an investment in human capital, which might behave more like a bond than a stock. You also have the option to delay retirement, which gives you a buffer against market risk and volatility.
• Don’t let an event such as the financial crisis wipe out your portfolio; diversifying across space—not trying to time the market—can help shield your assets against economic calamity.
Endnotes
An interesting and accessible paper by Jagannathan and Kocherlakota (1996) reviews the reasons time and age might, or might not, play a role in the optimal asset allocation. One of the early works on the concept of time diversification is the monograph by Reichenstein and Dorsett (1995). The book by Siegel (2002) is by now a classic in the field, advocating that long-term investors should allocate a much larger percentage of their wealth to stocks, while the book by Bodie and Clowes (2003) takes the opposing view that investors are taking on too much risk and should allocate more toward fixed income bonds. For those who want to read up on the state of the art when it comes to asset allocation models, please refer to Campbell and Viceira (2002). The recently published book by Milevsky (2012) called The 7 Most Important Equations for Your Retirement has an entire chapter (Chapter 5) devoted to this topic, which lists some of the concerns with time diversification as expressed by Professor Paul Samuelson. In most of the book, I use the term expected return to denote the arithmetic mean. The arithmetic mean (AM) return is greater than the expected growth rate, also known as the geometric mean (GM) return. To convert AM into GM, subtract half the volatility squared. For example, if AM = 7% and volatility is 20%, the GM = 0.07–(0.5)(0.2)^2 = 5%.