
10. Product Allocation Is the New Asset Allocation
“Asset allocation explains 95% of investment performance.”
—Myth #10
In the early years of our financial life, as we are busily working and converting our human capital into financial capital, the single most important piece of economic wisdom that one should strive to implement is the concept of diversification. Proper diversification is usually practiced by making sure that our financial capital is allocated across many diverse and uncorrelated asset classes, which hopefully do not share the same risk factors as our human capital. Indeed, asset allocation—whether it is across stocks and bonds, value and growth, small cap and large cap—is the cornerstone of diversification. The two ideas go hand in hand.
However, as we get closer to retirement, I believe that asset allocation takes on a more limited role, compared to the much more important and critical decision of a suitable product allocation. By the term product allocation, I mean the decision of how much of your retirement income should come from conventional financial instruments, such as mutual funds or exchange traded funds, and how much should be generated by pension-like products, such as life annuities, variable annuities, and other guaranteed insurance products. In this chapter, I discuss and present one possible approach to determining a suitable Product Allocation for Retirement Income, which is abbreviated by the acronym PrARI.®1
1. Note that PrARI® is a registered trademark owned by the QWeMA Group and used with its permission.
Introduction to Product Allocation
As I have argued and demonstrated in previous chapters, as individuals transition from wealth accumulation (converting their human capital) to income generation (spending their financial capital), they face unique and different risks that simply do not arise in the years prior to retirement. As a brief refresher, I review these risks before I introduce my main thesis regarding optimal product allocation for retirement income.
Longevity Risk
The National Center of Health Statistics reports that American life expectancy at birth has increased by about 15 years in the last 50 years alone. As of 2010, it is estimated to be 76.2 years for males and 81.1 years for females. Of course, averages alone don’t tell the entire story because when we actually reach our retirement years, the chances of surviving for another 20 to 30 years are quite substantial. I covered this all in great length in Chapter 7, “Longevity Is a Blessing and a Risk.”
For instance a typical 65-year-old male has nearly a 46% chance of surviving another 20 years. A female’s chances are even greater. One of every two 65-year-olds females alive today is estimated to survive to the age 85. Perhaps the most compelling of longevity statistics are the probabilities of survival for at least one member of a couple. For example, the chance that at least one member of a couple (where both are 65-years-old) survives to age 85 is 76%; the probability that one spouse or even both are alive at age 90 are one in two.
Although individual lifestyle factors, behavioral habits, and family history will obviously impact any survival estimates, my main point is to remind the reader that human lifespan is random and a retirement strategy must—more so than ever before—account for this longevity risk.
Inflation Risk
The U.S. Federal Reserve is dedicated to ensuring that macro-economic inflation is kept at acceptable levels. They do this by fine-tuning monetary policy so that the change in the Consumer Price Index (CPI) and other aggregate measures of inflation that they track are kept within a certain range. However, the U.S. Federal Reserve doesn’t target and will never accept a zero percent inflation rate target. Thus, what many retirees fail to realize is that even a very low inflation rate can have a detrimental effect on their purchasing power several years into retirement.
If you recall from Chapter 5, “Personal Inflation and the Retirement Cost of Living,” even an inflation rate as low as 2% can reduce the purchasing power of $1,000 by more than a third after 20 years of erosion. After 35 years, the initial $1,000 is only worth half of its original value in real terms under the same 2% inflation rate.
The mathematics of purchasing power erosion is even more pronounced for retirees. Aside from the CPI, by now you should be aware that the U.S. Bureau of Labor Statistics recently inaugurated a new unique inflation index for the elderly, which they call CPI-E. The need for this new index arises because as we age, our spending habits change. Any inflation index, after all, is a reflection of a given basket of goods, and this new index aims to capture retirees’ spending patterns. It turns out that the CPI-E has actually outpaced the broad population CPI by 0.5% to 1% per year throughout much of the past 25 years. What this all means is that inflation is different and is higher for retirees.
Sequence of Returns
In Chapter 6, “Sequence of Investment Returns,” I demonstrate how in the years just before and just after retirement, also known as the fragile risk zone, a retiree’s nest egg is most sensitive to losses from poor market returns. This is the point at which the greatest amount of money is at stake. Thus, if investment returns are sequenced so that negative returns are earned early on in retirement, the sustainability of the spending strategy might be threatened. Of course, one cannot control the timing of an inevitable bear market, just as we have no control over the precise length and cost of our lifespan or the rate of inflation throughout our retirement.
Thus—and this is one of my main points that motivate the need for a product allocation strategy—rather than trying to predict the outcomes of any of these random events, I believe one should insure against adverse outcomes using a product allocation strategy. In a sense the objective is to hedge against these retirement risks in the context of one’s retirement goals.
Given the growing importance of retirement risk management, it is not surprising that the financial services industry is continuously expanding its repertoire of insurance and investment products and their embedded features. The resulting challenge is determining which of these products should be recommended for allocating a client’s wealth and in what proportions.
As a starting point, I would argue that three principal financial and insurance categories should be considered for a comprehensive product allocation strategy.
First, the systematic withdrawal plan (or SWiP) is a strategy in which money is systematically withdrawn from a fund allocated among various investments to generate a retirement income. This process continues until the account value hits zero, or until the end of the retiree’s life cycle.
Second, the latest generation of variable annuities offers the option to elect a number of riders or features with embedded guarantees that address retirement risks. The growing list of acronyms includes the GMAB (guaranteed minimum accumulation benefit), GMWB (guaranteed minimum withdrawal benefit) and GMIB (guaranteed minimum income benefit). These features and their associated promises were summarized in Table 9.4. The GMWB and the GMIB are of particular interest for the discussion of retirement income, and going forward I refer to them as guaranteed living benefits or GLiBs.
Finally, this brings us back to lifetime pay-out income annuities (LPIAs), also known as single premium immediate annuities (SPIAs) or fixed immediate annuities (FIAs). The primary risk-management benefit of this product is that it provides the buyer with longevity insurance. The embedded longevity insurance protects the annuitants against outliving their life expectancy. That is what you are insuring against by acquiring an LPIA, and to a certain extent, a guaranteed living income benefit (GLiB). Moreover, the longevity insurance is even more valuable when the LPIA is purchased early in life (for example, prior to age 50) with payments that commence late in life (for example, after age 80). In fact, the greater the gap between the purchase date and the commencement date, all else being equal, the greater are the embedded mortality credits, which is a term actuaries use to describe pure longevity insurance. This type of plan is often referred to as an ALDA or an advanced life delayed annuity and is also described in Table 9.4.
Guaranteed living income benefits (GLiBs) on the other hand, by virtue of the fact that they are not pure LPIA products, like the ones described previously, don’t contain as much longevity insurance. They contain some, because in some cases they do promise payments for life; but they also provide another form of insurance against a poor sequence of returns. This is in addition to giving you access to a diversified variety of investment funds, such as stocks, bonds, and other conventional securities. Because of its unique combination of insurance against a collection of risks, I consider it to be its own risk management product and worthy of its own allocation.
Before determining which of these three categories are appropriate for a particular retiree and in what combination, gauging their relative strengths and shortfalls is important.
In Figure 10.1, I assign a relative numerical score to each of the three products based on its effectiveness at hedging the three retirement risks and addressing retirement goals. Collectively, these scores form what I call the retirement grade point average (GPA) matrix. Although opinions might vary on the specific scores, hopefully the overall ranking is intuitive.

Source: Moshe Milevsky and the IFID Centre, 2012.
Figure 10.1. The different strategies, each with a grade point average.
Focusing first on the left side of the chart and retirement risk management attributes, you start by evaluating the lifetime payout income annuity (LPIA). As mentioned, the strength of this product lies in its promise to pay out a steady, fixed payment for as long as the policyholder lives. Because the retiree cannot outlive the guaranteed income that the LPIA provides, longevity risk is directly addressed and hedged. The product can even be viewed as a close substitute for the disappearing traditional pension. Accordingly, I assign the highest score of 5 to the LPIA for the longevity risk attribute.
Conversely, the LPIA scores the lowest on its ability to tackle inflation. In its basic form, a LPIA provides fixed payments in nominal terms. So the most common manifestation of the product does not avoid the erosion of purchasing power effect. Finally, I assign a somewhat neutral score to the LPIA for its ability to hedge against the sequence of returns risk. Although the product does not explicitly provide insurance against an early bear market, it indirectly overcomes the risk, because payments are fixed and guaranteed regardless of market fluctuations.
Moving on to the SWiP category, Figure 10.1 shows a reversal in risk management strengths, compared to the LPIA: The product receives the highest grade for the inflation hedging attribute. The investment choices within a SWiP account are virtually endless and the underlying asset allocation is under the control of the investor. This allows him to select investments that tend to outpace the rate of inflation.
The SWiP ranks the lowest, however, for the sequence of returns attribute. It offers no protection against potential market drops in the fragile risk zone. This shortfall might result in a damaging and lasting financial effect on retirement. Also, though a SWiP allocation heavily weighted in fixed-income investments might overcome market volatility, it might lead to low growth. As a result, investments might not keep up with the rate of inflation and the retiree may “outlive” her funds.
Next, for its effectiveness as a longevity hedging tool, the SWiP account receives a score of 0. There are again no associated guarantees, and the investor is solely responsible for monitoring and adjusting the spending and investment policy to make the account last for the duration of retirement.
As for the GLiB category, the grades are mixed. These products score the highest among the three for their capability to hedge a retirement against the sequence of returns risk. Implicit guarantees and promises are the core of GLiBs. Many of them promise at least the return of the initial investment, despite the performance of the market in the fragile risk zone. GLiBs are analogous to (albeit complex) long-term equity put options that can be purchased in the open market to provide downside protection on a portfolio. Thus, their embedded guarantees earn GLiBs the highest score for this attribute.
However, not all GLiBs are created equal. Only some variations offer a true form of longevity insurance that guarantees an income for life. As a result, the GLiBs fall short of the LPIA’s high score on the longevity risk management attribute.
Finally, just as they vary in their ability to address longevity insurance, some GLiBs are superior to others in their effectiveness at hedging inflation. Although GLiBs do not typically provide explicit inflation protection, many offer systematic payment step-ups or increases that could potentially offset the impact of inflation. Hence, this product ranks between the SWiP and the LPIA for this attribute.
As you can see in Figure 10.1, the risk management attributes of the three retirement income products are only half of the story. The allocation among the products must be selected in the context of at least three goals: liquidity, behavioral “self-discipline,” and estate.
For example, a total allocation to a LPIA would be inappropriate if the retiree’s future goal was to leave a large sum to his estate. Likewise, the product’s inherent design would not allow for a fluctuating spending rate or large lump sum withdrawals for unexpected cash needs. After all, the reason LPIAs are able to offer such effective longevity insurance is the complete irreversibility of the initial lump sum payment. Thus, for the LPIA’s ability to address liquidity and estate goals, the product receives a score of 0.
On the other hand we assign a high score of 5 for the LPIA’s capability to overcome potential behavioral mistakes that investors are prone to making. That is, many of us are susceptible to making irrational decisions and errors with our investments in the absence of restrictions or a guiding system in place. This can decrease the chances of meeting our spending goals in retirement. When the initial irreversible payment is made to the insurance company issuing the LPIA, the control over the investment management decisions is also transferred away from the investor. This leaves virtually no room for behavioral biases and blunders.
The SWiP once again earns the reversed ranking on this set of goal-achievement attributes. With a SWiP, the investor can meet liquidity needs and estate goals with the greatest ease because she retains control over asset allocation and withdrawal rate. However, it is this exact same reason that leads to a score of only 1 for the SWiP’s low effectiveness in helping the investor to avert behavioral mistakes.
Finally, only the GLiB’s evaluation on goal-achievement attributes remains. First, the liquidity of an account with a GLiB benefit is somewhat restricted because of withdrawal limits imposed by the rider. Moreover, variable annuities restrict withdrawals beyond a certain limit by charging surrender fees. However, the policyholder does have a certain level of flexibility, even if it might come at a price. Thus the GLiB surpasses the SPIA with a score of 1 on this trait.
A GLiB rider can also be effective in addressing behavioral weaknesses, hence its score of 3. When purchasing a GLiB, the investor effectively purchases peace of mind, knowing he is protected in the fragile risk zone against poor market performance. As a result the investor need not make any (possibly detrimental) moves to try to adjust his retirement investment and spending strategy.
Interestingly, the GLiB’s estate goal achievement attribute is somewhat interconnected with the behavioral attribute. Analysis of extensive industry data suggests that because the investor is protected against a market downturn during sensitive years, she is more likely to opt for a riskier asset allocation within the variable annuity. This allocation could potentially result in higher growth over the long term that could be bequeathed at death. Of course, in some cases the variable annuity account may eventually be annuitized or irreversibly converted into a retirement income stream. When this takes place—just as in the case of the LPIA—no death benefit will be paid. This limitation on the estate goal within the GLiB category leads to a score of 3 for this product category.
The final step in the retirement product GPA matrix is the assignment of a relative score to the products based on the fees they charge and the computation of the final product score. The basic LPIA tends to be the cheapest product option from the perspective of fees and commissions. The GLiB is the highest because of the associated ongoing insurance fee that must be charged for the embedded guarantees. The account owner maintains some control over the fees charged by a SWiP because these vary with the selection of the underlying investments. As a result, its fees and expenses score falls between that of the other two income products.
With scores assigned to each product for each attribute in Figure 10.1, I can proceed with the simple addition of the seven numbers to arrive at an overall product score in the right column. No, it is not a coincidence that the three values are identical. The point here is that the three products are economically equal. Each offers a valuable benefit that is “paid for” via a trade-off in another risk management or goal achievement attribute. That is, one product might hedge against longevity risk but at the expense of an estate or a liquidity goal; another product might offer peace of mind through guarantees but at the price of higher product fees, and so on.
Figure 10.2 graphically illustrates the retirement income problem. How do you split your nest egg across the range of available products? On the one hand, a systematic withdrawal plan (SWiP) provides much liquidity and flexibility but is not necessarily sustainable. In contrast, the immediate annuity or lifetime payout annuity (LPiA) provides 100% sustainability but at the expense of liquidity, bequest, and flexibility. Finally, the variable annuity with the new generation of guaranteed living income benefit (GLiB) provides greater flexibility and sustainability, but is obviously more expensive and has higher fees compared to the other two product classes. So, how do you determine the optimal mix?

Source: Moshe Milevsky and the IFID Centre, 2012.
Figure 10.2. Split the nest egg three ways: You decide how.
The PrARI® methodology guides individuals in determining the suitable mix for their nest egg. To properly implement PrARI, we need a number of input variables. Retirement age, estimated retirement wealth, desired spending rate, as well as existing pension and Social Security income are just some of the variables that must be assessed as part of the planning process. Combined, these elements will induce a particular retirement sustainability quotient (RSQ)—this is the probability that the spending strategy will be sustainable and will not result in a spending shortfall. As well, the input variables will induce a corresponding expected discounted bequest (EDB)—the present value of the amount expected to be left to the estate. Moreover, varying the product allocations will change the value of the RSQ (captured by the horizontal X-axis) and EDB (captured by the vertical Y-axis), which then traces out a frontier displayed in Figure 10.3.

Source: Moshe Milevsky and the IFID Centre, 2012.
Figure 10.3. The retirement income frontier.
Finally, your retirement priorities would be assessed to select your optimal retirement product allocation along the frontier. When trying to pinpoint an appropriate product allocation, a guiding concept should be the economic trade-off that is implicit within any selected product allocation: namely, security for oneself versus security for one’s heirs.
Table 10.1 displays the actual “optimal” allocations to the three product categories depending on your desired level of retirement income security (represented by the RSQ value) versus your desire and interest to leave a legacy for your loved ones. For example, assume that you have $100,000 in your retirement nest egg, and that you desire to spend $5,200 adjusted for inflation on an annual basis. This translates into a real spending rate of 5.2%, which is reasonable although it certainly is not guaranteed to be sustainable. By reasonable I mean that the retirement sustainability quotient is somewhere between 85% to 95% depending on your product allocation. Notice that the more you allocate to products that contain guaranteed living benefits (GLiBs) and lifetime pay-out income annuities (LPIAs), the greater is the retirement sustainability quotient.
Table 10.1. Product Allocation: A More Technical Look (Spend 5.2% of the Nest Egg, Adjusted for Inflation)
Assumptions: Risk free rate = 3%; 100% equity allocation;
Equity: expected returns = 7%, volatility = 18%; GLiB insurance fee = 1.3%, LPIA insurance load = 7%
Source: Moshe Milevsky and the QWeMA Group, 2012
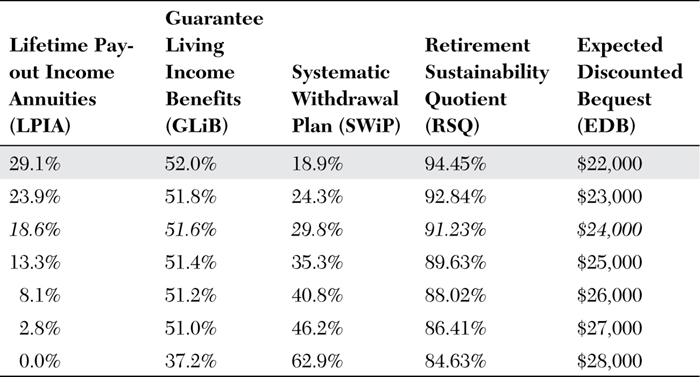
Of course, the price of a greater “sustainability” is that you must sacrifice a part of your estate goals. Notice that when you allocate only 18.9% to the systematic withdrawal plan and the remaining 29.1% to the LPIA and 52.0% to the variable annuity with a guaranteed living income benefit (GLiB), then although your RSQ value is 94.5%, the EDB value is a mere $22,000 of your original $100,000 nest egg. This is the tradeoff between risk and return in retirement. You can increase the security and sustainability of your desired retirement income, but it will come at the expense of your heirs and beneficiaries. If you want to leave as much as possible to the next generation, then obviously stay away from (expensive, irreversible) annuity products. On the other hand, if you primarily want to maximize sustainability and want to bequeath the remaining funds, then your allocation to annuity instruments should be greater.
Life insurance can also play a role in maximizing the estate value. After all, if the retiree is sufficiently well off so that he is never likely to exhaust his nest egg regardless of his spending rate, then life insurance is likely to be part of the optimal portfolio, at the very least for estate planning purposes. Likewise, the exact role of personal debt in the form of reverse mortgages or home equity loans—even at the advanced stage of the life cycle—is yet another dimension to a healthy product allocation diet. Another product that certainly belongs in the optimal retirement portfolio is long-term care insurance, which is yet another part of a prudent risk management strategy.
Guarantees Make People Feel More Comfortable
Up until now I have discussed the rather theoretical models and processes for how people should be making decisions about their retirement products, pension annuities, and insurance riders. However, seeing what investors and soon-to-be retirees are doing in practice is always interesting, and so I conclude this chapter with a brief discussion of how people actually behave when it comes to their product and asset allocations.
Some convincing evidence emerges from a large database of variable annuity policyholders that the researchers at LIMRA International have been kind enough to allow us to probe and dissect (anonymously, of course). It turns out that when investors purchase guaranteed living benefits, the perception of these attained guarantees gives them the confidence to modify their investment behavior. Namely, they unequivocally accept greater equity market risk simply because they have this insurance; it remains to be seen how this will impact the market, availability, and pricing of these benefits in the long run.
Together with a graduate student of mine, we reviewed the overall asset allocation of variable annuity account holders and classified their investment asset allocations within these products into two distinct categories: risky and risk-free. We were interested to see how these allocations varied by age as well as the types of guarantees (riders) selected. The kinds of questions we were interested in were: Do older policyholders allocate less wealth to riskier asset classes? Do younger policyholders embrace riskier asset classes? How does this change when various insurance riders and guarantees are elected? Figure 10.4 provides a graphical illustration of the main results for just one of the insurance companies we analyzed.

Source: M. Milevsky and V. Kyrychenko, “Portfolio Choice with Puts: Evidence from Variable Annuities.” Financial Analysts Journal, 2008.
Figure 10.4. I’m going to shoot for the stars.
The X axis displays the age of the policyholder when she opened or purchased the variable annuity. Our data goes from under age 40 on the left side, up to age 80 and beyond on the right side. On the Y axis we plotted the average amount that was allocated to the High and Medium Risk (HMR) categories, which included equity-based funds as well as real estate and international investments.
As you can see, the older investors tend to allocate a smaller amount to risky subaccounts within their variable annuities. This is fairly consistent with intuition and what economists call life cycle theory of investing.
Another finding is that when no guaranteed living benefit (GLiB)—that is, extra levels of protection—was selected by the client, the level of risky equity exposure within the account tended to be lower, by about 10 to 30 percentage points, compared to the basic case. We think this is the more interesting result.
In other words, roughly half of the more than 100,000 policies purchased contained no living benefits. In those cases the amount of equity exposure tended to be much lower compared to the policies in which the riders were elected (and paid for).
Is this terribly surprising? Not really. Most advisors will readily agree that these guaranteed living benefits provide some comfort and help investors accept more risk. These numbers support this fact and provide some estimates on the magnitude of this effect.
Note that this pattern—a GLiB selected is associated with greater risk exposure—is consistent across all insurance companies we analyzed. This is not just a fluke associated with one or two companies, or a given living benefit rider, or a particular company’s asset allocation restrictions.
Remember that individuals with more aggressive equity allocations essentially have a higher exposure to the stock market compared to fixed-income products, which in the long run is the winning asset class. In fact, the extra investment return that one obtains might offset the higher fees that are required to pay for this protection. Or here is a slightly offbeat way to think about this: A GLiB is a therapist that pays for itself!
Of course, psychology aside, one has to wonder: Is this extra level of risk justified in theory? For this, I believe the answer is a definite, “Yes.” After all, if you are granted an “equity put option,” (recall that this is a type of insurance on your portfolio) how else would you behave? Stated differently, why bother protecting or insuring a portfolio (that is, asset mix) that has little chance of requiring protection in the long run? If you want to hold bonds and other fixed income products in your portfolio, don’t waste valuable protection/insurance dollars and find some other silo in your personal balance to hold those low-risk instruments.
Now, along the same lines, some commentators have argued that a variable annuity with a GLiB can actually be treated as a “bond substitute” in the overall asset allocation. They go so far as to view the entire VA + GLiB package as a bond. This, I tend to disagree with. Remember that you cannot cash in and get your money back at anytime without incurring withdrawal fees, and you must wait (for a long time) to get all your money back. Thus, in some cases you have to wait for decades before you get the guaranteed return that is promoted on these products. This is very different from a conventional bond.
That said, once again, granting investors an equity put option should give the investor greater confidence to take on equity market risk, and one doesn’t require a bond classification to achieve this result. It is a different product class. It is not a bond, stock, or balanced fund—it is a new category.
The Bottom Line
Notwithstanding the disparate threads I weaved into this chapter, the main practical takeaway point is as follows: My extensive analysis, and the view of many of my esteemed colleagues in academia and beyond, leads me to conclude that in most cases retirees will not be able to finance a sustainable retirement income with only one or two traditional product classes, basic mutual funds, or conventional income annuities. Indeed, all three product categories—income annuities, mutual funds, and variable annuities with embedded guarantees—mixed and matched in various combinations are required to maximize one’s retirement sustainability quotient (RSQ). As you get closer to retirement, you will develop a better sense of your needs and feasible estate goals. We leave it in the hands of individuals and their financial advisors to determine the exact proportions that balance their own retirement risks with the desire for a financial legacy. In sum, retirement income is not an all-or-nothing, now-or-never proposition. Diversify across products and across time.
Summary
• At retirement one should strive to create a diversified portfolio of products that protect against various retirement risks. Take a portion of your 401(k), 403(b), IRA, or any other retirement plan, tax sheltered or not, and make sure to allocate a portion of the money to some sort of annuity instrument, whether fixed or variable, immediate or deferred—get some mortality credits.
• In the accumulation phase, asset allocation is the most important decision that people face with their investments. If you allocate too much of your retirement nest egg to any one asset class, economic sector, or industry, you are setting yourself up for disappointment. Diversify your assets. In the retirement income phase, however, product allocation will become (even) more important.
• PrARI methodology helps individuals and their advisors determine and decide how to split or distribute their retirement nest egg across the wide universe of choices. This process should not be ad hoc. Make sure there is a sound justification for your retirement product allocation.
• No single product addresses all three of the previously discussed risks to financial capital. However, diversifying across financial products can help reduce risk and drastically increase your chance of achieving retirement sustainability.
Endnotes
This chapter has been heavily influenced by extensive discussions I have had with financial advisors, insurance practitioners, and many individual retirees over the last few years. I owe each of them a debt of gratitude for helping me refine my thinking on the importance of product allocation in retirement. A much more detailed statistical analysis and discussion of the asset allocation within variable annuities is available in Milevsky and Kyrychenko (2008). The article by Ameriks, Veres, and Warshawsky (2001) was one of the first to make the argument that a retirement income portfolio should contain some mixture of basic income annuities to increase sustainability. The role and importance of annuities in a retirement income portfolio is discussed at length in the book by Brown, Mitchell, Poterba, and Warshawsky (2001). The paper by Chen and Milevsky (2003) forms the basis of a patented product allocation model that assists individuals in allocating wealth between immediate annuities and traditional investments using the economic concept of utility. As in previous chapters, I have shied away from giving references and citations to academic papers that are too theoretical or highly mathematical. The final examples and case studies in this chapter utilizing three different retirement income products including GLiBs, as well as measuring their impact on RSQ/EDB, were generated by the QWeMA Group’s PrARI methodology.