CHAPTER 23
THREE-DIMENSIONAL GEODETIC NETWORK ADJUSTMENT
23.1 INTRODUCTION
![]() With the advent of total station instruments, survey data are being collected in three dimensions. Thus, it is advantageous to develop an adjustment model that works in three dimensions. Rigorous triangulation adjustment models date back to Bruns (1878). The main observational data consists of horizontal angles, vertical angles, azimuths, and slant distances. It is also possible to include differential leveling in the model. Since all data are collected on the Earth's surface, the local geodetic coordinate system provides a natural system in which to perform the adjustment.
With the advent of total station instruments, survey data are being collected in three dimensions. Thus, it is advantageous to develop an adjustment model that works in three dimensions. Rigorous triangulation adjustment models date back to Bruns (1878). The main observational data consists of horizontal angles, vertical angles, azimuths, and slant distances. It is also possible to include differential leveling in the model. Since all data are collected on the Earth's surface, the local geodetic coordinate system provides a natural system in which to perform the adjustment.
As shown in Figure 23.1, the local geodetic system is oriented such that the n axis points along the meridian of the ellipse (local geodetic north), the u axis is aligned along the normal of the ellipsoid, and the e axis creates a right-handed coordinate system. The local geodetic coordinate system can be related to the geocentric coordinate system (see Section 17.5) through a series of three-dimensional rotations discussed in Section 18.7. To align the X axis with the e axis, the Z axis is rotated by an amount of λ − 180°. Then the Z axis is aligned with the u axis by a rotation of φ − 90° about the once rotated X axis. The resultant expression is

FIGURE 23.1 Relationship between the geocentric and local geodetic coordinate systems.

In Equation (23.1), changes in the local geodetic coordinate systems and geocentric coordinate system are represented by (Δn, Δe, Δu) and (ΔX, ΔY, ΔZ), respectively. Changing the algebraic sign of e and combining the rotation matrices given in Section 18.7 yields

The changes in the coordinates of the local geodetic system can be determined from the observation of azimuth Az, slant distance s, and altitude angle v. As shown in Figure 23.2, the changes in the local geodetic coordinate system can be computed as

FIGURE 23.2 Reduction of observations in a local geodetic coordinate system.

Also, from Figure 23.2, the following inverse relationships can be developed.

By combining Equations (23.2) and (23.4), the reduced observations can be computed using changes in the geocentric coordinates. The resultant equations are


In Equations (23.5) to (23.7), φi and λi are the latitude and longitude of the observing station Pi, ΔX is Xj − Xi, ΔY is Yj − Yi, and ΔZ is Zj − Zi. For completeness, the equation for the zenith angle is

Furthermore, since an angle is the difference between two azimuths, Equation (23.6) can be applied to horizontal angles.
23.2 LINEARIZATION OF EQUATIONS
Equations (23.5) through (23.8) can be linearized with respect to the local geodetic coordinates. The development of these equations is covered Vincenty (1989) and Leick (2004). The final prototype equations for slant distances, azimuths, horizontal angles, and altitude angles are listed in the following subsections. It is important to note that the residuals implicitly exist in each equation in order to make the equations consistent when using observations containing random errors.
23.2.1 Slant Distance Observations
In the three-dimensional model, slant distance (also known as slope distance) does not need to be reduced to either the station ground marks or ellipsoid in the functional model. However, if they are not reduced, then the computed values from Equations (23.5) to (23.8) are based on the instrument and reflector locations and not the station's ground marks.1 The prototype equation for the observed slant distances is
In Equation (23.9), the coefficients a1 to a6 are defined in Table 23.1, IJ0 is the slant distance computed using Equation (23.5), and sij is the observed slant distance.
TABLE 23.1 Coefficients for Linearized Equations in Equations (23.11) through (23.13)
 |
 |
 |
 |
 |
 |
 |
To demonstrate the derivation of the coefficients, a1 is derived by taking the partial derivative of the slant distance formula in Equation (23.6) with respect to ni, or

By substituting Δn from Equation (23.3), the resulting equation for a1 is

Following these procedures, the remaining coefficients for Equation (23.9) are derived.
23.2.2 Azimuth Observations
The prototype equation for the observed azimuths is
In Equation (23.10), α is the observed azimuth and α0 is its computed value based on Equation (23.6) and an approximate value for the station coordinates.
As an example, the coefficient for b1 is computed by taking the partial derivative of the azimuth formula in Equation (23.4) with respect to ni, or

By substituting the appropriate formulas from Equation (23.3), the resulting equation for b1 is

In a similar fashion the remaining coefficients of Equation (23.10) can be derived. For the remaining linearized observation equations in this section, the derivation of the coefficients for each equation follows procedures similar to those presented in Equations (a) through (d). The derivations are left to the reader.
23.2.3 Altitude Angle Observations
Altitude angles are observed in the vertical plane and have a value of zero at the horizon. As discussed in Section 23.7, all vertical angles can be subject to substantial systematic errors caused by deflection of the plumb line and refraction. Due to these errors, vertical angles should not be used in an adjustment on a regular basis. If these observations must be used in an adjustment, it is important to either correct the observations for the systematic errors or add the unknown parameters to the mathematical model to correct for the systematic errors. As discussed in Section 23.7, adding correction parameters to a typical survey runs the risk of overparameterization. This occurs when there are more unknowns at a particular station than there are observations. In this case, the system is unsolvable. Thus, it is assumed that the corrections will be made before the adjustment. The appropriate prototype equation is
The coefficients for Equation (23.11) are listed in Table 23.1. Their values are evaluated using the approximate coordinate values, vij is the observed altitude angle, and v0 is the altitude angle computed using Equation (23.5) and approximate station coordinates.
23.2.4 Horizontal Angle Observations
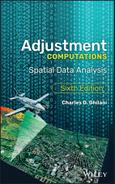
As stated earlier, horizontal angles are the difference in two azimuths. That is, θbif is computed as Azif − Azib where b is the backsight station, i is the instrument station, and f is the foresight station. The prototype equation for a horizontal angle is

The coefficients, d1 through d9, in Equation (23.12) are listed in Table 23.2, θbif is the observed horizontal angle, and θ0 is the computed value for the angle based on difference between the foresight and backsight azimuths computed using Equation (23.6).
TABLE 23.2 Coefficients for Linearized Equation (23.14)
 |
 |
 |
 |
 |
 |
 |
23.2.5 Differential Leveling Observations
Orthometric height differences as derived from differential leveling can also be included in the three dimensional geodetic network adjustment model. However, as discussed in Section 23.7, the inclusion of this observation type requires a correction for geoidal height differences between the stations and the application of orthometric corrections. Since the adjustment model is nonlinear, the observation equation for elevation differences as given in Equation (11.1) must also be linearized. The prototype equation for differential leveling between stations I and J is
In Equation (23.13), ΔHij is the observed elevation difference between the stations, ΔNij is the difference in geoidal height between the stations, and Δhij is the change in geodetic height. The approximately equal sign ≈ is used in Equation (23.13) since the geodetic height is a geometric distance from the ellipsoid to the point, whereas the orthometric height is the distance to the point from the geoid along a curved plumb line. The difference between the linear distance and that of the curve is small and can be absorbed easily by the residuals. Thus, Equation (23.13) is shown with an equality sign typically.
23.2.6 Horizontal Distance Observations
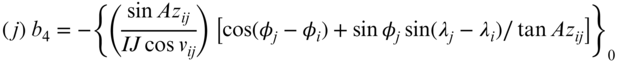
As shown in Figure 23.3, the elevation differences of the endpoint stations and converging radii cause the horizontal distances observed from opposite ends of the lines to start and terminate at different points. Thus, technically, l1 and l2 are not of the same length. In the local geodetic system, the observation equations for l1 and l2 are

FIGURE 23.3 Comparison of horizontal distances from opposite ends of the line.
However, for the short distances observed in surveying practice typically, l1 and l2, Δn1 and Δn2, and Δe1 and Δe2 are approximately equal. Letting l equal l1 and l2, Δn equal Δn1 and −Δn2, and Δe equal Δe1 and −Δe2, the linearized observation equation in local geodetic system is

In Equation (23.15), Mi is the radius in the meridian at the observing station I, Ni the radius in the normal at the observing station, lij the observed horizontal distance, and l0 the computed distance using approximate coordinates and Equation (23.14). The radii are computed as

23.3 MINIMUM NUMBER OF CONSTRAINTS
![]() A three-dimensional geodetic network adjustment requires both horizontal and vertical control. As discussed in Section 16.5, to fix the horizontal part of the adjustment requires one station fixed in position and one line of known direction. This can be accomplished by fixing the latitude and longitude of one station, along with the azimuth of a line or the longitude of a second station. The vertical plane in the adjustment can be fixed with three bench mark stations. Since the adjustment is performed with geodetic heights, the orthometric height of the bench mark stations must be corrected using Equation (23.37).
A three-dimensional geodetic network adjustment requires both horizontal and vertical control. As discussed in Section 16.5, to fix the horizontal part of the adjustment requires one station fixed in position and one line of known direction. This can be accomplished by fixing the latitude and longitude of one station, along with the azimuth of a line or the longitude of a second station. The vertical plane in the adjustment can be fixed with three bench mark stations. Since the adjustment is performed with geodetic heights, the orthometric height of the bench mark stations must be corrected using Equation (23.37).
As discussed in Chapter 20, control can be adjusted or fixed simply by setting the appropriate values in the stochastic model. In the case of vertical control, bench marks are often given as orthometric heights. Since the geoid model is only known to a few centimeters, the standard deviations of geodetic heights for bench mark stations should not be set any better than about a centimeter.
23.4 EXAMPLE ADJUSTMENT
To illustrate a three-dimensional least squares adjustment, the simple network shown in Figure 23.4 will be used. The standard deviations for the coordinates are shown in Table 23.3 in the local geodetic system. This system was chosen since it is intuitive for assignment of realistic uncertainty values in the adjustment and since the adjustment will be performed in the local geodetic system. As shown in Table 23.3, the network is fixed in horizontal position by overweighting of the northing and easting coordinates of station A and rotationally by overweighting the azimuth of line AB. The horizontal rotation of the network could have also been fixed by overweighting of the easting of station B.

FIGURE 23.4 Example three-dimensional geodetic network.
TABLE 23.3 Data for Figure 23.4
| Geodetic Positions | ||||
| Point | Latitude ( |
Longitude (λ) | Height (m) | N (m) |
| A | 41°18′26.04850″N | 76°00′10.24860″W | 372.221 | −31.723 |
| B | 41°18′40.46660″N | 76°00′05.50180″W | 351.394 | −31.713 |
| C | 41°18′22.04010″N | 76°00′00.94390″W | 362.865 | −31.726 |
| D | 41°18′27.65860″N | 76°00′31.38550″W | 370.874 | −31.722 |
| Geodetic Azimuth | |
| αAB | 13°56′26.9″ ± 0.001″ |
| Slant Distances | ||
| Course | Distance | S (m) |
| AB AC CD DA BC |
458.796 249.462 729.122 494.214 578.393 |
0.005 0.005 0.006 0.005 0.005 |
| Horizontal Angles | ||
| Stations | Angles | S (″) |
| DAB | 98°10′25″ | 2.8 |
| BAC | 105°47′45″ | 3.5 |
| CAD | 156°01′44″ | 4.1 |
| ABC | 335°29′37″ | 2.4 |
| CBA | 24°30′19″ | 2.4 |
| BCD | 294°19′17″ | 2.3 |
| DCA | 15°59′01″ | 3.3 |
| ACB | 49°41′45″ | 3.4 |
| CDA | 352°00′45″ | 2.2 |
| ADC | 7°59′12″ | 2.2 |
| Zenith Angles | ||
| Stations | Angle | S (″) |
| AC | 92°09′01″ | 2.5 |
| CD | 89°22′24″ | 0.8 |
| DA | 89°50′44″ | 1.2 |
| AB | 92°36′12″ | 1.4 |
| BC | 88°52′01″ | 1.1 |
| Elevation Differences | ||
| Stations | ΔElev (m) | S (m) |
| AC | −9.359 | 0.005 |
| Uncertainties of Positions in Local Geodetic System | |||
| Station | Sn (m) | Se (m) | Sh (m) |
| A | 0.001 | 0.001 | 0.01 |
| B | – | – | 0.01 |
| C | – | – | 0.01 |
| D | – | – | – |
The elevation datum was fixed in position and rotation by overweighting the height components of stations A, B, and C. Since orthometric heights were given for the stations, the geoid separation was applied following Equation (23.37) to compute geodetic heights for the stations. All the distance observations were observed in metric units. The systematic errors discussed in Section 23.7 were removed from all angular observations. The results of the adjustment are shown in Figure 23.4.
While the adjustment is performed in the local geodetic system, both geodetic and geocentric coordinates are required to compute the coefficients and computed observations. Since traditional observations are taken by an elevated instrument to some elevated target, the geodetic heights of each station must be increased by the setup heights when computing geodetic coordinates. This simple addition to the software removes the need for reducing observations to the station marks. In this example, the setup heights of the instruments and targets are assumed to be zero and thus do not need to be considered.
23.4.1 Addition of Slant Distances
Following prototype Equation (23.9), each slant distance observation adds one row to the system of equations. As an example for the slant distance AC, the coefficients are computed as

In Equation (23.17), the values for AzAB and AzBA are computed using Equation (23.6), vAB and vBA are computed using Equation (23.7), and AB using Equation (23.5). The numerical values, to five decimal places, for Equation (23.17) are

For each slant distance, a similar observation equation is written. The reader should note in Equation (23.18) that unlike plane adjustments as presented in Chapter 13, the coefficients of the occupied and sighted stations vary slightly due to Earth curvature. Four more equations for distances AC, CD, DA, and BC are added to the system of equations.
23.4.2 Addition of Horizontal Angles
The observed angles in the network were corrected for the systematic errors caused by the height of targets and deflection of the vertical as given in Equations (23.30) through (23.32). Following prototype Equation (23.12), an observation equation is written for each horizontal angle. As an example, the observation equation for angle DAB is

In Equation (23.19) the values in the {} are evaluated at their approximate coordinate values, θDAB is the observed angular value corrected for the systematic errors discussed in Section 23.7, and θ0 is the value computed based on the difference in the computed values for the backsight (AD) and foresight (AB) azimuths. Substituting the appropriate values into Equation (23.19) and converting the radian values to units of s/m results in

For each angle, a similar observation equation is written, resulting in 10 equations in total to be added to the adjustment.
23.4.3 Addition of Zenith Angles
All the zenith angles in this example problem were corrected for deflection of the vertical, refraction and target height as discussed in Section 23.7. Following Equation (23.11), the observation equation for the zenith angle from A to C is

In Equation (23.21), the coefficients on the left side of the equations are evaluated using the approximate values of the coordinates in Equations (23.5) through (23.7). The numerical values for Equation (23.21) in units of s/m are

For each zenith angle, a similar observation equation is written, resulting in five equations in total to be added to the adjustment. These observations are only added to demonstrate their inclusion in an adjustment. Readers are reminded that the inclusion of vertical angles into an adjustment is not recommended due to the difficulties in removing the systematic error caused by refraction.
23.4.4 Addition of Observed Azimuths
As discussed in Section 23.7, observed azimuths must be corrected for deflection of the vertical and height of the target. In this example, the azimuth was already given as its geodetic value. Thus, the azimuth was used to fix the adjustment by overweighting. The observation equation for the geodetic azimuth is

In Equation (23.22), the coefficients on the left side are evaluated using the approximate coordinate values using Equation (23.5) through Equation (23.7). The numerical values of Equation (23.22), in units of s/m, are

23.4.5 Addition of Elevation Differences
Leveling is a process of determining heights above the geoid. The data for this example lists the orthometric and geoidal heights for each station. The difference in orthometric heights requires the application of Equation (23.38) to obtain the geodetic height differences between the stations. The observation equation for the elevation difference between stations A and C is
The resulting numerical values for Equation (23.23) are

23.4.6 Adjustment of Control Stations
With the addition of the u coordinate, observation equations similar to those presented in Section 19.2 can be added for each control coordinate. As stated in Section 23.1, the local geodetic coordinate system has its origin at each instrument station. Thus, it is not a true coordinate system with a single origin. Because of this, the approximate coordinates for each station must be stored in either the geocentric or geodetic coordinate system. In this discussion, it is assumed that the values are stored in the geodetic coordinate system. Again, nonlinear versions of the equations must be written to match the overall nonlinear nature of the adjustment. The observation equations are
where (N, E, U) are the given control coordinate values and (n, e, u) are their adjusted values. In the first iteration, the control coordinate values and their adjusted values will be the same. In subsequent iterations, small variations between the control coordinate values and their adjusted counterparts will be observed. The observation equations for Station A in the first iteration are

Since the control coordinate values and approximate station coordinate values will be expressed in terms of geodetic coordinates. The initial K-matrix values given in Equations (23.24) to (23.26) will be expressed as changes in geodetic coordinates. These values must then be transformed into the local geodetic coordinate system. The relationships between changes in the local geodetic coordinate system and the geodetic coordinate system are

In Equation (23.27), M represents the radius in the meridian and N the radius in the normal at a station with latitude φ as given by Equation (23.16), h the geodetic height, and RLG is the transformation matrix. The K-matrix values expressed in terms of geodetic coordinate system can be transformed into K-matrix values of the local geodetic coordinate system using Equation (23.27).
23.4.7 Results of Adjustment
A partial listing of the results of the adjustment from the ADJUST software package are shown in Figure 23.5. The solution converged in two iterations. Note that the latitude and longitude of station A were held fixed as was the azimuth of line AB.


FIGURE 23.5 ADJUST listing of adjustment results for example problem in Figure 23.4.
23.4.8 Updating Geodetic Coordinates
At the completion of each iteration, the corrections of dn, de, and du will be determined for each station in the adjustment. However, geodetic coordinates are used to represent station positions. Thus, after each iteration the local geodetic coordinate system corrections of dn, de, and du must be transformed into changes in the geodetic system using the inverse relationship of Equation (23.27), or

In Equation (23.28), the corrections to the latitude, longitude, and geodetic height of station I are dφi, dλi, and dhi, respectively. All other terms are as previously defined in this chapter. Similarly the uncertainties for each station will be in the local geodetic system. Although these uncertainties can be used to represent northing, easting, and geodetic height errors at each station, Equation (6.13) must be used to transform these uncertainties into the geodetic system as
where

Note that the errors in the coordinates at each station can be computed in using the 3 × 3 block-diagonal elements from the Qxx matrix of the adjustment.
23.5 BUILDING AN ADJUSTMENT
Since this is a nonlinear adjustment, initial approximations are required for all station parameters. Very good initial values for horizontal coordinates can be determined using the procedures outlined in Chapter 16, with horizontal observations reduced to a map projection surface. Following the adjustment, grid coordinates can be converted to their geodetic equivalents. Likewise, orthometric heights of stations can be determined using the procedures discussed in Chapter 12. The resulting orthometric heights can be converted to geodetic heights using Equation (23.37). Since these are initial approximations, it is possible to use an average geoidal height N for the region when applying Equation (23.37). However, this procedure will result in more uncertainty in the resulting derived heights.
Before combining a large set of three-dimensional observations, it is wise to perform adjustments using the horizontal and vertical functional models presented in Chapters 12 and 16 to isolate potential blunders. For large regional data sets, smaller subset of data should be adjusted to isolate blunders. After these smaller data sets are cleaned and adjusted, a combined adjustment can be attempted with better initial approximations for the unknowns and the knowledge that most, if not all, large blunders have been removed from the data sets.
23.6 COMMENTS ON SYSTEMATIC ERRORS
Usually, small local surveys result in systematic error components that are small enough to be considered negligible. However, as the size of the survey increases, variations in the direction of plumb lines must be taken into account. This error can be removed from angular observations prior to the adjustment with a priori knowledge of the deflection components η and ξ at each station. In the United States, modeled values for these components can be obtained using software such as DEFLEC12B,2 which is available from the National Geodetic Survey. The systematic error corrections to the zenith angles, azimuths, and horizontal angles are

where ηi and ξi are the deflection of the vertical components at the observation station I; zij′ is the observed zenith angle from station I to J, and zij the corrected zenith angle between the same stations; Azobs is the observed astronomical azimuth between station I and J, and Azij is the corrected azimuth between the same stations; ∠BIFobs is the observed angle where station B is the back sight station, I the instrument station, and F the foresight station, and ∠BIF is the corrected horizontal angle between the same stations.
Additionally, target height differences must also be considered for both directions and angles. The azimuth of a line corrected for target height is
In Equation (23.33), Azc is the corrected azimuth, α the observed azimuth, ![]() the latitude of the observation station, and h the geodetic height of the target. Since an angle is simply the difference between the foresight and backsight azimuths, the correction to an angle due to height of the targets is
the latitude of the observation station, and h the geodetic height of the target. Since an angle is simply the difference between the foresight and backsight azimuths, the correction to an angle due to height of the targets is

where θC is the corrected angle, θbif the observed angle, and αif and αib the azimuths of the foresight and backsight lines, respectively.
Atmospheric refraction must be considered when including vertical angles in an adjustment. Since the correction for atmospheric refraction is so difficult to model, one can only hope to account for a portion of correction in an adjustment. The remainder of the correction must be modeled in the adjustment, or be absorbed in the residuals of the observation. The correction of the first order effect of refraction can be determined by observing simultaneously vertical/zenith angles at each end of the line IJ. From these observations, the first-order corrected ![]() using these observed reciprocal zenith angles is
using these observed reciprocal zenith angles is
In Equation (23.35), Zij and Zji are the observed simultaneously reciprocal zenith angles and ψ the correction for the deflection of vertical computed as
It is possible to create an adjustment model that includes correction terms for η, ξ, and atmospheric refraction. However, due to the limited number of observations in a typical survey network, there is a danger of overparameterization (Leick, 2004). Thus, it is recommended that these corrections be applied to the angles before carrying out the adjustment.
Unfortunately, to determine the deflection of the vertical components (η and ξ), the latitude and longitude of the station must be known before the completion of the adjustment. Approximate values for latitude and longitude will suffice in most instances. However, in instances where good approximations for the geodetic coordinates are not known, it is possible to correct the original observations after an initial adjustment to ensure that the geodetic coordinates for each station are close to their final values. In this case, after correcting the observations, the adjustment can be run a second time.
A similar problem exists with differential leveling observations. Geodetic height h and orthometric height H differ by the geoidal height N, or
where h is the geometric distance between the ellipsoid and the point, H the distance along the plumb line from the geoid to the point, and N the separation between the ellipsoid and geoid. Equation (23.37) is approximate since the geoid separation differs at the line defined by h and H and since the plumb line is a curved line between the point and the geoid. These differences are small and thus, the approximately equal symbol is replaced with an equal sign generally in Equation (23.37).
Elevation differences as determined by differential leveling must account for the differences in geoidal height between the bench mark stations. This situation can be mathematically described as

The correction to leveled height differences should be performed when these observations are included in the three-dimensional geodetic network adjustment. Values for geoidal height can be determined using software similar to GEOID12B, which is available from the National Geodetic Survey.3 Similar to the deflection of the vertical parameters, it is possible to include geoidal height parameters in the mathematical model of the adjustment. Again, this approach runs a risk of overparameterization in the adjustment.
The orthometric correction OC for a leveling line can be approximated using a formula derived by Bomford (1980) as

where H is the orthometric height at the instrument station, ![]() ″ is the change in latitude between the backsight and foresight stations in units of arc-seconds,
″ is the change in latitude between the backsight and foresight stations in units of arc-seconds, ![]() the latitude of the instrument station, and ρ the conversion from seconds to radians, which is approximately 206,264.8″/radian. Obviously, Equation (23.39) would be tedious to apply for a substantial north–south leveling circuit. However, for most typical surveys involving small regions, this correction can be very small and easily absorbed in the residuals of the adjustment. For instance, a 120-km, north–south leveling line at approximately 42° latitude would result in an approximate orthometric correction of 2 cm.
the latitude of the instrument station, and ρ the conversion from seconds to radians, which is approximately 206,264.8″/radian. Obviously, Equation (23.39) would be tedious to apply for a substantial north–south leveling circuit. However, for most typical surveys involving small regions, this correction can be very small and easily absorbed in the residuals of the adjustment. For instance, a 120-km, north–south leveling line at approximately 42° latitude would result in an approximate orthometric correction of 2 cm.
23.7 SOFTWARE
ADJUST contains an option to adjust three-dimensional geodetic networks. As shown in Figure 23.6, the software allows for the entry of geoidal heights, deflection of the vertical components, and target heights. The help file that accompanies ADJUST describes the file format when these additional features are needed. The data file Example 23-4.dat for the example in Section 23.4 is shown in Figure 23.7 and is on the book's companion website. This file has the geoidal heights added to the file. Notice that the observations are listed in the order of slant distances, horizontal angles, azimuths, altitude angles, horizontal distances, and differences in elevation. In this file, only the observations given in Section 23.4 are listed. For those wishing to program the material in this chapter in a higher-level language, the Mathcad® worksheet X23.xmcd, which is also available on the companion website, demonstrates the procedures necessary for the adjustment.

FIGURE 23.6 ADJUST options for a three-dimensional geodetic network adjustment.

FIGURE 23.7 ADJUST data file for example in Section 23.4.
PROBLEMS
Note: Unless otherwise specified, use the GRS 80 ellipsoidal parameters of a = 6.378.137.0 m and f = 1/298.257222101 for the following problems. Partial answers to problems marked with an asterisk can be found in Appendix H.
- *23.1 Using the data supplied in Figure 23.4, what is the computed value for the slant distance AB?
- 23.2 Same as Problem 23.1, except for slant distance CD.
- *23.3 Using the data supplied in Figure 23.4, what is the computed value for the azimuth AB?
- 23.4 Using the data supplied in Figure 23.4, what is the computed value for azimuth AD?
- *23.5 Using the data supplied in Figure 23.4, what is the computed value for the horizontal angle DAB?
- 23.6 Same as Problem 23.5, except for horizontal angle DCA.
- *23.7 Using the data supplied in Figure 23.4, what is the computed altitude angle value for the vAB?
- 23.8 Same as Problem 23.7, except for the zenith angle vCD.
- *23.9 Develop the observation equation for slant distance AC in Figure 23.4 (5 decimal places).
- 23.10 Same as Problem 23.9, except for slant distance DA.
- *23.11 Develop the observation equation in units of s/m for horizontal angle BAC.
- 23.12 Same as Problem 23.11, except for horizontal angle DCA.
- 23.13 Develop the observation equation for zenith angle AB.
- 23.14 The approximate values for the geodetic coordinates of the endpoints of line AB are A: (41°18′16.2396″ N, 75°46′40.8000″ W, 321.161 m) and B: (41°18′17.7759″ N, 75°47′36.6767″ W, 285.997 m). Using the WGS 84 ellipsoid, determine the computed
- (a) slant distance AB.
- (b) azimuth AB.
- (c) zenith angle AB.
- 23.15 Similar to Problem 23.14, except the approximate values for the geodetic coordinates are A: (43°15′01.8253″ N, 89°46′57.8546″ W, 108.540 m) and B: (43°15′26.8987″ N, 89°46′47.9265″ W, 121.346 m).
- 23.16 Develop the observation equation for slant distance AB in Problem 23.14 if the observed distance is 1301.261 m.
- 23.17 Develop the observation equation if the observed distance in Problem 23.15 is 805.645 m.
- 23.18 Develop the azimuth observation equation in units of s/m for Problem 23.14 if the azimuth observation is 272°05′33″. (Assume that all systematic errors are removed from the observation.)
- 23.19 Develop the azimuth observation equation for Problem 23.15 if the azimuth observation is 16°08′24″. (Assume that all systematic errors are removed from the observation.)
Use the following data and the GRS 80 ellipsoid in Problems 23.19 to 23.27.
Geodetic Coordinates Station Latitude Longitude Height (m) Sn (m) Se (m) Su (m) A 40°25′28.7700″N 86°54′15.0464″W 92.314 0.001 0.001 0.01 B 40°25′46.3978″N 86°54′12.3908″W 80.004 – – 0.01 C 40°25′43.3596″N 86°54′30.5172″W 87.268 – – 0.01 D 40°25′33.6000″N 86°54′28.8000″W 95.585 – – – Angle Observations B I F Angle S (″) hb (m) hi (m) hf (m) D A C 26°18′07.6″ 4.7 1.303 1.295 1.300 C A B 45°35′06.7″ 4.1 1.402 1.405 1.398 B A D 288°06′42.4″ 5.0 1.295 1.301 1.305 A B D 37°50′41.9″ 4.1 1.305 1.398 1.299 D B C 33°13′03.8″ 4.3 1.500 1.500 1.500 C B A 288°56′09.2″ 4.6 1.206 1.210 1.208 B C A 63°20′53.4″ 4.5 1.300 1.300 1.300 A C D 31°21′36.2″ 5.1 1.425 1.423 1.420 D C B 265°17′26.4″ 5.9 1.398 1.205 1.300 C D B 52°04′25.0″ 5.3 1.500 1.500 1.500 B D A 70°15′56.7″ 5.0 1.500 1.500 1.500 A D C 237°39′41.8″ 6.6 1.500 1.400 1.500 Slant Distance Observations From To Distance (m) S (m) hi (m) hr (m) A B 547.433 0.008 1.400 1.500 B C 437.451 0.008 1.497 1.595 C D 303.879 0.008 1.500 1.500 D A 356.813 0.008 1.302 1.296 A C 579.263 0.008 1.300 1.500 B D 552.833 0.008 1.500 1.400 Azimuth Observations From To Azimuth S (″) hi (m) hr (m) A B 6°34′04.6″ 0.001 1.500 1.500 Elevation Differences From To ΔElev (m) S (m) A C −5.053 0.012 B D 13.585 0.012 - 23.20 Use a computational program to develop the coefficient matrix for the angle observations in the table. List all coefficients in units of s/m.
- 23.21 Use a computational program to develop the coefficient matrix for the slant distance observations in the table.
- 23.22 Use a computational program to develop the observation equation for the azimuth observation in the table. List the coefficients in units of s/m.
- 23.23 Use a computational program to develop the observation equations for the elevation differences in the table.
- 23.24 Use ADJUST to determine the most probable values for the geodetic coordinates in accompanying data using only the angle, azimuth, and slant distance observations.
- 23.25 Use ADJUST to determine the most probable values for the geodetic coordinates in the accompanying data using all the observations.
- 23.26 Do Problem 23.25 by removing azimuth AB from the adjustment and overweighting the easting of Station B. The standard deviations of Station B should be Sn = ±1000 m, Se = ±0.001 m, and Su = ±0.01 m.
- 23.27 What are the adjusted orthometric heights of the stations in the accompanying data?
Use the following data and the GRS 80 ellipsoid in Problems 23.28 and 23.29.
Geodetic Coordinates Station Latitude Longitude h (m) Sn Se Su 1 41°07′18.31000″N 76°48′40.85000″W 167.945 0.001 0.001 0.01 2 41°07′13.00000″N 76°47′46.72000″W 167.945 – – – 3 41°05′56.29000″N 76°48′09.94000″W 164.288 – – – 4 41°06′08.68000″N 76°48′51.63000″W 160.935 – – – Slant Distances Occupied Sighted Distance (m) S (m) 1 2 1,273.362 0.0039 2 3 2,427.707 0.0057 3 4 1,045.271 0.0036 4 1 2,162.741 0.0052 1 3 2,631.079 0.0060 2 4 2,496.191 0.0058 Horizontal Angles BS Occ FS Angle S 2 1 4 89°17′35.5″ 1.4″ 4 1 3 337°24′34.0″ 1.4″ 3 2 4 24°27′41.5″ 1.4″ 4 2 1 60°02′16.1″ 1.4″ 4 3 1 52°38′24.0″ 1.5″ 1 3 2 28°47′56.7″ 1.4″ 1 4 2 30°40′12.7″ 1.4″ 2 4 3 74°0′51.8″ 1.5″ Geodetic Azimuths Occupied Sighted Azimuth S 1 4 186°40′45.7″ 1.4″ Elevation Differences From To ΔElev (m) S 1 2 0.000 0.001 2 3 −3.658 0.001 3 4 −3.354 0.001 4 1 7.010 0.001 - 23.28 Develop an observation equation for
- (a) distance 1–2.
- (b) angle 2–1–4.
- (c) azimuth 1–4.
- (d) elevation difference 1–2.
- 23.29 Use ADJUST to determine the most probable geodetic coordinates for the survey.
- *23.30 If ξ = 4.23″ and η = −1.69″ are the deflection of the vertical components at Station A in Section 23.4, what is the correction to the zenith angle going from Station A to B?
- 23.31 If the observed zenith angle along a line with an azimuth of 23°15′36.8″ is 91°04′54″ and the deflection of the vertical components are ξ = −3.28″ and η = 0.96″, what is the corrected zenith angle?
- 23.32 Same as Problem 23.31, except the azimuth of the line is 143°08′23″ and zenith angle is 86°58′23″.
- 23.33 Using the data given in Problem 23.31, what is the deflection of the vertical correction for the azimuth AB?
- 23.34 Using the data given in Problem 23.32, what is the deflection of the vertical correction for the azimuth AB if the latitude of station A is 39°06′38.1648″?
PROGRAMMING PROBLEMS
- 23.35 Develop a computational program that corrects vertical angles for deflection of the vertical components.
- 23.36 Develop a computational program that computes the coefficients for the azimuths, angles, slant distances, and elevation differences. Check your program using data from Problem 23.28 and 23.29.