The next step we'll explore is taking a preliminary building design and doing spatial analysis of the Revit model. You'll see how creating simple schedules of building and room areas can verify program information and start to generate preliminary cost analysis. We'll show you how to verify program data and evaluate a project's initial feasibility.
In this chapter, you'll learn to:
In this chapter we're introducing a scenario that we'll build on in the next several chapters. As this is a Mastering book, we won't go into significant detail about how to perform some of the more basic techniques in Revit, such as how to make simple walls, floors, and roofs. Instead, you'll work from an existing, more developed design and build skills by adding and extracting information to and from this base model. You will move the design from a preliminary level through a set of design documents based on common architectural requirements that occur in a typical project workflow. We will also explore some sustainable design strategies.
The model we'll be using for the next several chapters can be downloaded from the book's companion web page, www.sybex.com/go/masteringrevit2010. Called "The Foundation ch17," it was part of a design competition for a university alumni facility and was created by BNIM Architects. The building is approximately 46,000 square feet and comprises office space, meeting areas, and multipurpose space spread out over three floors. It is located at a major university in the Midwestern United States (see Figures 17.1 and 17.2). Under a leaseback agreement, the building will be owned by its builder rather than the university—hence you will need to calculate rentable area.


We recommend doing a few things to familiarize yourself with this model:
Open the project, and in the Project Browser, choose View


Browse through any sheets that have been set up. Not only will this give you an idea of what the building looks like, but it will also tell you what stage the project is in and what the focus has been so far
In this Foundation model you will find many preestablished 3D views, as well as some sections and generic plan views. Sheets have been started and views placed on those sheets. A structural grid, elevations, and the primary building materials have all been defined. Based on the plans, you can get a clear idea of what the building program is and how the spaces are organized. At this stage in a project workflow, you'll often need to take a short timeout from design work and do some program verification and evaluation, with the goal of creating an initial cost per square foot assessment. To do that, you will first create area plans for the Foundation's total and rentable areas and then create schedules of materials so you can check costs against some square foot assumptions. This is where we'll begin with this model.
For the purpose of program verification, you need to establish how area values are calculated and represented. The simplest method is to use room tags, which can report room area, but you'll quickly see the limitations of that approach. Room tags only report the carpet area of the room and the calculated room surface does not take into account walls. For the feasibility study in this chapter's example, you'll need to create area plans for both total area and rentable area. Then we'll show you how to add areas and area tags manually.
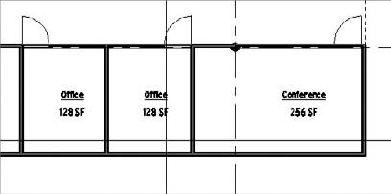
The room tag shown in Figure 17.3 has been placed in the model and is tagging a room. This is used to label the room and its surface. The surface value or the value expressed in square feet (SF) on the room tag is the usable area within the room, sometimes referred to as the carpet area.
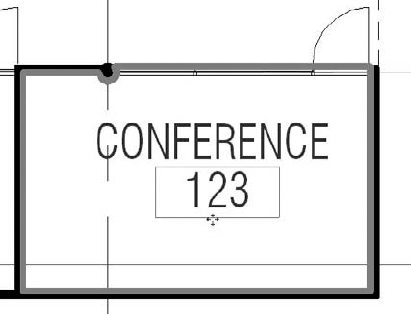
Revit calculates this area by finding all of the entities that touch the floor bounding a space. As you can see from the thick outline of the room in Figure 17.3, it does not include things like the area below the column (at the upper left) or other objects that penetrate the space, giving you a truly usable floor area. Later in this chapter, we will discuss how to schedule those areas so you can report them in a way that they are all visible at the same time.
While this is certainly a useful feature, it does not accommodate calculation of the precise areas you will need to verify your program or perform any cost take-offs.
Area plans are views of the model used to calculate the areas of your model according to various calculation standards. Some of the standards for area calculations are as follows:
- Gross area
This is the overall area of a floor or footprint of the building.
- Rentable area
Different developers and leasing companies have different standards for rentable area. For example, it may include all the spaces in a building except egress corridors, vertical transportation, and mechanical spaces. However, this includes the floor area taken up by columns and some walls.
- Usable area
This area defines only the usable space in a plan. It doesn't count areas taken up by columns, walls, mechanical rooms, and shafts or other unusable space.
- BOMA area
BOMA is the Building Owners and Managers Association. Widely used in the United States by architects, developers, and facilities managers alike, it was created to help standardize office building development. BOMA has its own set of standards for calculating areas. More information on BOMA standards can be found at
www.boma.org.
Revit allows you to choose from two predefined area schemes, or it gives you the option to create your own scheme based on standard area calculation variables.
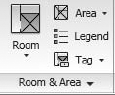
All area- and room-related tools are available on the Home tab (Figure 17.4).
To add or modify the area settings, on the Home tab click the arrow in the Room and Area panel to expand it. From the expanded menu, select Area and Volume Computations. The Area and Volume Computations dialog box shown in Figure 17.5 will appear.

The Computations tab allows you to change how the areas and volumes are calculated in the model. Here you can set how areas are calculated relative to the wall geometry (wall finish versus wall core, for example).
The Area Schemes tab, shown in Figure 17.6, lets you add different schemes to calculate room areas, allowing you to calculate multiple area types.
In the sample Foundation model, you first need to establish the gross area per floor of the building. To do this, begin by adding an area plan to the model.

Take the following steps to begin creating a gross area plan:
Open the 'Foundation ch17' model.
Select the Area button from the Room and Area panel on the Home tab and click Area Plan (see Figure 17.7). This opens the New Area Plan dialog box, where you will select the area scheme, levels, and scale. Select Gross Building from the drop-down menu at the top. Using Shift-click, select the floor plans for Level 1, Level 2, and Level 3. Leave the scale at the default setting, ⅛′ = 1′−0′ (1:100), and click OK. You will then be presented with a dialog box asking you if you would like to 'Automatically create boundary lines associated with external walls and gross building areas?' Click Yes to continue. You'll have to do this once for each floor plan selected.
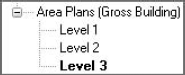
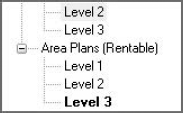
Revit automatically adds a new node called 'Area Plans (Gross Building)' to the Project Browser and adds plans for each level you selected. Open the Level 2 area plan.
In the View window, you'll see a duplicate of the Level 2 plan view you selected. The difference between the original Level 2 and this one is that it has purple lines defining the area boundaries (see Figure 17.8). This might be a challenge to notice in this black and white image, but you will get the idea if you open the project and follow the steps we indicated. These purple lines are placed on the walls according to the type of area plan computation you selected, which in this case was Gross Building Area. You can make manual adjustments to these lines, move them, or delete them if they don't appear where you want them. In our instance, you'll note that Revit didn't draw all of the lines around the building. This is easy enough to remedy. Using the Trim command from the Modify tab, simply trim the remaining lines to complete the area.
Revit has generated Gross Building Area plans for each floor, and you can start adding area tags to get an idea of what your floor areas are for this project. From the Home tab, in the Room and Area panel, expand Tag Room and select Tag Area. You can do that by selecting the area tag is located As you can see, you have about 21,192 square feet (~ 7,000 m2) of area for the first floor.


The area boundaries that Revit applies automatically are not set in stone. Should you need to manually change them and add new boundaries, you can do that using the Area Boundary tool, also available under the Area button. When adding new boundaries, note that they must form closed loops of lines in order for Revit to calculate areas. Any breaks or gaps between the area lines, or lines that don't intersect, will result in Revit returning a "Not Enclosed" value for the area. If you get that message, inspect all your lines, and close gaps using the Trim tool or by extending the boundary lines. It is not possible to add Area Boundary lines to anything but an area plan. That option will be grayed out in all other views.
Now that you have defined the Gross Area and have a good idea of what the floor plate sizes are, you can move on to getting a better understanding of the building program. For the program verification, you need to figure out the rentable area for each of the spaces so you can see how well you fared against the program supplied by the client for this project. Using the same process described earlier for the gross building areas, you can make rentable area plans for the building. Repeating the technique described earlier but selecting the Rentable option, you'll create a new view in the Project Browser: Area Plans (Rentable).
You'll notice that in displaying rentable areas, Revit draws the area boundary on the inside of the exterior walls (unlike with the gross area, where the lines were drawn on the outside of the exterior walls), but it also draws boundaries down the centerline of the interior walls. All of this happens automatically—all that is left for you to do is to verify the lines and make sure you have them where you need them.
For this exercise, you'll want to modify the results slightly from what Revit provides by default. For the program and client on this project, you're not going to calculate core areas (areas around the elevator and stair cores) as part of the rentable area, so you'll need to adjust the area boundary lines around the core walls to reflect this and turn the many spaces into one area.
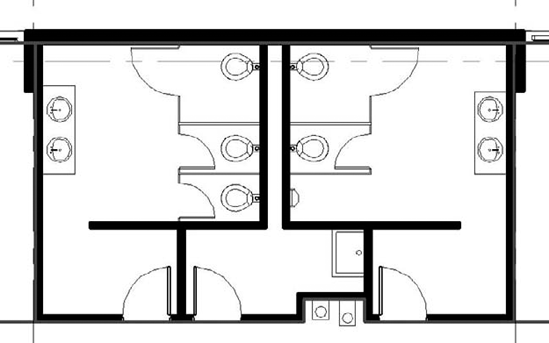
In the case of the restroom core, start by deleting the lines that separate the restrooms from the janitorial closet (see Figure 17.9).

As you delete area lines, you'll more than likely get the warning message shown in Figure 17.10. This message tells you that you have removed the boundary between two areas, and Revit is asking what to do with them. Before answering this question, let's discuss what "areas" means in Revit.

In the context of Revit, areas are elements, just like walls, doors, and furniture. They are selectable, have properties, and can be scheduled. When selected, they will highlight in yellow and appear within the space as a box with an X through it, as shown in Figure 17.11.
Because areas are elements, you can tag them. An area tag reflects the properties of the element it is tagging. The tag itself is only an annotation.
At this point, you might be asking yourself, "Where did those areas come from? I didn't insert them." The answer is that Revit generated them automatically when you created the area plans. This is the essential difference between rooms and areas. By default, when you create a new area plan, it creates an area element within all of the closed area boundaries, so as long as there are no adjustments for you to make, it is only necessary for you to tag and label the areas.
In this case, you needed to make some changes to what Revit provided by default and now have more areas than you have spaces. So let's jump back to the warning dialog box. You've been given two choices: delete all but one of the areas or click OK and accept having multiple areas in the space. Both of these options have viable workflows. If, as in our case, you do not plan to subdivide the room again, you can click Delete Area(s) to delete the extra areas and continue with your work. If you had deleted these lines with the intent of drawing new ones in a different location within this boundary, you could click OK, knowing you would have redundant areas for a short time until you finish this part of the model.
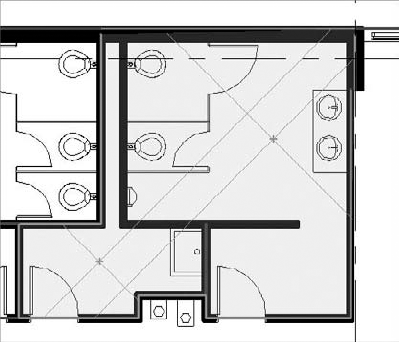
Clicking Delete Area(s) deletes the redundant areas and gives you a single core area for the restrooms shown in Figure 17.12.

Since you don't want to count any of the core areas, you'll need to move the boundary lines from the centerlines of the walls to the inside face of those walls. Because the area boundaries surrounding the restrooms are locked to the walls themselves, you need to delete these lines and redraw them in desired locations. By now, you'll be used to the warning message about redundant areas, and in this case you know that you want to keep the areas and click OK instead of the Delete Area(s) button.
To draw the new area boundary lines, use the Area Boundary Line tool described earlier to add the new area lines to surround the core. If you choose the default Pick option, Revit will automatically choose the line location based on the rules established for that area plan type. Since we specifically want the area lines on the outside of the core, it is best to draw them manually. So, instead of the Pick tool, select the Line tool from the Draw panel on the Place Area Boundary tab. Very quickly, our new core boundary will look like Figure 17.13.


To copy area boundaries between floors, select them and copy them to the clipboard using the following steps.
Select area boundaries using one of the following options:
Ctrl-click each line individually
Highlight one line by mousing over it (don't click) and press the Tab key. This will highlight the chain of all the connected lines, and you can then click to select them

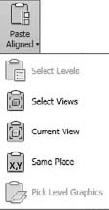
Once the Area Boundaries are selected, you can use Ctrl+C or the Copy command from the Clipboard panel to copy them to the clipboard. Now, choose Paste Aligned from the same panel and from the expanded menu, select the option Select Views (see Figure 17.15) to paste your copied area boundaries directly into the same location on other floors, ensuring consistency in your area calculations.
Now that you have all the areas defined, you can present them by printing the individual views to see graphically how the spaces are assembled (see Figure 17.16).

But what happens if you want to show this information in a tabular, spreadsheet format? Often you'll need to share information of this kind in a table format. Because Revit is based on a bidirectional information model, it can do all of these calculations and update tasks for you in real time. All you need to do is set up a view type in the model that allows you to look at the data in a list format instead of showing the information graphically. For this, use schedules.
Schedules are lists of elements within the model. They enumerate items, including building objects such as walls, doors, and windows; calculate material quantities or areas and volumes; and list the number of sheets, text notes, keynotes, and so on. The ability to dynamically create and update schedules is a core aspect of both BIM and Revit.
Creating schedules of objects, areas, or material quantities in a project is usually one of the most painful (if not boring) but necessary tasks for architects. Needless to say, performing a manual calculation takes a long time and can result in errors. Using CAD tools can partly automate this process, but when it comes to calculating numbers of objects, the calculation can only count the number of blocks that are predefined in a file. In Revit, all elements have information about their physical properties, and you can add information to individual elements. For example, doors can have properties such as size as well as material, color, fire rating, and whether they are exterior or interior.
Revit lets you schedule any element based on properties of the element. In effect, this means that almost anything placed in a Revit model can be scheduled and quantified. Additionally, because the schedule is linked to the objects in the model, you can use the schedule to locate objects within the model or to change their types and properties. This ensures that in any view, regardless of type, the count and properties of all elements are always synchronized. As we often state, the view in which you add or change something doesn't matter; the changes will be reflected in all the views.
If you're unfamiliar with database concepts, don't worry; we'll explain the options in the New Schedule dialog box. The following types of elements can be scheduled:
Areas | Gutters | Rooms |
Casework | Lighting fixtures | Site |
Ceilings | Mass | Slab edges |
Curtain panels | Mass floors | Specialty equipment |
Curtain systems | Mechanical equipment | Stairs |
Curtain wall mullions | Parking | Structural columns |
Doors | Planting | Structural foundations |
Electrical equipment | Plumbing fixtures | Structural framing |
Electrical fixtures | Property line segment | Structural trusses |
Fascias | Property lines | Topography |
Floors | Railings | Wall sweeps |
Furniture | Ramps | Walls |
Furniture systems | Roofs | Windows |
There are also some other schedules you can create that are not limited to specific types of elements:
- Multicategory
This type of schedule is for objects that span across Revit category organization. For example, you may want to create a list of windows and doors in the same schedule. You may also want a schedule showing all the casework and furniture in a project. A multicategory schedule allows you to combine a number of different categories into one schedule. It is also the only way to schedule generic model elements. The one limitation of a multicategory schedule is that you can't schedule host elements (walls, floors, roofs), only their materials and family components.
- Area (gross building)
This schedule lists the gross building areas created with the area plans.
- Areas (rentable)
This type can be created with a rentable plans schedule. Later in this chapter, we'll walk through an exercise demonstrating how to create a simple schedule showing the program areas we created in our area plans.
Although we've listed quite a few, we haven't included all the schedules available in Revit. There are still a few more worth mentioning. These schedules can be accessed only from the View tab. To see them, expand the Schedules button on the Create tab.

- Material take-off
This type of schedule can list all the materials and subcomponents of any Revit family and allow an enhanced level of detail for each assembly. You can use a material take-off to schedule any material that is placed in a component. For example, you might want to know the cubic yardage of concrete within the model. Regardless of whether the concrete is in a wall or floor or column, you can tell the schedule to report the total amount of that material in the project. As we will show later, you can use this schedule type to make some preliminary calculations regarding the use of recycled materials in the project to support sustainable design goals.
- Drawing list
This schedule shows a list of all the sheets in the project, sorted alphabetically.
- Note block
This schedule lists the notes that are applied to elements and assemblies in your project. You can also use a note block to list the annotation symbols (centerlines, north arrows) used in a project.
- View list
This schedule shows a list of all the views and their properties in the Project Browser.
These schedules are separated from the main list of schedules because they aren't commonly used in building documentation. They are primarily for data coordination that happens outside the project documentation.

The process of creating a new area schedule is best demonstrated with an example. Take the following steps to create a new rentable area schedule for the Foundation model:
Open the
Foundation.rvtfile from the book's companion web page (www.sybex.com/go/masteringrevit2010).Navigate to the View tab, and click Schedules
Choose Areas (Rentable) from the Category area, name the schedule Rentable Area Schedule, and confirm by clicking OK.
You will see a series of tabs that allow you to specify the schedule's graphic appearance and choose exactly what data you would like to show. Figure 17.17 shows the dialog box for the rentable area schedule. As each grouping of elements within Revit is unique, the list of possible schedule values changes accordingly.

Each tab controls different ways to sort and view the data within a schedule. Here is a basic explanation of their functions:
- Fields
The Fields tab lets you select the data that will appear in your schedule. For the wall schedule, it shows all the properties available in the wall family.
- Filter
On the Filter tab, you can filter out the data you don't wish to show. You'll use this tab, for example, to restrict displayed data so that only information about the concrete walls in the project appears in the schedule.
- Sorting/Grouping
This tab lets you control the order in which information is displayed. You can also decide whether you want to show every instance of an item or only the totals for a given family.
- Formatting
The Formatting tab controls the display heading for each field and whether the field is visible on the schedule. It's possible to add fields that are necessary for calculations or sorting but don't show on the printed copy of the schedule. Additionally, this tab can tell Revit to calculate the totals for certain fields.
- Appearance
The Appearance tab controls the graphical aspects of the schedule, including the font size and type of text for each of the columns and headers in the schedule. It also allows you to turn the grids on and off or modify the line thickness for the grid and boundary lines.
The following example walks through the different options in the New Schedule dialog box while you create a new wall schedule.
In this example, you'll create the schedule, filter out all but the concrete walls, and calculate the volume of recycled content in the walls based on the assumption that you're using 15 percent recycled content in all the concrete you pour on this project.
For your schedule, choose the following fields from the Fields tab and sort them in this order:
Level
Name
Area
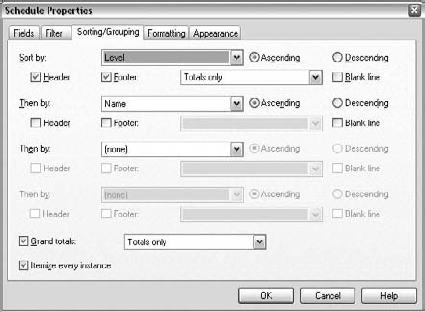
Select the Sorting/Grouping tab to give the schedule some parameters to sort by. First, sort by level, so you can see which floors you have the areas on, and then sort by area name. You will also want to see a total of the areas by floor, so include a footer showing totals only for the levels. Also check the Header check box so you can tell which floor you're on in each grouping. Finally, you'll want to see a grand total of all the areas in the building. Your dialog box should look like Figure 17.18.
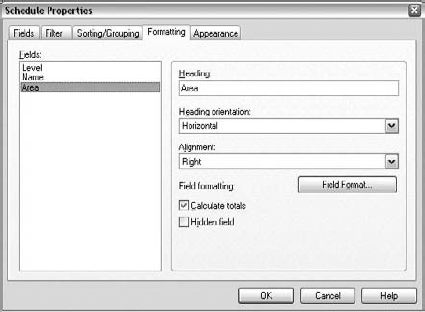
Select the Formatting tab, as you'll also want to make a couple of changes here. Select the Level parameter and select the Hidden Field check box. You don't need to see a level heading for each item in the list, especially since you have one established already as a header for each floor. You'll also want to select the Area field and make two changes: first, right-justify the areas so they align properly, and then check the box to have the schedule calculate totals, as shown in Figure 17.19.
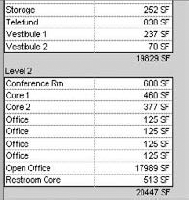
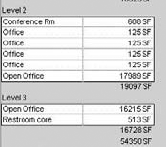
Clicking OK at this point will give you a schedule broken out by level and totaling each floor's areas. Your schedule should look something like Figure 17.20.
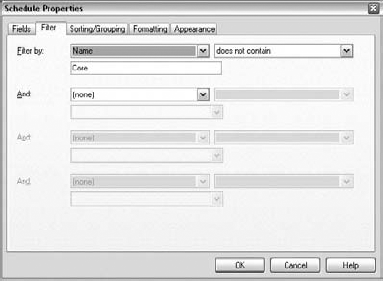
For areas, you are concerned only with the rentable spaces and don't need to see how much area the cores take up in the building. By right-clicking on the schedule, you can view its properties and make some modifications. Choose the Filter tab this time, filter out any name that does not contain the word Core (with a capital C), as shown in Figure 17.21, and click OK.
Pan down to the bottom of the list and you will notice that you still have the name Restroom core in the list (see Figure 17.22).
The name Restroom core is still in the list because the filter and fields in the schedules and families within Revit are case-sensitive. The fields need to match exactly. However, there is an easy fix. By clicking within the cell itself, as you would do in Excel, you can modify the word core so it has a capital C and the name will then be filtered from the list. The finished schedule should look like Figure 17.23.

Now that you've created the schedule for the program, you need to put it on a sheet. As you've figured out by now, schedules work like any other view: to place the schedule on a sheet, drag and drop it from the Project Browser onto the sheet you wish to place it on. One of the nice things about schedules is that you can actually place them on multiple sheets and they will always provide the most current information.
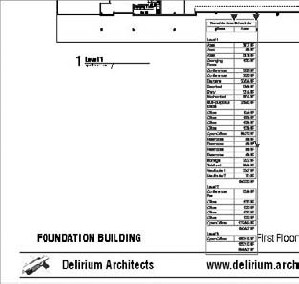
We want to create a set of sheets you could provide to the client that demonstrates the program for each floor in both graphic and list format. When finished, you should have an 11×17 presentation sheet that looks like Figure 17.24, with a floor plan and schedule for each floor.
Expand the sheets in the Project Browser and find the sheet 01 – First Floor Program.
Expand the rentable area plans and drag and drop the Level 1 Rentable Plan onto the sheet.
You will notice that the plan is much larger than the sheet, since we made the area plan at 1/8″ scale originally. Right-click on the plan and choose Activate View from the context menu. In this view, you want to do two things: change the scale, and turn off some of the unnecessary annotations. So, first, adjust the scale of the drawing to be 1/16″ = 1′−0″ (1:200). Second, open the Visibility Graphics dialog box (by typing VG or choosing the View tab and in the Graphics panel, clicking Visibility/Graphics). On the Annotations tab in the Visibility/Graphic Overrides dialog box, turn off visibility for the following categories:
Elevation tags
Grids
Reference planes
Section tags
Once the view is resized and the display reconfigured, place the plan at the upper portion of the sheet.
Drag and drop the rentable area schedule onto the same sheet. When it first appears, it will look something like Figure 17.25. You'll need to do a bit of rearranging to get the schedule to fit the sheet properly.

Now, there are two different ways to modify the shape of the schedule directly from the sheet. The first one way is by dragging the triangles that appear on the upper portion of the schedule header. Note that there is one blue triangle for each column. By dragging the triangle left or right, you can resize the width of each column. You will notice some of our longer room names have wrapped to the next line. Grab the left triangle and drag it to the right to lengthen the Name field. Note that this also shortens the schedule by removing the wrapped lines.

To most clients, building areas are a critical part of the development pro forma. (The pro forma is a document, typically a spreadsheet, that outlines the financial goals of the project or development.) In practice, you will create area plans that coincide with how the owner needs areas computed for its calculations. You keep these in a schedule, allowing owners to make regular updates to the building areas so they can compare them to the current pro forma. Since you can keep the schedules dynamically updated, you can set this up once and know that the areas will always be up to date.
Now that you've generated a schedule of spaces, let's look at some of the other advantages of using schedules in the design process. Since Revit is a parametric modeler, all parameters are linked to elements within the model. You might notice that at the top of your schedule, the label is simply labeled Area. This is easy to change.

If we were not using BIM as a modeler, it would become tedious to locate these areas so they could be properly labeled. In Revit, there are two ways to rename these spaces. First, if you know what the areas are supposed to be, you can either type the name in or select it from the list of already used names. However, what happens when you need to locate the room on the plan before making changes to it? This is easy to do within Revit. By selecting the area name in the schedule, you'll get useful tools in the Quantities tab of the Modify Schedule tab.


Figure 17.26. Use the Highlight in Model option to point to the location of elements highlighted in the schedule.
This is a powerful tool because it can be used to locate any of the elements within the Revit model directly from any schedule. Not only do Revit schedules report information about elements in the project, but they can also be used to control elements. If you decide to exchange one wall type for another, you can do so by clicking in the schedule—under wall types, for example. A drop-down menu appears, listing all available types currently in the model, so you can choose the type you want. Again, this automatically changes the instance of the wall to another wall type in all views in which the wall is present.
At this stage, we're still in preliminary design for this project, and have not gone through the rigor of cost estimating the project yet. Nonetheless, you can use some of the scheduling tools to help calculate a rough cost of the building based on a cost per square foot assessment. The disclaimer here is that Revit is not a cost-estimating package. It is a database that can count, total, and tally the number of items, areas, or other properties within the model. Cost estimating itself is part counting and part experience; we can work on the counting part with the BIM model.
Since you already created gross area plans earlier, go ahead and create a new schedule to analyze the area plans to create a rudimentary cost estimate based on the building square footage. This time, only include the Level and Area fields in the Fields tab. Next, add a parameter for cost. That parameter is not a standard property of the areas, so you'll need to add it to the list. Here's how to do that.
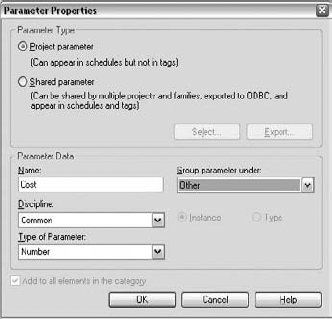

In our example, we want Revit to calculate a total cost for the project based on a cost per square foot we consider close to accurate based on previous experience.
For our Type setting we made the type a Number. In Revit, you need to make sure the types of fields are compatible so you are not multiplying length times something like material. Also, as we mentioned before, the fields are case-sensitive. In the formula line, you will need to type Area * Cost to get the total project cost. Click OK to exit the dialog box.
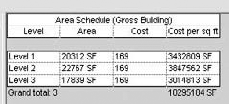
Finally, on the Sorting tab, check the box for Grand Totals, and on the Formatting tab, highlight the Cost per Sq Ft field you just created and check the box to calculate totals. Once you enter an estimated cost of $169.00 for each floor, the final schedule will look like Figure 17.29.
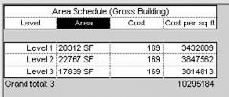
Now you have a constantly updated area of each floor of the building multiplied by our estimated cost per square foot for a continuously accurate total, based on those metrics. However, the costs are being reported as SF values and not dollar amounts. You can fix that problem using the Schedule Properties dialog box.
When you create a new schedule, you're presented with a number of format and selection options on the Appearance tab of the Schedule Properties dialog box. These let you set the font style and text alignment and decide how to organize and filter the data for display in the schedule. Let's explore the options in the Schedule Properties dialog box.
On the Appearance tab (see Figure 17.30), you'll see the options to change the font styles, gridline visibility, and other variables for header and body text of the schedule.

However, the change you need to make to the appearance of the data in the schedule is found on the Formatting tab of Schedule Properties dialog box. For our purposes in our cost per square foot schedule, select Cost per Sq Ft and make the following adjustments:
Change the alignment to right justified, which is conventional for money totals.


You also have the ability to add headers to your schedule. By selecting the Headers check box, you can group them under another title.
Select Level and Area by clicking in one of them and dragging the mouse to the other one (see Figure 17.32). They will show as highlighted. While Level does not look selected, it currently is.
Doing this activates some of the different tools on the Schedule panel on the Modify Schedule/Quantities tab. You'll now have the option to group (or ungroup) these headers. Choose the Group button.

You now have a header that spans the two headers selected, and we can add some more descriptive information to help clarify the schedule. In this example, we have added the text "Preliminary Design Plan" to the header (see Figure 17.33).

When you are creating a schedule of elements that need naming and you click on any name in the schedule (as example open the Gross Area BOMA schedule) you will notice three new options on the Modify Schedule/Quantities tab.

The three options are as follows:
- Show
In the room schedule, includes rooms that are not placed or enclosed in the building model. Those rooms will be marked as Not Placed in the schedule and the model.
- Hide
Filters the schedule so that it only includes rooms that are placed or enclosed in the building model.
- Isolate
Filters the schedule to list only rooms that are not placed or enclosed in the building model.
- Quantify your preliminary designs.
Once your plans are established, create your own area plans to dynamically track changes in the project.
- Master It
Establish your preliminary design, and then create area plans so you can keep up to date with space sizes, allocations, and your project program.
- Create schedules.
One of the benefits of Revit is the ability to manage not only your drawings, but also other information about the project. Create schedules for your project templates to manage the materials within the project.
- Master It
Schedules have a multitude of uses and value at all levels of the project. Explore a variety of schedules to optimize your workflow and maximize what you can get from the model.
- Use schedules for preliminary cost estimates.
Create a schedule that tracks project costs based on an estimated cost per square foot.
- Master It
Many developers and facilities managers use BOMA calculations for figuring rentable area, gross area, and R/U (rentable/usable) ratios. Establishing area plans and schedules can help you find these numbers much quicker than a legacy CAD system would have allowed.