
12. Fine-tune the Project plan
In this chapter
![]() Examine resource allocations over time
Examine resource allocations over time
![]() Resolve resource overallocations manually
Resolve resource overallocations manually
![]() Check the plan’s cost and finish date
Check the plan’s cost and finish date
![]() Inactivate tasks (Project Professional only)
Inactivate tasks (Project Professional only)
Practice files
For this chapter, use the FineTunePlan practice file from the Project2016SBSCh12 folder. For practice file download instructions, see the introduction.
In the previous three chapters, we focused on details about tasks, resources, and assignments. Now, we will dive deeper into optimizing resource assignments. In some cases, we’ll revisit Project features introduced in previous chapters. In this chapter, however, the focus is on managing across the entire plan—including overall duration and cost.
This chapter guides you through procedures related to examining resource allocations over time, resolving resource overallocations manually, leveling overallocated resources, checking the plan’s cost and finish date, and inactivating tasks (Project Professional only).
Examine resource allocations over time
In this topic, we focus on resource allocation—how assignments affect the workloads of the work resources (people and equipment).
Recall from Chapter 5, “Set up resources,” that a resource’s capacity to work is measured in units; the maximum capacity of a particular resource is called maximum units (labeled Max Units in Project). Units are measured either as a percentage (such as 300% units) or as numbers (such as three units).
A resource’s capacity to work in a specific time period is determined by that resource’s maximum units and resource calendar. The relationship between a resource’s capacity and that person’s task assignments is called allocation. At any specific time, a work resource may be:
![]() Underallocated The resource’s assignments do not fill the resource’s maximum capacity to do work. For example, a full-time resource who has only 25 hours of work assigned in a 40-hour workweek is underallocated.
Underallocated The resource’s assignments do not fill the resource’s maximum capacity to do work. For example, a full-time resource who has only 25 hours of work assigned in a 40-hour workweek is underallocated.
![]() Fully allocated The resource’s assignments fill the resource’s maximum capacity. For example, a full-time resource who has 40 hours of work assigned in a 40-hour workweek is fully allocated.
Fully allocated The resource’s assignments fill the resource’s maximum capacity. For example, a full-time resource who has 40 hours of work assigned in a 40-hour workweek is fully allocated.
![]() Overallocated The resource’s assignments exceed the resource’s maximum capacity to do work. For example, a full-time resource who has 65 hours of work assigned in a 40-hour workweek is overallocated.
Overallocated The resource’s assignments exceed the resource’s maximum capacity to do work. For example, a full-time resource who has 65 hours of work assigned in a 40-hour workweek is overallocated.
These states of allocation apply to work resources. Cost and material resources do no work; therefore, their assignments are not subject to allocation issues.
Project includes several views and features that can help you focus on resource allocation. By using these views and features, you can do the following:
![]() Set the timeframe threshold (such as daily or weekly) at which Project evaluates a resource as overallocated or not. You do so in the Resource Leveling dialog box, which is introduced in the “Level overallocated resources” topic later in this chapter.
Set the timeframe threshold (such as daily or weekly) at which Project evaluates a resource as overallocated or not. You do so in the Resource Leveling dialog box, which is introduced in the “Level overallocated resources” topic later in this chapter.
![]() See overallocation indicators next to the names of overallocated resources, or the tasks to which overallocated resources are assigned. Point to any overallocation indicator to display more details in a ScreenTip.
See overallocation indicators next to the names of overallocated resources, or the tasks to which overallocated resources are assigned. Point to any overallocation indicator to display more details in a ScreenTip.
![]() Use the Resource Graph to see allocations for each resource graphed against a timescale.
Use the Resource Graph to see allocations for each resource graphed against a timescale.
![]() Display the Overallocated Resources report to see the work details of overallocated resources.
Display the Overallocated Resources report to see the work details of overallocated resources.
![]() Project Professional users can use the Team Planner view to see assignments per resource in a simpler format. For more information about the Team Planner view, see Chapter 11, “Fine-tune resource and assignment details.”
Project Professional users can use the Team Planner view to see assignments per resource in a simpler format. For more information about the Team Planner view, see Chapter 11, “Fine-tune resource and assignment details.”
![]() Switch to the Resource Usage view. For more information about this view, see Chapter 11, “Fine-tune resource and assignment details” and later in this chapter.
Switch to the Resource Usage view. For more information about this view, see Chapter 11, “Fine-tune resource and assignment details” and later in this chapter.
![]() Display the Resource Allocation view. This is a combination view that includes the Resource Usage view in the top pane and the Leveling Gantt view in the lower pane. We’ll focus on this view in this topic.
Display the Resource Allocation view. This is a combination view that includes the Resource Usage view in the top pane and the Leveling Gantt view in the lower pane. We’ll focus on this view in this topic.
In the Resource Allocation combination view, the details in the lower view are specific to the selected item in the top view (a resource or assignment, in this example). Let’s take a closer look at the parts of this combination view.

In this Resource Allocation view example, the resource assignments are collapsed (hidden) below the resource names
On the left side of the Resource Usage view is a table (the Usage table, by default). This table shows assignments grouped per resource, the total work assigned to each resource, and each assignment’s work. This information is organized into an outline that you can expand or collapse.
The right side of the view contains details (work, by default) arranged on a timescale. You can horizontally scroll the timescale to see different time periods. You can also change the tiers on the timescale to display data in units of weeks, days, hours, minutes, and seconds.
In the lower pane, the Leveling Gantt view shows the Gantt bars and any slack of the tasks to which the selected resource is assigned. Slack is represented as a thin line following the Gantt bar. When a single assignment is selected, the Leveling Gantt view shows the Gantt details of the specific assignment’s task.
Both panes of the Resource Allocation view are synchronized to the same timescale at the top of the view. Because the view shows each resource’s assigned work per time period, it’s easy to pinpoint when underallocations or overallocations occur. Also, you can directly edit assignment values in the view to address allocation problems.
Here are a few other things to keep in mind when examining resource allocations in the Resource Usage view:
![]() A quick way to navigate to resource overallocations in the Resource Usage view is to use the Next Overallocation button in the Level group of the Resources tab. The Next Overallocation button works in a similar way in Gantt chart, Task Usage, and Calendar views.
A quick way to navigate to resource overallocations in the Resource Usage view is to use the Next Overallocation button in the Level group of the Resources tab. The Next Overallocation button works in a similar way in Gantt chart, Task Usage, and Calendar views.
![]() By default, the Resource Usage view displays the Usage table; however, you can display a different table by selecting it from the Table list that is available on the View tab, in the Data group.
By default, the Resource Usage view displays the Usage table; however, you can display a different table by selecting it from the Table list that is available on the View tab, in the Data group.
![]() By default, the Resource Usage view displays work values in the timescaled grid. However, you can display additional assignment values, such as cost and remaining availability, by selecting another value from the Details group on the Format tab.
By default, the Resource Usage view displays work values in the timescaled grid. However, you can display additional assignment values, such as cost and remaining availability, by selecting another value from the Details group on the Format tab.
To find overallocations in the Resource Allocation view
1. On the View tab, in the Resource Views group, click Resource Allocation to display the Resource Allocation view.
![]() Tip
Tip
The Resource Allocation view is a split view. To hide the bottom pane, clear the Details check box on the View tab. The Resource Usage view will remain visible.
2. Click anywhere in the Resource Usage view.
3. On the View tab, in the Data group, in the Filter box, select Overallocated Resources to filter the view to show only overallocated resources.
![]() Tip
Tip
To clear the filter, click No Filter.
4. If the selected resource’s work values are not visible in the timescaled grid on the right side of the view, on the Task tab, in the Editing group, click Scroll to Task.
5. To show the assignments of the selected resource, click the expand/collapse arrow next to the resource’s name.
![]() Tip
Tip
Set the timescale to the time setting that makes the most sense for your organization or the specific overallocated resource. This is likely to be daily or weekly. You can change the timeframe by clicking the one you want in the Timescale box on the View tab, in the Zoom group.
To see allocations for each resource graphed against a timescale
1. On the View tab, in the Resource Views group, click Other Views, and then click Resource Graph.
2. Use the arrow keys or the horizontal scroll bar to switch between resources in this view.
To see work details of overallocated resources in the Overallocated Resources report
1. On the Report tab, in the View Reports group, click Resources, and then click Overallocated Resources.
Resolve resource overallocations manually
In this topic and the next, we continue to focus on resource allocation—how assignments affect the workloads of the work resources in the plan. This topic focuses on manually editing assignments to resolve resource overallocations. The next topic focuses on automatically resolving resource overallocations.
A great view for editing resource assignment values is the Resource Usage view (either by itself or in the upper pane of the combination Resource Allocation view, described in the previous topic).
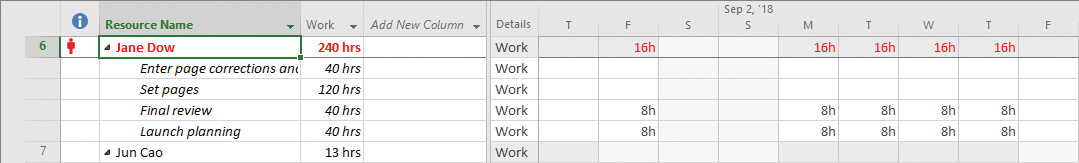
In the Resource Usage view, overallocated resources (and their assignments) are easy to spot
In this view, the names of overallocated resources appear in red. You can horizontally scroll the view to find overallocations. Some might be minor (for example, 42 hours in a 40-hour workweek), whereas others might be severe enough to require more attention.
You directly edit the assigned work values per time period in the right side of the view for the assignments you want. As you do so, the resource’s total work per time period is updated.
Rather than editing assignment values, you can delay the start of a task that is causing a resource overallocation. Because delaying the start of a task is one technique used by automatic leveling (described in the next section), the delay is referred to as a leveling delay.
Editing an assignment or task manually is just one way to resolve a resource overallocation. Other solutions in task-centric views such as a Gantt chart view include the following:
![]() Replace the overallocated resource with another resource by clicking the Replace button in the Assign Resources dialog box (available from the Resource tab).
Replace the overallocated resource with another resource by clicking the Replace button in the Assign Resources dialog box (available from the Resource tab).
![]() Reduce the value in the Units field in the Assignment Information or Assign Resources dialog box.
Reduce the value in the Units field in the Assignment Information or Assign Resources dialog box.
![]() Assign an additional resource to the task so that both resources share the work.
Assign an additional resource to the task so that both resources share the work.
1. On the View tab, in the Resource Views group, click Resource Usage to display the Resource Usage view.
2. Locate the overallocated resource you want to focus on (an overallocated resource’s name is formatted in red).
3. In the timescaled grid, locate the resource’s overallocation you want to resolve.
4. If the resource’s assignments are not visible, click the expand/collapse arrow next to the resource’s name to show that resource’s assignments.
![]() Tip
Tip
You also can expand the outline by pressing Alt+Shift+Plus sign.
5. Edit the work values in the timescaled grid to resolve the overallocation.
To manually add leveling delay
This technique delays the start of a task to resolve an overallocation but does not change the amount of work on the assignment.
1. On the View tab, in the Resource Views group, click Other Views, click More Views, and then click Resource Allocation to display the Resource Allocation view.
2. In the upper pane of the view, select an overallocated resource.
3. In the lower pane, identify the overlapping assignments that are causing the overallocation. The overallocated resource indicator appears next to these task names.
4. Enter a delay in the start of one of the tasks in the Leveling Delay field. The time value you enter is an elapsed value, not a working time value. The task’s start date is adjusted. Note that any other resources assigned to the same task are also delayed, whether they were overallocated or not.
Level overallocated resources
The previous topics described resource allocation and how to resolve overallocations manually. This topic introduces the resource leveling feature in Project.
Resource leveling is the process of delaying or splitting a resource’s work on a task to resolve an overallocation. For example, consider the same full-time resource assigned to three tasks. On day 1, the resource is fully allocated at 100%. On day 2, the resource is overallocated at 300%. On day 3, she is again overallocated, this time at 200%.

In this split view, the Resource Graph view below the Gantt Chart view clearly shows that the resource is overallocated
If you perform resource leveling, Project delays the start dates of the second and third tasks so that the resource is not overallocated.

Leveling the resource has addressed the overallocation
In this example, the finish date of the latest scheduled task moved from day 2 to day 6. This is common with resource leveling, which often pushes out the plan’s finish date. There was a total of six days of work before leveling, but two of those days overlapped, causing the resource to be overallocated on those days. After leveling, all six days of work are still there, but the resource is no longer overallocated.
![]() Tip
Tip
Although the effects of resource leveling on a schedule might be significant, resource leveling does not change who is assigned to tasks or the total work or assignment unit values of those assignments.
You can adjust resource leveling options to control how you want Project to resolve resource overallocations. Project will apply your settings to resolve overallocations when you choose to level resources. Depending on the options you choose, this might involve delaying the start date of an assignment or task, or splitting the work on the task.
Resource leveling is a powerful tool, but it accomplishes only a few basic things: it delays tasks, splits tasks, and delays resource assignments. It does this by following a fairly complex set of rules and options that you specify in the Resource Leveling dialog box.
Resource leveling is a great fine-tuning tool, but it cannot replace your good judgment about resource availability, task durations, relationships, and constraints. Resource leveling works with all this information as it is entered into your plan, but it might not be possible to fully resolve all resource overallocations within the timeframe you want unless you change some of the basic task and resource values in the plan. Additional remedies might include reducing the overall scope of work or adding additional resources.
![]() Tip
Tip
To learn more about resource leveling, enter Level resource assignments in the Tell Me box located above the ribbon, and then click Get Help On.
As mentioned earlier, the Resource Leveling dialog box is where you tell Project how you want it to resolve resource overallocations.

Set the leveling options you want in the Resource Leveling dialog box
If you are using Project Professional rather than Project Standard, the Resource Leveling dialog box and some other dialog boxes contain additional options relating to Project Server. (In the Project Professional version of the Resource Leveling dialog box, the Level Resources With The Proposed Booking Type check box is a Project Server–related option.) Throughout this book, we won’t use Project Server, so you can ignore these options for now. For more information about Project Server, see Appendix C, “Collaborate: Project, SharePoint, and PWA.”
Most of the options in this dialog box are described in Project Help, but let’s look more closely at a few options that deserve some additional explanation:
![]() The Leveling Calculations group includes some important options:
The Leveling Calculations group includes some important options:
• Selecting Automatic sets Project to level resources constantly. Automatic leveling occurs as soon as a resource becomes overallocated.
• Selecting Manual sets Project to level resources only when you tell it to do so. This is the default setting.
![]() Important
Important
All settings in the Resource Leveling dialog box apply to all plans that you work with in Project, not only to the active plan. Using automatic leveling might sound tempting, but it will cause frequent adjustments to plans whether you want them or not. For this reason, we recommend that you use the Manual setting.
• The selection you make in Look For Overallocations On A <Timeframe> Basis determines the timeframe Project will use when evaluating whether a resource is overallocated. If a resource is overallocated, the resource’s name is formatted in red, and Project also shows the Overallocated indicator next to the resource’s name.
![]() Tip
Tip
On most projects, leveling in finer detail than day by day can result in unrealistically precise adjustments to assignments. If you prefer not to see overallocation indicators for day-by-day overallocations, select Week By Week in the Look For Overallocations On A <Timeframe> Basis box. Doing so will not level resources, but it will determine when Project displays overallocation indicators next to resource names.
• Selecting the Clear Leveling Values Before Leveling check box removes any existing leveling delays from all tasks and assignments before leveling. This applies regardless of the source of the leveling delays—that is, whether they were entered manually (see the previous topic) or automatically by prior leveling.
![]() The Leveling Order settings let you control the priority that Project uses to determine which tasks it should delay to resolve a resource conflict:
The Leveling Order settings let you control the priority that Project uses to determine which tasks it should delay to resolve a resource conflict:
• Selecting the ID Only option delays tasks only according to their ID numbers: numerically higher ID numbers will be delayed before numerically lower ID numbers (for example, task 10 will be delayed before task 5). You might want to use this option when your plan has no task relationships or constraints.
• Selecting the Standard option delays tasks according to predecessor relationships, start dates, task constraints, slack, priority, and IDs.
• Selecting the Priority, Standard option tells Project to look at the task priority value before the other standard criteria. (Task priority is a numeric ranking between 0 and 1000 that indicates the task’s appropriateness for leveling. Tasks with the lowest priority are delayed or split first.)
After you set the leveling options that you want in the Resource Leveling dialog box, you can level the plan immediately or later via the Level All button (on the Resource tab). You don’t need to return to the Resource Leveling dialog box unless you want to change leveling options. The on-demand leveling options are located on the Resource tab, in the Level group.
A good view for seeing the plan before and after leveling is the Leveling Gantt view.

The Leveling Gantt view is a great view in which to see the before-and-after results of leveling
In this view, each task has two bars. The top bar represents the pre-leveled task. You can see a task’s pre-leveled start, finish, and duration by pointing to a light tan–colored bar. The bottom bar represents the leveled task as it’s now scheduled.
To set leveling options and level resources
1. On the Resource tab, in the Level group, click Leveling Options to open the Resource Leveling dialog box.
2. In the Resource Leveling dialog box, select the options you want.
3. Do either of the following:
• To level resources now by using the options you’ve set, click Level All.
• To save these options but delay leveling resources until later, click OK.
To level resources by using the current Resource Leveling dialog box options
1. On the Resource tab, in the Level group, do one of the following:
• Click Level Selection to level resources assigned to the selected tasks.
• Click Level Resource to level the selected resource only.
• Click Level All to level all resources in the plan.
You can remove leveling delays for the entire plan or for selected tasks.
1. On the Resource tab, in the Level group, click Clear Leveling, and then select the options you want.
To display the Leveling Gantt view
1. On the View tab, in the Task Views group, click the Gantt Chart arrow, and then click More Views.
2. In the More Views dialog box, click Leveling Gantt, and then click Apply. Project switches to the Leveling Gantt view.
Check the plan’s cost and finish date
Not all plans include cost information, but for those that do, keeping track of project costs might be as important as, or more important than, keeping track of the scheduled finish date. In this topic, we examine both the cost and the finish date of the plan.
Two factors to consider when examining project costs are the specific types of costs you want to see and how you can best see them. The types of costs that you might encounter over the life of a project include the following:
![]() Baseline costs The original planned task, resource, or assignment costs that were saved as part of a baseline plan.
Baseline costs The original planned task, resource, or assignment costs that were saved as part of a baseline plan.
![]() Current (or scheduled) costs The calculated costs of tasks, resources, and assignments in a plan. As you make adjustments in a plan, such as assigning or removing resources, Project recalculates current costs much like it recalculates task start and finish dates. After you start to incur actual costs (typically by tracking actual work), the current cost equals the actual cost plus the remaining cost per task, resource, or assignment. Current costs are the values you see in the fields labeled Cost or Total Cost.
Current (or scheduled) costs The calculated costs of tasks, resources, and assignments in a plan. As you make adjustments in a plan, such as assigning or removing resources, Project recalculates current costs much like it recalculates task start and finish dates. After you start to incur actual costs (typically by tracking actual work), the current cost equals the actual cost plus the remaining cost per task, resource, or assignment. Current costs are the values you see in the fields labeled Cost or Total Cost.
![]() Actual costs The costs that have been incurred for tasks, resources, or assignments.
Actual costs The costs that have been incurred for tasks, resources, or assignments.
![]() Remaining costs The difference between the currently scheduled costs and the actual costs for tasks, resources, or assignments.
Remaining costs The difference between the currently scheduled costs and the actual costs for tasks, resources, or assignments.
You might need to compare these costs (for example, baseline versus actual) or examine them individually per task, resource, or assignment. Or you might need to examine cost values for summary tasks or for an entire plan. Some common ways to view these types of costs include the following:
![]() See the plan’s cost values in the Project Statistics dialog box.
See the plan’s cost values in the Project Statistics dialog box.
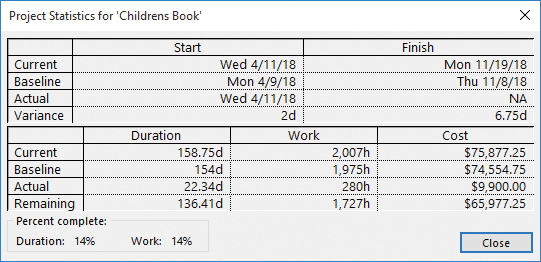
Use the Project Statistics dialog box for an at-a-glance view of essential cost and schedule values
In the Project Statistics dialog box, you can see the plan’s four total cost values: Current, Baseline, Actual, and Remaining.
![]() See or print reports that include cash flow, budget, cost overruns for both tasks and resources, and earned value.
See or print reports that include cash flow, budget, cost overruns for both tasks and resources, and earned value.

Reports such as the Cost Overruns report present Project data in compelling layouts
![]() See task-level, resource-level, or assignment-level cost information by displaying the Cost table.
See task-level, resource-level, or assignment-level cost information by displaying the Cost table.

Displaying the Cost table (shown here in the Task Sheet view) is a great way to see cost details
Here you can see many types of cost values for the overall plan (the total cost of the project summary task, which is task 0), project phases (summary tasks), and individual tasks.
![]() See cost details distributed over time in a usage view.
See cost details distributed over time in a usage view.

Display the Cost table and Cost detail in the Task Usage view to see the most granular cost values
In addition to cost, the finish date is a critical (often the most critical) measure of a plan. A plan’s finish date is a function of its duration and its start date. Most projects have a preferred finish date (also called a soft finish date), and many projects have a must-hit finish date (also called a hard finish date). When managing projects like these, it is essential that you know the plan’s current or scheduled finish.
To see cost and finish date in the Project Statistics dialog box
1. On the Project tab, in the Properties group, click Project Information.
2. In the Project Information dialog box, click Statistics.
![]() Tip
Tip
Another way to open the Project Statistics dialog box is to click the File tab to open the Backstage view. On the Info page, click Project Information, and then click Project Statistics.
To display the Costs report
1. On the Report tab, in the View Reports group, click Costs.
To display the Cost table in the Task Sheet view
1. On the View tab, in the Task Views group, click Other Views, and then click Task Sheet.
2. On the View tab, in the Data group, click Tables, and then click Cost to display the Cost table.
To display cost distributed over time in the Task Usage or Resource Usage view
1. On the Format tab, in the Details group, click Add Details, and then select the cost values you want.
Inactivate tasks (Project Professional only)
![]() Important
Important
The ability to inactivate tasks is available only in Project Professional and not in Project Standard. If you have Project Standard, you can skip this section.
You can include tasks in a plan that you might later decide you don’t want to have completed, but whose details you also don’t want to lose by deleting them. You might, for example, develop tasks that pose “what-if” questions that you can’t begin to answer until other preliminary questions get answered. Or you could design a plan that describes a likely case scenario for project completion but that also includes more optimistic and pessimistic sets of tasks.
In Project Professional, you can inactivate a single task or multiple tasks. Inactivating tasks can be preferable to deleting tasks, in that it keeps the task information in the plan but removes the scheduling effect of those tasks. A task that drives the start of a successor task, for example, remains visible when inactivated, but it has strikethrough formatting applied in the Gantt Chart and other views, and its link relationship is broken and its successor is rescheduled.

Inactivated tasks are formatted as strikethrough text, and their Gantt bars appear as colorless outlines
If you later want to reactivate inactivated tasks, you can easily do so; Project restores them as active tasks with the same scheduling impact they previously had.
![]() Tip
Tip
You can inactivate only tasks that have no progress recorded against them. You cannot inactivate completed tasks or tasks that have any progress recorded.
To inactivate tasks (Project Professional only)
1. Select the name of the task or tasks you want to inactivate. If you inactivate a summary task, all of its subtasks will be inactivated.
2. On the Task tab, in the Schedule group, click Inactivate. The original task information is still visible, but now it has no impact on the overall plan. Later, if you decide to include these tasks in the plan, you can reactivate them by clicking Inactivate again.
Skills review
In this chapter, you learned how to:
![]() Examine resource allocations over time
Examine resource allocations over time
![]() Resolve resource overallocations manually
Resolve resource overallocations manually
![]() Check the plan’s cost and finish date
Check the plan’s cost and finish date
![]() Inactivate tasks (Project Professional only)
Inactivate tasks (Project Professional only)
 Practice tasks
The FineTunePlan practice file for these tasks is located in the Project2016SBSCh12 folder.
![]() Important
Important
If you are running Project Professional with Project Web App/Project Server, take care not to save any of the practice files you work with in this book to Project Web App (PWA). For more information, see Appendix C, “Collaborate: Project, SharePoint, and PWA.”
Examine resource allocations over time
The scenario: At Lucerne Publishing, the new children’s book plan has been developed to the point that you’re ready to closely examine resource assignments and overallocation issues. You’ll begin with Carole Poland. Open the FineTunePlan plan in Project, and perform the following task:
1. Use the Resource Usage view to examine Carole Poland’s overallocation on Monday, April 23, 2018.

Carole’s overallocation on Monday is not severe enough to require a change to the plan
If you do not see any overallocated resources, verify in the Resource Leveling dialog box that Day By Day and Manual are selected (on the Resource tab, in the Level group, click Leveling Options to open the Resource Leveling dialog box). If you still don’t see overallocated resources, click the Clear Leveling button in the Leveling Options dialog box. If all else fails, close and reopen the FineTunePlan practice file.
Resolve resource overallocations manually
The scenario: You see more resource overallocations in the new children’s book plan. Unlike the minor overallocation for Carole Poland that you examined earlier, the more severe overallocations for Hany Morcos do require corrective action. Continuing in the FineTunePlan plan, perform the following tasks:
1. In the Resource Usage view, locate Hany Morcos’s overallocations in the last week of August.
2. Edit Hany’s assignment on the Proof and Review task from eight hours to four hours per day on August 24, 27, and 28.
3. Also edit Hany’s assignment on the Create mockup task from eight hours to four hours per day on August 24, 27, and 28.

Now that this resource’s assignments have been edited, the resource is no longer overallocated; she now has 8 hours of assigned work per day, whereas she previously had 16 hours of work per day
Level overallocated resources
The scenario: You’ve examined and manually resolved some resource overallocation issues in the new children’s book plan. Now that you understand the basics of resource leveling, you’re ready to use Project’s resource-leveling feature. Continuing in the FineTunePlan plan, perform the following tasks:
1. Switch to the Leveling Gantt view. Use the default settings to level the plan.

Note the default settings in the Resource Leveling dialog box
2. In the Leveling Gantt view, examine the impact of leveling across the plan.

After leveling, note the before and after Gantt bars; in this case, Project introduced splits to assignments but did not need to add any leveling delays
Check the plan’s cost and finish date
The scenario: You’ve fine-tuned important parts of the new children’s book plan, including resource assignments, costs, and task durations. To see the plan’s current cost and finish date values, you’ll switch to a different view and then see summary values in the Project Information dialog box. Continuing in the FineTunePlan plan, perform the following tasks:
1. Switch to the Cost table in the Task Sheet view. Examine the plan’s cost details there.

At this point in the project life cycle, the plan does not yet include a baseline; therefore, the Baseline column contains only zero values—similarly, the plan does not yet contain any actual progress, so the Actual column contains only zero values
2. Check the plan’s finish date and other summary values in the Project Statistics dialog box.

The Project Statistics dialog box is a great place to get an at-a-glance view of key measures of the plan
Inactivate tasks (Project Professional only)
The scenario: You’ve shared the current cost and schedule details of the new children’s book plan with the publisher. She has asked you to identify some activities that could be cut to reduce costs without risking the essential deliverables of the plan. You’ve identified the activities that could be cut, and to see the result of cutting them while keeping the opportunity to easily restore them, you’ll inactivate the tasks in question. Continuing in the FineTunePlan plan, perform the following tasks:
1. Switch to the Gantt Chart view and locate summary task 39.
2. Inactivate task 39. This will also inactivate its subtasks.

Note the strikethrough formatting applied to the names of inactivated tasks, and their Gantt bar formatting
3. Review the impact of inactivating this task on the plan’s overall cost and duration.

Inactivating the summary task and its subtasks affected the plan’s work and cost, but not its finish date