
Writing a book meant for beginners in any technology has its own special challenges. What topics are appropriate and which ones are out of scope? How can enough material be included so that the reader gets a good foundation without making the book too large and expensive? Within every single chapter, I thought about the questions someone new to SQL Server Reporting Services (SSRS) might ask from both a developer and an administrator point of view. I tried to explain things in a simple way and cover enough to get you started. I didn’t mention some features just to avoid adding unneeded complexity. My hope is that this book inspires you to learn more, and that it just marks the beginning of your journey.
As I wrote Chapter 10, I was already thinking about what this chapter would cover. I realized that I could break the advanced information into five areas: installation, architecture and configuration, development, administration, and integration with other reporting tools. In this chapter, without going too deep into the details, I will tell you about some advanced features in each of these areas.
SSRS Installation
In Chapter 1, you learned how to install SSRS on your own computer in native mode so that you could learn how to deploy and manage reports. The chapter did not cover installing SSRS in SharePoint integrated mode. Over the past few releases of both SQL Server and SharePoint, installing and configuring SSRS in SharePoint mode have become easier, but there are still several steps. You also need a SharePoint farm in place, and many beginners will not have that available to them.
There are a couple of advantages when running SSRS in SharePoint integrated mode. You can add the development of reports to the workflow functionality built into SharePoint. For example, you could require that new reports be approved and that there will be an e-mail notification when changes are made. SharePoint also has document versions, something that you won’t find with the web portal.
There are two features that are available with Sharepoint mode but not Native mode. One is Power View reports. These reports are intended for end-user ad hoc reporting using drag and drop. The reports are based on predefined data models, and the person creating the report can explore the data while he or she builds the report. The report is very interactive. By clicking a bar in a chart, for example, the entire report is filtered. Visualizations are quickly changed to different types with just a click. Figure 11-1 is a picture of a Power View report in design view that I created from a predefined data model and about 30 clicks of the mouse. The visualizations reflect actual data.

Figure 11-1. A Power View report
Another feature only available in reports deployed to SharePoint is data alerts. Based on criteria defined in the data alert, an e-mail will fire when the data of a report changes . This way, the report can be viewed only when there is an important change in the data.
If you like the new web portal but you wish you could customize its look and feel, you are in luck. Starting with SSRS 2016, you can take advantage of the custom branding feature to tailor the look of the web portal. Figure 11-2 is an image of an Xbox-branded web portal from the SSRS Team Blog found at https://blogs.msdn.microsoft.com/sqlrsteamblog/2016/03/20/how-to-create-a-custom-brand-package-for-reporting-services-with-sql-server-2016/ .
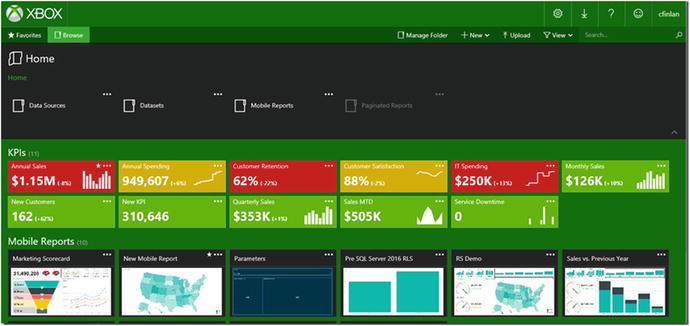
Figure 11-2. A custom web portal
Architecture and Configuration
While you have been learning SSRS, you probably have everything you need installed on one computer: a SQL Server instance with a source database and the Reporting Services databases, Visual Studio with SQL Server Data Tools (SSDT), and an SSRS instance. This is the simplest configuration possible. Most of the time, the developer may have only Visual Studio with SSDT installed locally while the SSRS and SQL Server instances are hosted on other servers. Even more complex than this is the scale-out configuration where the SSRS instance is deployed over two or more servers. This configuration allows a larger number of reports to run at any given time. Figure 11-3 shows how the scaled-out architecture looks.

Figure 11-3. The scaled-out architecture
Even with the typical SSRS deployment, there are several settings that you may need to change for your particular situation that are not available through the Reporting Services Configuration Manager. Be sure to consult the online documentation about settings you may need to configure in the rsreportserver.config file found in the SQL Server section of Program Files.
Development
Several chapters of this book were devoted to developing reports. You learned about grouping, visualizations, expressions, and more. I once saw a demo where a map visualization was used to grow a virtual flower based on a value from a database. Obviously, the sky is the limit when it comes to designing reports, especially for the more creative among us.
Almost every property of every object can be controlled dynamically with expressions. This book demonstrated how to create a handful of expressions. I encourage you to learn about all the functions that were not used in the book. Some developers add custom functions or even custom assemblies written in C# to their reports.
If you are not that comfortable with writing code, another interesting exercise is creating a template with your company’s logo, colors, and footer. You create the report and then save the rdl file in this folder with a descriptive name:
C:Program Files (x86)Microsoft Visual Studio 4.0Common7IDEPrivateAssembliesProjectItemsReportProjectThen, when you add a new report to a project, the template will be one of the choices and will have all the properties defined in the template by default.
Administration
In Chapters 8 and 9, you learned about deploying reports and controlling the security. You also learned how to set up a subscription. There are several properties of deployed reports that you did not learn about such as caching and snapshots.
Caching is a feature used to save and reuse reports where the data will not frequently change to improve performance. For example, imagine that several people will run a report based on the previous month’s sales. The data will not change, so you could take advantage of caching to save the report so that it runs quickly the second and subsequent times it is run.
I once worked on a project that compared data migrated from an old system to data from a new system. A business analyst would select values from a number of parameters on the report and then go back and forth between reports drilling down and viewing the data in different ways. Some of the required queries were painstakingly slow, and there was nothing we could do to improve them. The analysts were spending more time waiting than actually viewing the data. Since the data was not changing that often, I set up caching with a 30-minute expiration. The analysts had to put up with a slow query just the first time it ran with a given set of parameters. This made the solution workable and the analysts were able to do their jobs. Figure 11-4 shows the Caching feature.

Figure 11-4. The Caching feature
The other interesting feature is History Snapshots. History Snapshots are similar to subscriptions in that default parameter values must be defined and the data source must store the credentials. You can create a snapshot manually or set up a schedule. Either way, you can go back to view the snapshot later and the report will show the data as it looked at the time the snapshot was taken.
Integration
Since the introduction of SSRS, there has been a Report Manager and now a web portal for hosting the reports. Eventually, integration with SharePoint was added. Developers have embedded reports within applications with a report viewer control. You can also use a special URL (uniform resource locator) to display a report outside the web portal. If you add rs:Embed=true to the end of the report’s URL from the web portal, it will display in a browser without the web portal heading and menus.
One icon that you may not have noticed, shown in Figure 11-5, from the report menu allows you to export a data feed. The data feed can be used as a data source for Power Pivot, the advanced Excel feature. Power Pivot can be used to combine large amounts of data from one or more sources. The resulting workbook can be used as the basis of Power View reports. Not only is SSRS a way to view data, it can also be the source of data for another reporting tool.

Figure 11-5. The Export to Data Feed icon
SSRS is one of several reporting tools from Microsoft including the time-honored Excel and the new cloud solution, Power BI. SSRS is considered the on-premises reporting solution, especially for paginated reports. With the 2016 release of SSRS, however, SSRS knows no boundaries. SSRS integrates with the cloud solutions Power BI and SharePoint Web, and you have seen the new mobile reports that can be delivered to mobile devices. Over the past few years, some people have predicted the demise of SSRS. With the 2016 revamp, SSRS is alive and well and ready for the future.
Summary
SQL Server Reporting Services is a wonderful topic to learn about. Many people get their start in information technology (IT) as report developers. For many careers, both IT and otherwise, report development is seen as a desired skill. I often talk to people who work in non-IT roles such as human resources who need to learn T-SQL and SSRS for their jobs. In the IT department where I used to work, I was called on to create reports from our help desk ticketing system and our network management tools. Even within IT, we needed to see data from our own systems.
This book is an introduction to the popular reporting tool, SQL Server Reporting Services. This chapter reviewed some of the advanced topics you may want to consider as next steps in your learning. I hope you enjoyed learning about SSRS. I certainly enjoyed writing about it!