
I deployed my first group of SSRS reports back in 2004 when SQL Server Reporting Services (SSRS) was initially released. The reports were so successful that word got around to the other departments at the company where I worked. Soon I had more requests for reports than I could handle. I was a database administrator first, and creating reports was just a small part of my job. It wasn’t long before I put together a day-long SSRS workshop to teach a small group of people from each department how to develop their own reports.
Since then, I have taught SSRS development to dozens of people with classes, articles, and my original SSRS book. Knowledge of data sources and datasets, covered in this chapter, is fundamental to building reports. When teaching SSRS, I learned that these topics are challenging to understand as well. Make sure you fully comprehend the material covered in this chapter before moving on, and be sure to refer back whenever you need help.
This chapter covers both data sources and datasets. You will learn what they are, how to create them, and when it makes sense to share them among reports. In Chapter 2, you created the project and two reports by running the wizard. In this chapter, you will build the reports manually.
Creating Shared Data Sources
If you have worked with databases before, you are probably familiar with the concept of a connection string. A connection string is like an address telling you everything you need to communicate with a database, such as the type of database, the location, and the account used to connect. Here is a possible connection string:
Provider=SQLNCLI11;Server=localhostINST1;Database=AdventureWorks2016;Trusted_Connection=yes;
This connection says that the type of connection is for SQL Server using the latest version of the Native Client. The server is located on the local computer and it is a named instance, INST1. The database to connect to is AdventureWorks2016. Instead of providing a user name and password, Windows credentials will be used.
The connection string may look intimidating, but you don’t have to figure it out yourself. Most applications, SSRS included, have an intuitive tool for building connection strings.
In Chapter 2, you created a solution with one project. Inside the project, you created two reports. To keep things simple and to focus on creating a report with the wizard, I had you embed each data source within a report. This means that the data source became part of the report definition. If you look in the XML source code of those reports, you will find the connection string.
Most of the time, data sources should be shared among reports instead. Imagine that you have 100 or more reports with the identical embedded connection string in each one. Then you get word that the database is moving to a new server over the weekend. You are looking at hours of work editing and testing each report. If the data source was shared instead of embedded, you would need to make just one simple change, and all of your reports would be pointing to the new database location.
As a best practice, data sources should be shared, and SSRS makes it easy to do so. To learn how to create a shared data source for your project, take the following steps:
Launch SQL Server Data Tools 2015 (SSDT).
Create a new project by clicking File ➤ New Project.
Once the New Project dialog opens, find the Reporting Services templates under Installed ➤ Templates ➤ Business Intelligence.
Select Report Server Project as shown in Figure 3-1.

Figure 3-1. The Report Server Project
Fill in Data Sources and Datasets for the project name.
Fill in Beginning SSRS Chapter 3 for the solution name as shown in Figure 3-2.

Figure 3-2. The project and solutions names
Make sure that the solution will be saved where you can find it. It will be created in the location of the previous solution by default. Click OK to create the project.
Make sure that you can see the Solution Explorer window. If it is not visible, enable it from the View menu. You can also use the keyboard shortcut CTRL + ALT + L. Figure 3-3 shows how the Solution Explorer should look.

Figure 3-3. The Solution Explorer
The project can contain three types of objects: Shared Data Sources, Shared Datasets, and Reports. The only real requirement is to have a report; the data sources and datasets may be embedded in the reports. In that case, you will not see them in these folders. To add a Shared Data Source , follow these steps:
Right-click Shared Data Sources and select Add New Data Source as shown in Figure 3-4.
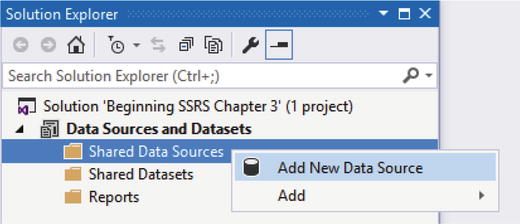
Figure 3-4. Add a new data source
This brings up the Shared Data Source Properties dialog as shown in Figure 3-5. Fill in Name: for the data source, AdventureWorks2016. Naming each data source is very important so that the data source can be identified later.

Figure 3-5. The Shared Data Source Properties
The Type of data source should be Microsoft SQL Server.
Click the Edit button to bring up the Connection Properties dialog.
Fill in the server name and logon properties for your SQL Server instance. If you have trouble figuring out your server instance name, see the section “Determining the SQL Server Name,” in Chapter 1 or ask your database administrator for assistance.
Under Select or enter a database name, select the AdventureWorks2016 database. The properties should resemble Figure 3-6.

Figure 3-6. The connection properties
Note Going forward, the examples in the book will assume that you know how to connect to your database.
Click Test Connection to make sure that the connection information is correct. Click OK to dismiss the test box and OK again to accept the connection properties. The Connection string property should now be filled in.
Click Ok to accept the data source’s properties. The data source will now be visible in the Solution Explorer as shown in Figure 3-7.

Figure 3-7. The new data source
Notice that the data source is actually an XML file. You don’t have the option to view the file’s contents in Visual Studio, but you can navigate to the rds file and open it up in a text editor if you wish. Figure 3-8 shows the contents of my data source file.

Figure 3-8. The data source file
If you need to edit the data source properties, click the data source or right-click it and select Open. It may be a bit counterintuitive, but if you right-click and select Properties, you will see only the File Name and File Path in the Properties window as shown in Figure 3-9.

Figure 3-9. The properties of the data source
Set up any connections that will be needed by the reports in your project. As a best practice, name the shared data sources so that they can be identified later. You should avoid naming the data sources with the server name. Often you will be doing development against a local, development, or testing server. The published reports will usually point to a production server with a different name.
Note
If you would like to use the projects found in the code download, you may need to modify the data source properties in order to connect to your own SQL Server instance.
Creating Shared Datasets
A dataset is a query, the question you are asking the database. Unlike data sources, datasets are usually unique to the reports and most should not be shared. There are a couple of exceptions, however. For example, you may need to reuse a parameter list in multiple reports. There are also some new features, such as mobile reports, that required shared datasets. In this example, you will create a parameter list as a shared dataset.
To create a shared dataset follow these steps:
Right-click the Shared Datasets folder and select Add New Dataset.
This brings up the Shared Dataset Properties dialog. Type Year in the Name property.
Make sure that the data source you created in the last section, AdventureWorks2016, is selected in the Data source property.
Make sure that Text is chosen as the Query type property.
Type the following code in the Query text box:
SELECT DISTINCT YEAR(OrderDate) AS OrderYearFROM Sales.SalesOrderHeaderORDER BY OrderYear;The properties should look like Figure 3-10. Click OK to create the new shared dataset.

Figure 3-10. The Shared Dataset Properties
You should now see the Year dataset in the Shared Datasets folder as shown in Figure 3-11. Just like the data sources, viewing the properties shows the file location. To edit the properties, click the name or right-click and select Open.

Figure 3-11. The new shared dataset
You can create additional datasets as required. Remember that it doesn’t make sense to share a dataset unless it will be used in multiple reports. The typical use case is for a parameter list.
Note
At the release of SQL Server 2016, there was a bug involving Shared Datasets. To fix the problem, navigate to the project files and open the Year.rsd file. Change this code <Dataset> to <Dataset Name="Year"> and then save the file. Microsoft has promised to fix this issue soon, so it may not be a problem by the time you are reading this book.
Using Data Sources and Datasets
The reason for creating data sources and datasets is to use them in reports. Now you will do just that. Follow these steps to create the report:
Right-click the Reports folder and select Add ➤ New Item as shown in Figure 3-12. Make sure that you do not choose Add New Report which kicks off the wizard.

Figure 3-12. Add a new report
In the Add New Item – Data Sources and Datasets dialog, select Report.
Fill in the report name property with Sales by Year. The dialog should look like Figure 3-13.
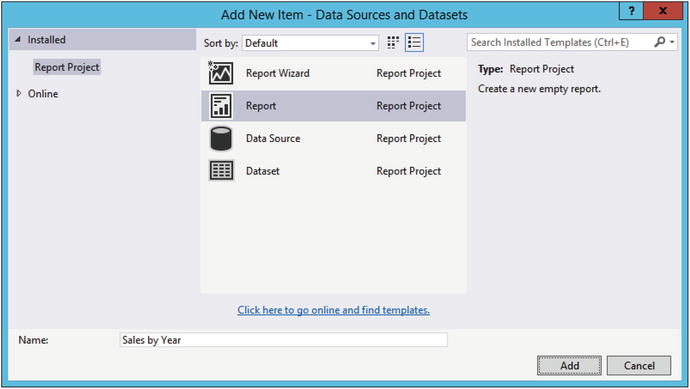
Figure 3-13. The new report properties
Click Add to create the new report.
The report should now be visible in the Solution Explorer and open in design view. If not, double-click the report name to open it. The next task is to set up the data source within the report so that it points to the shared data source.
Find the Report Data window which will probably be located on the left. If it is not visible, click the design canvas of the report, and then click Report Data found at the bottom of the View menu. The Report Data window has several folders as shown in Figure 3-14.

Figure 3-14. The Report Data window
Follow these steps to set up the report’s data source:
Right-click the Data Sources folder and select Add Data Source.
This brings up the Data Source Properties dialog box. Fill in the Name property with AdventureWorks. As a best practice, always give each data source a descriptive name. This data source will be linked to the AdventureWorks2016 shared data source. You can, if you wish, give it the exact same name. In this case, you will change the name slightly so it is easy to see the difference between the shared data source and the data source in the report.
The middle of the dialog lets you create this report data source as an embedded data source with connection properties visible to only this report. Instead, select Use data source reference. Find AdventureWorks2016 in the list. The dialog should look like Figure 3-15.

Figure 3-15. The report data source properties
Click OK to create the data source.
The Edit button on the dialog shown in Figure 3-15 allows you to modify the shared data source if you need to. Remember that changes made this way will affect all reports using this data source. You can also create a new shared data source. As a best practice, and to avoid confusion, always create and edit shared data sources at the project level.
You should now see the AdventureWorks data source in the Data Sources folder in the Report Data window as shown in Figure 3-16. The tiny arrow on the icon signifies that it is pointing to a shared data source.

Figure 3-16. The new data source
The next step in creating a report is to add a dataset. Datasets are queries, the question to the database or other source of data. A dataset will usually be specific to a report, so it doesn’t make sense to share most of them. To create the first dataset for this report, follow these steps:
Right-click the Datasets folder and select Add Dataset. This brings up the Dataset Properties dialog box. By default it is set to Use a Shared Dataset as shown in Figure 3-17.

Figure 3-17. The Dataset Properties dialog
Fill in the Name property with Sales.
Select Use a Dataset embedded in my report. When you do, the dialog changes. Instead of showing the shared dataset, the dialog displays the properties for the embedded dataset. Figure 3-18 shows how the dialog looks after the changes.

Figure 3-18. The Dataset Properties for an embedded dataset
Find AdventureWorks in the dropdown box under Data source. Only data sources that have been set up as part of the report are visible in this list.
Select Text as the Query type if it is not selected.
Type this code in the Query property:
SELECT SUM(TotalDue) AS TotalSales, MONTH(OrderDate) AS OrderMonth, YEAR(OrderDate) AS OrderYearFROM Sales.SalesOrderHeaderGROUP BY MONTH(OrderDate), YEAR(OrderDate);Click OK to create the dataset.
The Sales dataset should now be visible in the Report Data window as shown in Figure 3-19. In addition to the dataset name, you will also see the available fields.

Figure 3-19. The Sales dataset
Now you can display data from the dataset on the report. Follow these steps to set up a simple report:
Display the Toolbox window. It if is not visible, click the report design canvas and then click Toolbox from the View menu. The Toolbox looks like Figure 3-20.

Figure 3-20. The Toolbox
Drag a Table control from the Toolbox on to the report design canvas. You can also right-click the design surface and add a table by selecting Insert ➤ Table. Figure 3-21 shows the table control on the report.

Figure 3-21. The Table control
There are several ways to populate the table. From the Report Data window, drag the OrderYear field to the leftmost cell in the Data row. The Header row automatically populates.
Hover over the middle cell in the Data row until a small icon appears in the cell. Click the icon to display a list of the available fields. Select OrderMonth.
Click in the cell on the right in the Data row. Type in this code:
[TotalSales]In the header row above, type Total Sales. The table grid should look like Figure 3-22.

Figure 3-22. The table with cells populated
Click Preview to view the report. Obviously, this report is not ready to be published, but it does demonstrate the steps required to hook a report to the data.
Using a Shared Dataset
Shared datasets are useful for queries that will be reused throughout the project. SSRS allows you to create reports that let the user running the report to filter dynamically. Often, the same criteria will be used with multiple reports which is a great use of shared datasets. Follow these steps to add the shared dataset:
Switch back to Design view.
In the Report Data window, right-click Datasets and select Add Dataset.
Name the dataset Year.
Make sure that Use a shared dataset is chosen and select Year from the window. The Dataset Properties dialog should look like Figure 3-23.

Figure 3-23. Using a shared dataset
Click OK to create the new dataset.
The next step is to alter the Sales dataset so that it requires a parameter. Double-click the Sales dataset to bring up the properties. You can also right-click and select Properties. Change the Query to the following code. It will now require that a year be provided when running the report:
SELECT SUM(TotalDue) AS TotalSales, MONTH(OrderDate) AS OrderMonth, YEAR(OrderDate) AS OrderYearFROM Sales.SalesOrderHeaderWHERE YEAR(OrderDate) = @YearGROUP BY MONTH(OrderDate), YEAR(OrderDate);
When you run the report you are now required to type in a year before you see the results. Preview the report. Type in 2011 and click View Report. The totals displayed will be for only 2011 as shown in Figure 3-24.

Figure 3-24. The results filtered by year
The report is successfully filtered by the year. The user must already know which years are valid for the report. This is not too much of a problem for valid years, but what about departments or customers? In order to supply a valid list of years from which the user can choose, follow these steps:
Switch back to Design view and expand the Parameters folder in the Report Data window.
When you changed the query to filter by @Year, the Year parameter was automatically added. It is shown in Figure 3-25.

Figure 3-25. The Year parameter
Right-click Year and select Parameter Properties which brings up the Report Parameter Properties dialog box.
On the General page, change the Data type to Integer.
Switch to the Available Values page.
Change the Select from one of the following options to Get values from a query.
Change the Dataset property to Year.
Change the Value field to OrderYear.
Change the Label field to OrderYear. The dialog should look like Figure 3-26.

Figure 3-26. The parameter properties
Click OK to accept the properties.
You will learn much more about parameters in Chapter 6. For now, preview the report. You will see a dropdown list of valid years as shown in Figure 3-27.

Figure 3-27. The parameter list
Experiment by running the report with different values for the Year parameter. The report data should change for each year chosen.
Summary
Understanding data sources and datasets is crucial to report development. Data sources are the connection strings to the database or other source of data. Datasets are the queries. It’s possible to share both data sources and datasets among reports within a project. As a best practice, always share data sources. Share datasets if the query can be used across reports, such as for a commonly used parameter.
When you add a new report to a project remember that the following step is to add a data source to the report. The next step is to add a dataset.
Chapter 4 covers working with tables, text boxes, and other controls commonly used in reports.