
The past 15 years or so have been the age of the reality TV show. But long before “Extreme Makeover: Home Edition” and “American Idol,” reality shows existed on public television. I remember watching unscripted programs about cooking, remodeling houses, and yoga as a child and young teen. My favorites were the shows about art. Theoretically, you could learn how to paint a masterpiece by watching the artist turn a blank canvas into a beautiful still life or landscape.
While reports may not be works of art, there are some similarities. You will start with a blank canvas, but while the data on the report is crucial, the look of the report is important as well.
In this chapter, you will learn more about tables and several other common controls used to build reports. You’ll also learn how to add headers and footers to add features to make the report more professional and ready to publish.
Working with Tables
A report is made of several objects, some of which are linked to the dataset. Other objects give information to the viewer about the report, such as a title or page count. And some objects are there to give the report a certain look and feel such as a company logo . The most commonly used data region is the table control. Chapters 2 and 3 introduced tables. You linked tables to data and modified a few properties. In this section, you will learn even more about tables.
Note
In Chapter 3, you learned how to create a project, data sources, and datasets. You also learned how to add a report to the project. Starting with this chapter, instead of telling you how to create these objects step by step, I’ll just tell you what you need to create. Remember to click Add ➤ New Item when adding a new report to avoid starting the wizard. If you have trouble, refer back to Chapter 3.
To get started, follow these steps:
1. Launch SQL Server Data Tools (SSDT) .
2. Create a new Report Server Project with the name Building Reports and solution name Beginning SSRS Chapter 4.
3. Add a new shared data source pointing to the AdventureWorks2016 database. Name it AdventureWorks2016.
4. Create a new report with the name Working with Tables. Make sure that you add a blank report; do not start up the wizard. See Chapter 3 if you need help. The Solution Explorer should look like Figure 4-1.

Figure 4-1. The Solution Explorer
Note
The Always Show Solution property determines if the solution name is visible when there is only one project in the solution. See the section “Taking a Tour of SSDT” in Chapter 1 to learn how to set this option.
5. In the Report Data window, add a data source, AdventureWorks, that points to the shared data source AdventureWorks2016.
6. Create a new embedded dataset for the report named SalesSummary pointing to the AdventureWorks data source.
7. Type in the following query for the report:
SELECT YEAR(OrderDate) AS OrderYear, SUM(TotalDue) AS TotalSalesFROM Sales.SalesOrderHeaderGROUP BY YEAR(OrderDate);8. The dataset properties should look like Figure 4-2. Click OK to create the dataset.
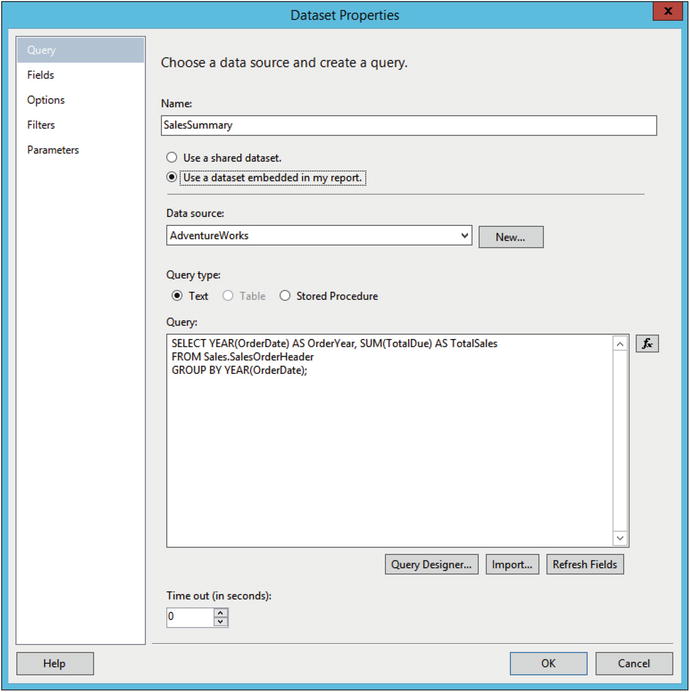
Figure 4-2. The dataset properties
9. Create a second embedded dataset called SalesDetails pointing to the AdventureWorks data source.
10. Add this query to the dataset and click OK.
SELECT CustomerID, SalesOrderID, OrderDate, TotalDueFROM Sales.SalesOrderHeader;
The Report Data window should look like Figure 4-3.
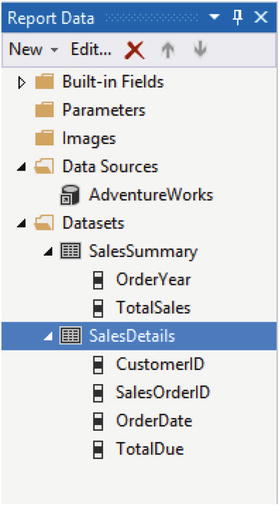
Figure 4-3. The Report Data window
Now that the datasets are in place, you can begin building your report. Add a new table to the design canvas. You can do this by dragging in a table control from the Toolbox or by right-clicking the canvas and selecting Insert ➤ Table.
Each table can be linked to just one dataset. In this case, you have two datasets. Once the first field is added, the table will be linked to the field’s dataset. Hovering over a cell displays a small field list icon. If there is just one dataset, you will click the icon to bring up the field list. In this case, since there are two datasets, hover over the data source name to see both datasets as shown in Figure 4-4. Clicking the dataset name displays the list of fields.

Figure 4-4. Both datasets are available to the table
Select OrderYear under SalesSummary. Now when you move to the next data cell, the SalesSummary fields are the only ones available. Choose TotalSales for the middle cell. You have an extra column on the right. Right-click the handle above the rightmost column and select Delete Columns to remove it.
Add a second table to the report under the first table. As you drag the second table around on the canvas, blue snap lines appear to help you make sure the objects are aligned. For this table, add the CustomerID, SalesOrderID, and OrderDate fields from the SalesDetails dataset to the report. By default, the table has three columns, but you have four fields to display. You can add additional columns by dragging the column to the right of the third column. When you see a blue bracket show up, drop the field. Figure 4-5 shows how this looks.

Figure 4-5. Dragging a new field to the table
You can also right-click on the third column and insert a column to the right.
Whenever fields are added to the data cells, the name of the cell is changed to the name of the field. A value fills in for the header cell as well adding spaces before the upper case letters. You can always edit the header cell if needed.
Property Window Properties
There are dozens of properties available for a table. You can set some of them in the Properties window. Select the intersection of the row and column handles of the first table to select the table. With the table selected, press F4 to open the Properties window. You can also click View ➤ Properties Window from the menu. At the top of the window shown in Figure 4-6, you will see that the table is not called a table at all. It is a Tablix.

Figure 4-6. The table is a Tablix
Note
A data region, such as a table, matrix, or list, is actually called a Tablix. Each one has a particular layout for displaying data. You can start with a table and turn it into a matrix by grouping on a column.
Properties in the Properties Window can be displayed either by categories of properties or alphabetically. Click the icons shown in Figure 4-7 at the top of the Property window to toggle back and forth. There is also an icon that resembles a wrench to open the Property Pages window. You’ll learn more about the Property Pages in the next section.

Figure 4-7. The property window icons
Since Tablix1 will be referred to several times in this chapter, give it a meaningful name: tblSalesSummary. To do this, change the Name property in the General category of the Properties window.
Look for the DataSetName property in the General category of properties. Notice that the property is set to SalesSummary.
As you click on each property, you will see a description of what the property does at the bottom of the Properties window. Most of the properties in the Properties window will not need to be changed, but whatever you change will affect the entire table. Change the BorderStyle Default property to Dotted and the BorderWidth Default property to 3 pt. The Properties window should look like Figure 4-8.

Figure 4-8. The modified properties
Preview the report . It should look like Figure 4-9.

Figure 4-9. The report with a dotted border on tblSalesSummary
Property Dialog Properties
In addition to the Properties window, most report objects have a property dialog box as well. The properties available to change between the two methods overlap. Some of the more advanced properties, such as those involving interacting with other reports, are only available in the properties dialog. My opinion is that it is much easier to work in the dialog box when you can.
Note
Every object added to the report has a name. By default the name will be the type of object plus a number. You may be wondering if you should give a descriptive name to every object. My rule is to name any object that will be referred to in an expression or calculation.
Switch back to design view and select the second Tablix. When the handles appear, right-click the intersection of the two handles. Select Tablix Properties as shown in Figure 4-10.

Figure 4-10. Select Tablix Properties
The Tablix Properties dialog has several pages. On the General page shown in Figure 4-11, change the Name to tblSalesDetails. Type Sales Details in the ToolTip property. Under Page break option, check Add a page break before.

Figure 4-11. The General page of the Tablix Properties
Click OK to accept the property changes. Preview the report. Now tblSalesDetails will show up on the second page. Hover over the report to see the tooltip.
Take a look at Figure 4-11 once again. The properties shown in the Row Headers section to control the headers look like great ideas. They don’t work, however. If you go back to design view, check these properties and view the report, you will see that they don’t make any difference. The table headings will not be repeated on each page, and the header row will not be visible when scrolling. In Chapter 5, you will learn how to control the Row and Column headers.
Figure 4-12 shows the Visibility property page. You can choose to show or hide the table and to set the visibility of the table based on an expression. The value of a parameter might be a good expression to use.

Figure 4-12. The Visibility properties
Theoretically, you can toggle the visibility by an item chosen from the dropdown list. If you check Display can be toggled by this report item and set the property to any of the items in the list, the report will display an error when run, so make sure to uncheck this before closing out of the dialog. The error occurs because all of the items in the list are part of the table and they can’t be clicked before the report runs.
The Filters page allows you to add filters to the data returned by the dataset. Generally, this is a bad idea, because you should filter at the database. This capability is useful, however, if the source of data is not filterable, such as from an XML file. I did run across a use case a few years ago. I needed to use the same dataset, just with different filters, in several tables on the same report. Instead of pulling the data multiple times with different filters, I used one dataset and filtered at each table.
The most common reason I have found to bring up the Tablix Properties box is to change the display order of the data. The Sorting page is shown in Figure 4-13. Click Add and select CustomerID. Click Add again and select SalesOrderID. Save the properties and preview the report to see that the data is now sorted.

Figure 4-13. The Sorting page
Other Report Components
There are many other elements that you can add to reports to enable additional functionality or to make the report look more attractive and professional. Chapter 7 covers the visual elements such as charts and indicators, but you will take a look in this section at some of the more basic objects that you can add.
There are many reasons to add independent text boxes to reports (e.g., the report title and page number). Most of these objects should show up on each page. If you just add a text box to the top of the report body, it will show up only once. To make it show up on each page, include the information in a report page header.
Page Headers
Just like text boxes and tables, the page header has properties that you can modify to change the look or behavior. For example, you can add a background color or image. Follow these steps to add the page header to the report.
1. Right-click the report canvas and select Insert ➤ Page Header. You can also insert the page header from the Report menu.
2. Right-click the header and select Insert. The list of controls, as shown in Figure 4-14, you can add is very short. It’s limited to controls that do not require being connected to data. Choose Text Box.

Figure 4-14. The list of controls for the header
3. From the Report Data window, expand Built-in Fields and drag Report Name to the text box. You can also drag fields directly to the header to add the text box automatically.
4. Click the edge of the text box so that the handle appears as shown in Figure 4-15.

Figure 4-15. The handle on the text box
5. By dragging the handle, reposition the text box so that it is located on the left side of the report.
6. Expand the text box so that it is as wide as the canvas.
7. With the text box selected, center the text. You can do this by clicking the Center icon in the menu or by changing the Horizontal property on the Alignment page of the Text Box Properties dialog.
8. Change the font size to 16 pt. Again, there are multiple ways to do this. Choose your favorite method: design menu, Properties window, or Property dialog. The text box will automatically grow vertically, but you can also increase the height.
9. Click the text box and add this text after the placeholder: : Sales Details
10. Select the words Sales Details. If you have the Properties window open, you will see that that the name of the currently selected object is Selected Text.
11. Italicize the words Sales Details. The text box should look like Figure 4-16.

Figure 4-16. Multiple formats in one text box
12. Add a line control to the report header below the text box.
13. Adjust the line so that it is horizontal by dragging one end up or down.
14. Increase the size of the line by dragging each end.
15. Change LineWidth to 2pt in the Properties window. The LineWidth property is the thickness of the line. Lines are the simplest objects. They do not have a property dialog box.
16. Copy the line and paste in the header.
17. Move the second line so that it is close to and under the first line.
18. Right-click the report header and select Header Properties.
19. Uncheck Print on first page under Print options.
20. Click OK.
Now when you preview the report, you will see the header beginning with page 2 as shown in Figure 4-17. As you view subsequent pages, you will continue to see the page header.
Figure 4-17. Page 2 of the report
Table Cell Formatting
Obviously, there is much you can do to make this report look better. To start, change the formats of the OrderDate and TotalDue fields by following these steps:
1. Return to design view.
2. Right-click the OrderDate cell and select Text Box Properties.
3. Select the Number page and choose Date under Category.
4. Select the 2000-01-31 format and click OK.
5. Bring up the Text Box Properties of the TotalDue cell.
6. Select the Number page and choose Currency under Category.
7. Make sure that Decimal places is set to 2.
8. Check use 1000 separator (,) and click OK.
When you preview the report, the table should look like Figure 4-18.

Figure 4-18. The table with formatting
The next step is to format the header row. Luckily, you do not need to format each cell individually. Follow these steps to format the row:
1. In design view, click a cell of tblSalesDetails.
2. When you do, the row and column handles appear. Select the handle next to the header row.
3. In the Properties window, change the BackgroundColor to CornflowerBlue.
4. Change the Font Color property to White.
5. Change the FontWeight property to Bold.
6. Now, click the Sales Order ID column.
7. Align each column to the right by selecting each one and then clicking the Align Right icon in the design menu.
8. The table may not line up well under the report header. Follow these steps to adjust the report.
9. Right click the report canvas and select View ➤ Ruler.
10. Drag the right edge of the report title so that it is 5 inches (12.5 cm) wide.
11. Select both lines. Hold down the CTRL key and press the right arrow until the lines are arranged under the title.
12. Drag the right edge of the report canvas to the left as far as it will go, which will be when it bumps up against a control.
To make long reports easier to read, you may want to alternate the background color of the rows. Unfortunately, there is no property that you can change to accomplish this. You can, however, use an expression to control the BackgroundColor property. Select the data row. In the Properties window, change the BackgroundColor to = IIf(RowNumber(Nothing) Mod 2 = 0, "LightBlue", "White").
Now preview the report. Page 2 of the report should look like Figure 4-19.

Figure 4-19. The formatted Sales report
The ability to control the value of just about any property with an expression is a wonderful feature of SQL Server Reporting Services (SSRS). To know if a property can be controlled with an expression, look for the word Expression or the symbol fx in the property list or page.
Page Footers
A page footer is also quite useful for displaying information such as the page number and date the report was viewed. To add the page footer, follow these steps:
1. Switch to design view.
2. Right-click the report body and select Insert ➤ Page Footer.
3. Right-click the footer and select Footer Properties.
4. Uncheck the Print on first page property in the Print options section.
5. Click OK to accept the change.
6. From the Built-in Fields folder in the Report Data window, drag Execution Time into the footer.
7. Increase the width of the field so that it is about double the original width.
8. Add a text box to the footer. Be sure it lines up horizontally with the execution time text box.
9. Type this expression into the text box: Page [&PageNumber] of [&TotalPages]. You could also bring up the Expression dialog to help you write it.
Caution
By adding the Total Pages property, the report must be completely built before the first page is returned to the user. If the report is extremely large, this could give the impression of a performance problem.
10. Double the width of the text box.
11. Add a line to the top of the footer.
12. Level the line and drag the edges to the width of the report.
When you run the report , the report footer on the second page should look like Figure 4-20.
Figure 4-20. The report footer
Report Cover Page
The first page of the report can serve as a cover page. You cannot add separate pages to the design canvas, but you can add page breaks before or after tables or some other objects. In this case, you have already turned on a page break before the tblSalesDetails table and turned off the page header and footer for the first page. In this example, you will add a rectangle control that will be a container for other controls. You will set the PageBreak property of the rectangle to force a page break.
To create the cover page, follow these steps:
1. In design view, drag the top of the footer down to increase the size of the report body to 7 inches (18 cm). Figure 4-21 shows the top of the footer, which is the dotted line.

Figure 4-21. The report footer
2. Drag the tblSalesDetails table down so that it is just above the footer.
3. Delete the tblSalesSummary table.
4. Add a rectangle control to the report.
5. Expand the rectangle so that the top is right under the header, the bottom is right above the tblSalesDetail table, and the edges are at the width of the report canvas.
6. Right-click inside the rectangle and select Rectangle Properties. Change the Border properties to those shown in Figure 4-22.

Figure 4-22. The rectangle border properties
7. On the General page , check Add a page break after. Make sure the Keep contents together on a single page, if possible is checked. Click OK to save the properties.
8. Bring up the Tablix Properties of the tblSalesDetails table, uncheck the Add a page break before property and click OK.
9. Add a textbox to the rectangle and type in Sales Report.
10. Change the font size to 20 pt.
11. Position the text box near the top and centered and resize it appropriately.
12. Add a table to the rectangle.
13. Fill in OrderYear and TotalSales from the SalesSummary dataset.
14. Remove the rightmost column.
15. Select the header row and bold the font.
16. Format the TotalSales cell as currency with no decimal places and with a 1000 separator.
17. Align each column on the right.
18. Change the table so that it sorts by OrderYear.
19. Add an image control to the top of the rectangle.
20. The Image Properties dialog will appear. Click Import and navigate to the AdventureWorks.jpg file located with the code for this chapter.
21. Click Ok to save the properties. Resize the image
This cover page is pretty simple. It has a blue outline, a title, and a summary of the data. For your report assignments, you could add a background color or graphic and more information. Figure 4-23 shows the top of the page cover.

Figure 4-23. The cover page
The page footer shows the first page of the details as page 2. Since you have a cover page, you may wish for that page to show as page 1. To fix this, follow these steps:
1. Switch back to design view.
2. Delete the pages text box.
3. Add a new text box to the page footer.
4. Right-click the new text box and select Expression.
5. Type in this expression:
="Page " & Globals!PageNumber -1 & " of " & Globals!TotalPages -16. Click OK.
Text Boxes with Data
You have seen that data regions are made of text boxes. You have also seen text boxes with disconnected information such as the report name in a text box. It is possible to populate an independent text box with data from one of the datasets. The text box cannot display detail data; it must display a summary value. To see this, drag the TotalSales field from the SalesSummary dataset to the report canvas. Take a look at the expression property as shown in Figure 4-24. You can find this by right-clicking the text box and choosing Expression.
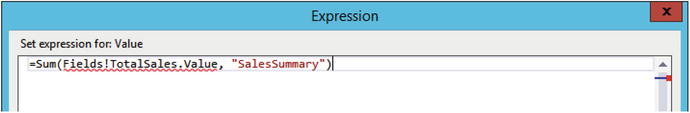
Figure 4-24. The text box expression property
The value has automatically been summarized with the Sum function. A second argument, SalesSummary, is the dataset context.
Calculated Fields
Reports often need calculated fields such as the sales margin. There are many ways to accomplish this. If the data originates in a database system, it is generally possible to add the calculation to the query itself. If that is not possible (e.g., the data source doesn’t support it or the report developer is not able to modify the query), a calculation can be created within a cell. A problem arises, however, if the results of that cell need to be used in an expression in another cell. You can’t nest a cell with an expression within another expression.
If a calculation is needed in multiple expressions, you can add a calculated field to the dataset. To learn how to add calculated fields, follow these steps:
1. From the Solution Explorer, add a new report named Calculated Field.
2. Add a data source to the report named AdventureWorks pointing to the AdventureWorks2016 shared data source. Review Chapter 3 if you need help with this step.
3. Add a new dataset named Sales pointing to the AdventureWorks data source with this embedded query:
SELECT TOP(1000) SOD.SalesOrderID, SOH.OrderDate,SOD.OrderQty, SOD.UnitPrice,P.StandardCostFROM Sales.SalesOrderHeader AS SOHJOIN Sales.SalesOrderDetail AS SODON SOH.SalesOrderID = SOD.SalesOrderIDJOIN Production.Product AS P ON P.ProductID = SOD.ProductID;4. After saving the dataset, right-click and select Add Calculated Field which brings up the Fields page of the Dataset Properties dialog.
5. The dialog shown in Figure 4-25 displays the existing fields with a blank row at the bottom.

Figure 4-25. The Fields page
6. Type in ExtendedCost as the first new Field Name.
7. Click the fx icon to bring up the expression window.
8. In the Category list, select Fields (Sales).
9. In the Values list, double-click the OrderQty field.
10. Add a multiplication symbol (*) after the field name.
11. Double-click the StandardCost field. The final expression is
=Fields!OrderQty.Value * Fields!StandardCost.Value12. Click OK to accept the expression.
13. Click Add ➤ Calculated Field to create another expression called ExtendedPrice. This expression is
=Fields!OrderQty.Value * Fields!UnitPrice.Value14. Click OK to save the expression.
15. Click OK to save the new fields. You will see the new fields in the Sales dataset fields list as shown in Figure 4-26.

Figure 4-26. The new calculated fields
16. Add a table control to the report canvas.
17. Add the following fields to the table: SalesOrderID, OrderDate, OrderQty, StandardCost, ExtendedCost, UnitPrice, ExtendedPrice.
18. Add a new column to the table.
19. Right-click the new data cell and choose Expression.
20. Enter this expression:
=Fields!ExtendedPrice.Value - Fields!ExtendedCost.Value21. Enter Margin in the header cell.
When you preview the report, you will see that the calculated fields work as expected.
The List Control
The list control works similarly to a table, but instead of cells, it has a freeform layout area that is repeated for each row of data. In this section, you will create a new report that uses the list control. Follow these steps to create the report.
1. Add a new report to the project named List Report.
2. Add a new data source to the report called AdventureWorks that is linked to the AdventureWorks2016 shared data source. Review Chapter 3 if you need help with this step.
3. Create a new dataset called ProductList pointing to the AdventureWorks data source with this embedded query:
SELECT P.ProductID, P.Name, PH.LargePhotoFROM Production.Product AS PJOIN Production.ProductProductPhoto AS PP ON P.ProductID = PP.ProductIDJOIN Production.ProductPhoto AS PH ON PP.ProductPhotoID = PH.ProductPhotoIDJOIN Production.ProductSubcategory AS SC ON SC.ProductSubcategoryID = P.ProductSubcategoryIDJOIN Production.ProductCategory AS C ON C.ProductCategoryID = SC.ProductCategoryIDWHERE PP.[Primary] = 1 AND C.ProductCategoryID IN (1,4);4. Add a list control to the report canvas.
5. From the ProductList dataset, drag the ProductID and Name to the list. Text boxes are automatically created to hold the fields.
6. Double the width of the list.
7. Change the list’s BorderStyle Default property to Solid.
8. From the Toolbox, drag an image control to the list.
9. This brings up the Image Properties dialog. Set the properties as shown in Figure 4-27.

Figure 4-27. The Image Properties box
10. Click OK to accept the properties.
11. Expand the size of the image control.
Now when you preview the report as shown in Figure 4-28, you will see the images stored in the database for each product. Some of the products have images that just say “No Image Available.” This is not a feature of SSRS when the image is missing; it’s an actual image.

Figure 4-28. The list report
Setting Report Properties
In Chapter 2, I told you about problems with printing reports. In some cases, the reports print with every other page blank. In this section, you will see how to solve this problem. Follow these steps to produce a report that is too wide to print:
1. In the design view of any report, enable the ruler by right-clicking the report canvas and clicking View ➤ Ruler.
2. Drag the right side of the report so that the report is about 9 inches (22.5 cm) wide.
3. Preview the report.
4. Switch to print layout view.
5. Scroll through the report one page at a time.
Because the report is wider than the default paper size, it prints a blank page after each populated page. If you have controls in place too far the right of the canvas, you will see the report split across pages as well. To solve this problem, you need to make sure that the report width does not exceed the paper where it will be printed.
Often, as the developer works on the report, adding and removing objects can cause the canvas to expand without notice. The first step is dragging in the right side of the report to remove any blank area.
Here are several things you can do to fix report printing.
Change the paper orientation from portrait to landscape.
Modify margins.
Change paper size. Make sure that this will match the paper you will use to print the report.
Adjust column widths.
Figure 4-29 shows the Report Properties dialog. It can be found in the Report menu.

Figure 4-29. The Report Properties dialog box
As a rule of thumb , the width of the report plus the left and right margins should not exceed the width of the paper.
Summary
In this chapter you learned how to create a report from a blank canvas. There are many components that you can add to a report, including headers and footers. The values of almost all properties can be controlled with expressions, and you can add calculated fields to the dataset. It’s always important to make sure that the report will fit on the printed page, and this chapter covered how to adjust the report properties to do so.
In Chapter 5, you will learn how to add grouping levels to reports.