
Not long ago, I was playing games at a table with my four-year-old granddaughter and my grandson who was approaching his second birthday. My smartphone was out of my reach when it audibly announced a couple of text messages. My grandson grabbed the device and handed it across to me while saying, “Your phone! Your phone!” When I let him look at photos on the phone, he immediately started swiping. I know he was imitating the behavior of the grownups around him, but today’s children are exposed to technology from birth.
The world has changed so much over the past few years. We demand access to our data immediately and from wherever we happen to be. Our work and recreation often blend together as we stay connected constantly to social media and our jobs. Whether good or bad, that is the new reality.
Throughout this book, you have created reports using SQL Server Data Tools (SSDT) within Visual Studio. Visual Studio is a developer tool, but end users often want to create their own reports and dashboards. They are also demanding to keep up with data when outside the company intranet on their tablets and phones. In this chapter, you will learn how to create reports using the end-user tool Report Builder. You will also create mobile reports and key performance indicators (KPIs), two new features of SQL Server 2016 available with Enterprise and Developer Editions.
Using Report Builder
Report Builder has undergone several iterations since it was first released with SQL Server 2005. The current version takes advantage of published datasets and report parts to make building a report much easier than within SSDT. It is, however, possible to start from scratch, building a report in a way that is very similar to using SSDT. Report Builder also contains additional wizards not seen in SSDT. There are still the features you learned to use throughout the book such as the property pages and expressions. Table 10-1 lists the differences between SSDT and Report Builder.
Table 10-1. Differences Between SSDT and Report Builder
Feature | SSDT | Report Builder |
|---|---|---|
Target audience | Report developers | Power users |
Look and feel | Visual Studio | Microsoft Office |
Organization | Project based | Individual reports |
Deployment | Deploy or upload | Save |
Report Parts | Deploy report parts | Consume and deploy report parts |
Power users and others in the organization who wish to create their own reports will benefit from having prebuilt report parts, parameter lists, and datasets available to them. That will still create work for the report developers , but it will help ensure that the power users are able to use Report Builder efficiently without needing to be expert T-SQL programmers or to completely understand the source databases.
Chapter 8 described how to deploy reports, including report parts. If you did not follow along during Chapter 8, go back and complete the steps in the sections “Deploying Reports from SSDT ” and “Deploying Report Parts .” To get started with Report Builder, follow these steps:
Launch the web portal.
Create a new folder by selecting New ➤ Folder from the menu.
Type in Ad Hoc Reports as the name and click Create.
Once you have created the folder, click it to navigate inside.
Click New ➤ Paginated Report as shown in Figure 10-1.

Figure 10-1. Create a new paginated report
You may see a message asking if you wish to let the browser allow the application to launch. Click Allow.
If this is the first time you have launched Report Builder, you will see a message telling you to download and install it as shown in Figure 10-2.
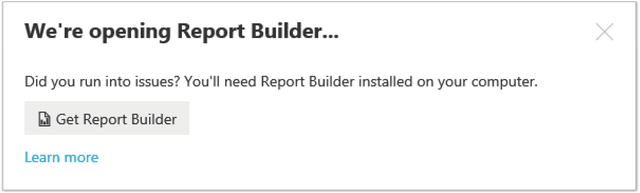
Figure 10-2. Link to install Report Builder
The Get Report Builder link will take you to a page on Microsoft.com where you can download the app. Follow the instructions on the page. I continued to see the message even after I installed Report Builder, but I just dismissed it.
When running the installation wizard, you will be prompted to enter a target server URL (uniform resource locator). Enter the web service URL that you determined in Chapter 8 in the section “Deploying Reports from SSDT.” Figure 10-3 shows an example URL.

Figure 10-3. The Default Target Server property
After the installation, you may need to select New ➤ Paginated Report from the menu once again to actually launch the Report Builder tool.
Agree to any warnings that may appear.
Once Report Builder launches, you will see the New Report or Dataset dialog as shown in Figure 10-4.

Figure 10-4. The New Report or Dataset dialog
Select Blank Report.
You will see the report design area as shown in Figure 10-5.

Figure 10-5. The report design area
You’ll notice that the design area looks very similar to the design area you have seen while developing reports in SSDT. The menu style, however, is more like the ribbon menus found in Microsoft Office. There is no toolbox; you will add controls from the Insert ribbon shown in Figure 10-6.

Figure 10-6. The Insert ribbon
The View ribbon shown in Figure 10-7 toggles the visibility of windows in the application.
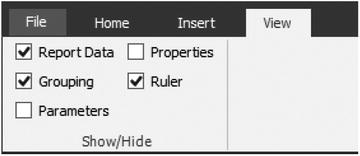
Figure 10-7. The View ribbon
You can use the skills you have learned throughout the book to build reports. You can also use the various wizards that come with Report Builder. In this section you will learn to do something that can’t be done in SSDT, incorporate existing Report Parts into a report. To use Report Parts, you must be connected to a running SQL Server Reporting Services (SSRS) instance. Follow these steps:
From the Insert ribbon, click Report Parts.
This opens the Report Part Gallery window on the right side as shown in Figure 10-8.

Figure 10-8. The Report Part Gallery
By default, you search for report parts based on the name. You can search additional criteria by selecting Add Criteria and selecting an item as shown in Figure 10-9. Select Type.

Figure 10-9. Add Criteria menu
This causes the Type menu to display as shown in Figure 10-10. Select Chart.

Figure 10-10. The Type menu
You can type a name in the Search Name and Description box, but if you just click the magnifying glass icon, all the Chart items will display as shown in Figure 10-11. As long as there are not many published parts, this is fine.

Figure 10-11. The results of the report part search
To remove the Type, click the Type label and select Remove as shown in Figure 10-12.

Figure 10-12. Remove a criteria
Drag one or more of the charts to the report. You will see that the Report Data objects are created automatically as shown in Figure 10-13.

Figure 10-13. The Report Data window
To view the report inside Report Builder, click the Run icon found on the Home ribbon as shown in Figure 10-14.

Figure 10-14. The Run icon
To go back to Design view, click the Design icon in the Run ribbon as shown in Figure 10-15.

Figure 10-15. The Design icon
Once the report is complete, you can either save it to your file system or publish it. Follow these steps to publish the report:
From the File menu, click Save. This brings up a dialog that looks like a file save dialog as shown in Figure 10-16.

Figure 10-16. The Save As Report dialog
Type in a name for your report and click Save. By default, it is saved in the folder from where you launched Report Builder. You can also navigate to other folders as needed.
From the dialog shown in Figure 10-16, you can also save the report definition locally. The File menu shown in Figure 10-17 will let you save and open reports from various locations as you might expect. You can also publish report parts that you have created. The Check For Updates item updates report parts that your report uses in case the originally published report part has been changed.

Figure 10-17. The File menu
From within the web portal, from the Manage menu on a report, you can launch Report Builder to perform edits as shown in Figure 10-18. You can also create a shortcut to Report Builder or pin it to the taskbar.

Figure 10-18. The Edit in Report Builder icon
Report Builder can be used to create datasets as well as reports. You will create several datasets using Report Builder in subsequent sections of this chapter.
Report Builder is a fantastic tool. In fact, some shops use it exclusively for report development. The only downside that I see is that it does not integrate with source control software. You can use source control, but it will be a manual process.
To give a power user the ability to use Report Builder and to publish reports, make sure they are in the site-wide System Users group and are in the Browser, Publisher, and Report Builder roles in any folders where they should be allowed to create reports.
Creating KPIs
In previous versions of SSRS, you have been able to add KPIs, or key performance indicators, to reports. Starting with 2008 R2, you could add the Indicator control to a Tablix cell. Before that, you could use expressions to dynamically control the color of a cell or to display an image to accomplish the same thing with a bit more work. SSRS 2016 gives you the ability to create and display independent KPIs within the web portal. These KPIs can give immediate information about goals and important metrics at a glance without running a report. They depend on having shared datasets in place.
KPIs can be very simple or quite complex depending on the properties you define. You can display just a number, compare a value to a goal, display a status, display a trend, or display some combination of these.
Follow these steps to create a dataset that will be used in a KPI:
In the web portal, navigate to the Datasets folder.
Click New ➤ Dataset which will launch Report Builder. If you see a warning about running the program, click Allow. Report Builder will open ready to create the dataset.
On the Choose a data source connection or model to create a shared dataset page, select the AdventureWorks2016 data source if it is visible in the dialog.
If you do not see the data source you are looking for, click Browse other data sources and navigate to the Data Sources folder to find it as shown in Figure 10-19.
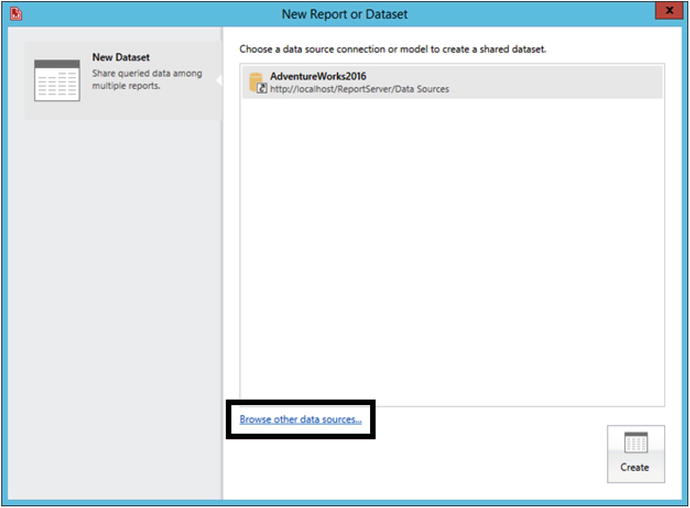
Figure 10-19. Choose or locate a data source
Click Create.
This opens the Query Designer where you can build a query by selecting tables and columns as shown in Figure 10-20.

Figure 10-20. The Query Designer
In this case, you will paste in a query. Click Edit as Text shown in Figure 10-21 to switch from a visual query builder to a text-based query designer window.

Figure 10-21. Click Edit as Text
Paste in the following query:
WITHSales AS (SELECT SUM(TotalDue) AS Sales, MONTH(OrderDate) AS OrderMonth,YEAR(OrderDate) AS OrderYear,LAG(SUM(TotalDue),12) OVER(ORDER BY YEAR(OrderDate),MONTH(OrderDate)) * 1.10 AS QuotaFROM Sales.SalesOrderHeaderGROUP BY MONTH(OrderDate), YEAR(OrderDate)),Comparison AS (SELECT OrderYear, Sales, OrderMonth, Quota,SUM(Sales)OVER(PARTITION BY OrderYear)/SUM(Quota)OVER(PARTITION BY OrderYear) AS PercentOfGoalFROM Sales)SELECT Sales, OrderMonth, Quota,CASE WHEN PercentOfGoal >= .98 THEN 1WHEN PercentOfGoal > .9 THEN 0ELSE -1 END AS StatusFROM ComparisonWHERE OrderYear = 2014;Run the query by clicking the exclamation point icon. The results should look like Figure 10-22.

Figure 10-22. The query results
From the File menu, click Save.
Once the Save as Dataset dialog opens, navigate to the Datasets folder.
Name the dataset 2014 Sales and click OK.
Close Report Builder.
Now that the dataset is published to the web portal, you can create a KPI that uses it. One very interesting aspect of the KPI design page is that you can design how the KPI will look before you connect the data. In fact, when you initially create a KPI, it will be populated with a random value and a visualization. Follow these steps to create the new KPI:
Navigate to the Ad Hoc Reports folder or create it if you did not follow along with the section “Using Report Builder.”
Click New ➤ KPI from the menu.
This opens a page shown in Figure 10-23 where you can see all the properties of the KPI including random values already populating it.

Figure 10-23. The KPI design page
Change the KPI Name to 2014 Sales.
Change the Value format to Abbreviated currency.
Change the Value setting to Dataset field.
Click the ellipsis under Pick dataset field as shown in Figure 10-24.

Figure 10-24. Click the ellipsis
This opens the Pick a Dataset dialog. Navigate to the Datasets folder.
Select the 2014 Sales dataset as shown in Figure 10-25.

Figure 10-25. Select the Sales dataset
This opens a dialog that allows you to select the field and aggregation. Select Sum for the Aggregation.
Select Sales as the field as shown in Figure 10-26.

Figure 10-26. The value properties
Click OK.
Follow the same procedure to populate the Goal. Select the Quota field and the Sum aggregation.
Use the same dataset for the Status. Select the First aggregation and the Status field.
Use the same dataset for the Trend Set. In this case, there is no aggregation. Select the Sales field.
Select the Bar Visualization if it is not already selected. The properties should look like Figure 10-27.

Figure 10-27. The KPI properties
Click Create at the bottom of the screen.
Now when you navigate to the Ad Hoc Reports folder, you should see the new KPI as shown in Figure 10-28. The sales for 2014 are $22.4 million, and that is 3% under the quota. You can also see the trend over the months in the small chart.
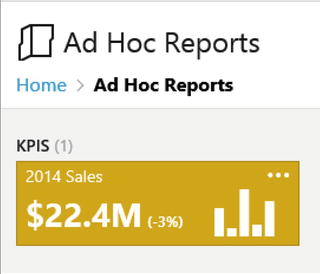
Figure 10-28. The new KPI
KPIs can be linked to other reports or web pages. Go back to the editor by clicking the ellipsis inside the rectangle and selecting Manage. To add a link to a paginated report, select Custom URL for the Related content property found at the bottom of the editor. Paste in the URL copied from one of your reports as shown in Figure 10-29. You can also add a link to a mobile report by selecting Mobile Report. In this case, you will browse to the report to fill in the URL.

Figure 10-29. The Related content properties
If Related content is populated, the link will be visible when clicking the KPI as shown in Figure 10-30.
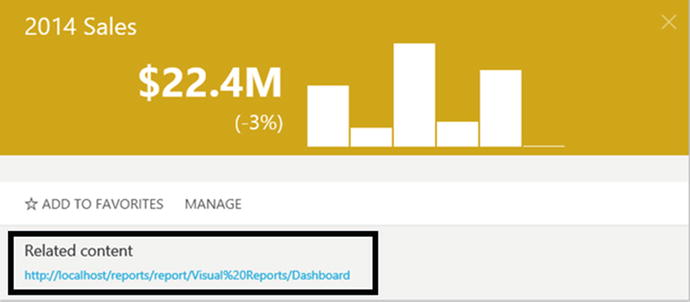
Figure 10-30. The Related content link
Creating Mobile Reports
The new mobile reports feature is by far the most anticipated enhancement found with SSRS 2016. Before the feature was announced at the PASS Summit in Seattle in October 2015, I would have guessed this feature would be available only in SharePoint integrated mode. I am thrilled that Microsoft is making this investment in native mode SSRS. In my opinion, native mode is much easier to configure and manage. I’m glad this great feature is available and simple to manage.
When creating a KPI, sample data is created so that you can see how the KPI will look before connecting it to data. The same is true for the mobile reports. To get started you will need to download and install the new Mobile Report Publisher application. You will find the link by clicking the down arrow and selecting Mobile Report Publisher as shown in Figure 10-31.

Figure 10-31. The Mobile Report Publisher link
Download and install the application according to the instructions found on the linked page. Once it is installed, you can launch it from the web portal or create a shortcut.
Note
At the release of SQL Server 2016, the Mobile Report Publisher also required a patch for a Visual C++ component. If that update is not in place, you will be prompted during the installation. Be sure to download the x86 version.
Just like the KPIs, you will need to create shared datasets to build mobile reports. Mobile reports will also work with data imported from Excel. The downside to Excel data is that it must be refreshed manually.
Note
Starting with 2016, you can store Excel spreadsheets in SSRS. At least with the version available at the time of this writing, the files stored in SSRS could not be used for the mobile reports.
To get started, you will build the mobile report with simulated data by following these steps:
From the web portal, click New ➤ Mobile Report.
OK any warnings about running the application. To avoid this message in the future, create a shortcut to the app instead of launching through the web portal.
You should now see the SQL Server Mobile Report Publisher where you will build the mobile report as shown in Figure 10-32.

Figure 10-32. The mobile report design canvas
From the left side, drag a Selection list to the top and left part of the grid. Drag the right side so that it expands to cover four squares. The Selection list will be used to filter the report.
Drag a Half-donut under Selection list. Expand it so that it covers an area of two-by-two squares.
Drag a Gradient heat map next to the Half-donut. Expand it so that it also covers a two-by-two square area.
Fill the bottom squares with a Category chart. The layout should look like Figure 10-33.

Figure 10-33. The mobile report layout
Click the Preview button. The report should look like Figure 10-34.

Figure 10-34. The mobile report preview
From Selection List 1, select one of the items. You will see the data change automatically.
Click the title of Category Chart 1. The chart will expand to fill the screen.
If you click one of the columns and hold down the cursor, the data for the column will display as shown in Figure 10-35.
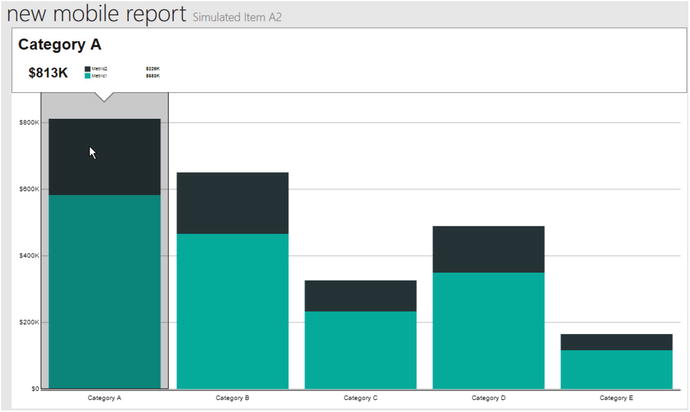
Figure 10-35. The data for one column
Click the Category Chart title to go back to the report.
Click the back arrow to the left of the report title to go to design view.
I hope you are impressed at this point at how you easily you can prototype a report and how interactive it is. The next step is to give each report item a title. Table 10-2 shows the title for each item.
Table 10-2. The Report Item Titles
Item | Title |
|---|---|
Selection List | Year |
Half-Donut | Quota |
Gradient Heat Map | US Sales by State |
Category Chart | Sales by Month |
Follow these steps to set the titles:
Inside the Mobile Report Publisher design view, make sure that the Layout view is selected.
Select an item from the design grid.
Fill in the Title found in the Visual properties section as shown in Figure 10-36.

Figure 10-36. The Title property
Repeat the process for each item.
To make sure that you do not lose your work, save the report definition on your local machine as an rsmobile file.
At this point, you have a design, but it is connected to simulated data. The next step is to connect the report to the SSRS server. Follow these steps.
Click the Server Connections icon shown in Figure 10-37.

Figure 10-37. The Server Connections icon
Fill in the Server address as shown in Figure 10-38.

Figure 10-38. The Connect to a server properties
Unless you are using secure socket layer (SSL) , uncheck Use secure connection. If SSRS is installed on your local workstation, you are probably not using SSL.
Click Connect. The Mobile Report Publisher will remember the connection.
The next step is to add datasets to the web portal that will be used to populate the mobile report instead of using simulated data. Follow these steps to create the datasets:
Minimize the Mobile Report Publisher.
From the web portal, select New ➤ Dataset to launch Report Builder.
Create a new shared dataset named SalesByState using this query and the AdventureWorks2016 data source. The section “Using Report Builder” has instructions on creating a dataset if you need help.
SELECT SUM(TotalDue) AS Sales, vS.CountryRegionName, vS.StateProvinceName,YEAR(OrderDate) AS OrderYearFROM Sales.SalesOrderHeader AS SOHJOIN Person.BusinessEntityAddress AS BEAON BEA.BusinessEntityID = SOH.CustomerIDJOIN Person.Address AS A ON BEA.AddressID = A.AddressIDJOIN Person.vStateProvinceCountryRegion AS vSON A.StateProvinceID = vS.StateProvinceIDWHERE CountryRegionName = 'United States'GROUP BY A.City, vS.CountryRegionName, vS.StateProvinceName,YEAR(OrderDate);Save the new dataset in the Datasets folder.
Create a dataset named Sales with the following query and save it to the Datasets folder :
WITHSales AS (SELECT SUM(TotalDue) AS Sales, MONTH(OrderDate) AS OrderMonth,YEAR(OrderDate) AS OrderYear,LAG(SUM(TotalDue),12,600000) OVER(ORDER BY YEAR(OrderDate),MONTH(OrderDate)) * 1.10 AS QuotaFROM Sales.SalesOrderHeaderGROUP BY MONTH(OrderDate), YEAR(OrderDate)),Comparison AS (SELECT OrderYear, Sales, OrderMonth, Quota,Sales/Quota AS PercentOfGoalFROM Sales)SELECT OrderYear, Sales, 'M' + RIGHT('0' + CAST(OrderMonth AS VARCHAR(2)),2) AS OrderMonth, Quota,PercentOfGoal, DATEFROMPARTS(OrderYear,OrderMonth, 1) AS OrderDate,CASE WHEN PercentOfGoal >= 0.98 THEN 1WHEN PercentOfGoal >= 0.9 THEN 0ELSE -1 END AS StatusFROM Comparison;Close Report Builder.
You should now have the two datasets available for use in the new mobile report. You will connect the datasets to the report objects by following these steps:
Maximize the Mobile Report Publisher. Open the rsmobile file you just created if it is not already open.
Switch to the Data view. You will see a simulated table connected to each object as shown in Figure 10-39.

Figure 10-39. The Data view
Click Add Data as shown in Figure 10-40.

Figure 10-40. Click Add Data
You will have the choice to import from Excel or Report Server as shown in Figure 10-41. Select Report Server.

Figure 10-41. Select Report Server
On the Add Data from Server screen shown in Figure 10-42, select your SSRS instance.

Figure 10-42. Select the server
You will then see all the folders found directly under the web portal Home folder. Click Datasets.
You should now see a list of all the datasets that have been created as shown in Figure 10-43. Click SalesByState .

Figure 10-43. The datasets
Now the SalesByState dataset will be displayed in the Mobile Report Publisher data page instead of the simulated data.
Repeat the process to add the Sales dataset.
While in Data view, select the Year control.
In the Data Properties of the Year control, select Sales for the Keys property and OrderYear for the field next to Keys.
Select OrderYear for the field next to Labels. The Data Properties should look like Figure 10-44.

Figure 10-44. The Data Properties of the Year control
On the right, you will see the section Filter these datasets when a selection is made. Check both SalesByState and Sales.
Select the OrderYear field for each as shown in Figure 10-45.
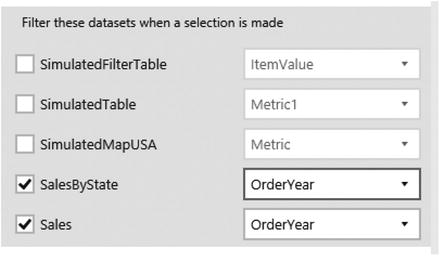
Figure 10-45. The tables filtered by year
Switch to the Layout view. Make sure that the Year list is still selected and turn off Allow select all as shown in Figure 10-46. This will force the control to allow only one value at a time, not all of them.

Figure 10-46. Turn off Allow select all
Switch back to Data view.
Select the Quota control. For the Main Value, fill in the Sales dataset and Sales Field .
For the Comparison Value, fill in the Sales dataset and Quota field.
Click one of the Options buttons, you should see that the data is filtered by the Year control and that the data will be summed as shown in Figure 10-47.

Figure 10-47. The data options for Quota
Click Cancel.
For the US Sales by State control, select the SalesByState dataset and StateProvinceName field for the Keys property. The Keys property should be filtered by Year if you check the Options. If it is not filtered, be sure to select it here and click Done.
Select the Sales field for the Values property. The US Sales by State control data properties should look like Figure 10-48.

Figure 10-48. The US Sales by State data properties
For the Sales by Month control, select the Sales dataset and Order Month for the Series name field properties.
The Main series field is Sales. This control is also filtered by Year, so be sure to confirm that. The data properties should look like Figure 10-49.

Figure 10-49. The Sales by Month data properties
Now that you have the controls connected to actual data, you can remove the simulated tables. Click the gear on the simulated table names and click Remove.
The report name is still set as the default; you can click the name in the design view or click the Settings page to change the Report Title property . Set the title to Sales by Month and State. When you preview the report, it should look similar to Figure 10-50.

Figure 10-50. The populated report
Switch back to design view by clicking the back arrow.
There are three possible views for a mobile report: Master, Tablet, and Phone. The initial work to select the controls must be done in the Master view. You can then design Tablet and Phone reports based on the Master report. In the upper right-hand corner, switch from Master to Phone as shown in Figure 10-51.

Figure 10-51. Switch to Phone
Changing to Phone view displays the design grid as a smaller size with no controls. On the left, you will see all of the controls that were configured in the Master view. You will drag in and resize the controls you wish to see in the Phone view. Figure 10-52shows a possible layout for the phone in Preview mode.

Figure 10-52. Phone preview
While you are viewing the report, try out the dynamic functionality. It still works! To publish the report, you will just save to the SSRS server by following these steps:
Switch back to design view.
Click the Save button.
Select Save to Server.
On the Save mobile report as screen, the name will be filled in along with the server name. Click Browse as shown in Figure 10-53.

Figure 10-53. The Save mobile report as screen
Click the up arrow as shown in Figure 10-54 to navigate to the correct folder location if needed.

Figure 10-54. Click the up arrow
Navigate to the Ad Hoc Reports folder and click Choose Folder.
Click Save to publish the report.
Now when you navigate to the Ad Hoc Reports folder in the web portal, you can run the report. If you resize the browser, the report will resize as well as shown in Figure 10-55.

Figure 10-55. The report automatically adjusts
Each control also has a Drill-Through Target property that you can set to navigate to another mobile report or to any URL. The new applications for running the reports on mobile devices are Power BI for iOS, Power BI for Android, and Power BI for Windows.
Summary
With the new Mobile Reports feature available with Enterprise Edition, Microsoft has released a product that will deliver data anytime, anywhere, and to many devices. Building the reports is easy to do, and interactivity is built in without special coding. Report Builder has been around since 2005. It has improved considerably since then as a tool to enable power users to build their own reports and dashboards. The new KPIs will also provide information to executives with just a glance and a small amount of development time.
This book is meant for beginners, and there is more to learn. Chapter 11 talks about advanced topics you may wish to explore as you gain experience.