
If you have been following along with the demonstrations so far, you know how to create a nice formatted report with multiple grouping levels. Imagine that the department manager who requested reports in Chapter 5 would now like a separate report for each Order Year. Or maybe he or she would like to change the sort order or click a row to drill down to details.
In my career as a database administrator , I often created reports for some of the departments in the firm, and scenarios like this were all too common. I quickly learned to ask questions and anticipate what the requester might ask for next. I rarely created a report without providing options such as parameters .
In this chapter, you will learn how to make reports dynamic. It will save you time and make you look like a SQL Server Reporting Services (SSRS) rock star!
Adding Parameters to Report
Report developers most commonly use parameters to control the data that displays on the report. You saw in Chapter 3 that adding a parameter to the query in the dataset will automatically create a parameter in the report. You can also create parameters manually. In either case, there are a number of elements of the report that can change dynamically as the user runs the report.
In this section, you will start with a completed report and add a parameter to control the data displayed. To get started, follow these steps:
1. Launch SQL Server Data Tools (SSDT).
2. Create a new SSRS report project named Dynamic Reports in a solution named Beginning SSRS Chapter 6.
3. Create a shared data source named AdventureWorks2016 pointing to the AdventureWorks2016 database.
4. Right-click the Reports folder in the Solution Explorer and select Add ➤ Existing Item as shown in Figure 6-1.

Figure 6-1. Adding an existing report
5. Navigate to the Sales by Territory Matrix.rdl file found in the project created in Chapter 5. If you did not create the report, you can use the report from the Code/Download area of the Apress web site (Apress.com).
6. Click Add to import the report as shown in Figure 6-2.

Figure 6-2. Importing the existing report
7. Double-click the report to open it in design view.
8. If there are two Tablix controls on the report, remove the table control and keep the matrix. Use Figure 6-3 as a guide.

Figure 6-3. Remove the table control
9. Preview the report to make sure it runs.
10. Switch back to design view.
11. In the Report Data window, open the properties of the SalesByTerritory dataset.
12. Change the query to
SELECT YEAR(OrderDate) AS OrderYear, C.CustomerID, SUM(TotalDue) AS Sales,T.TerritoryID, T.Name AS Territory, s.Name AS StoreFROM sales.SalesOrderHeader AS SOHJOIN Sales.SalesTerritory AS T ON SOH.TerritoryID = T.TerritoryIDJOIN Sales.Customer AS C ON SOH.CustomerID = C.CustomerIDJOIN Sales.Store AS S ON S.BusinessEntityID = C.StoreIDWHERE YEAR(OrderDate) = @YearGROUP BY C.CustomerID, T.TerritoryID, T.Name,YEAR(OrderDate), S.Name;13. Click OK to save the change.
The difference between this query and the original is the WHERE clause. The query is now filtered by a @Year parameter. Adding a parameter to the query automatically adds a parameter to the report. Expand the Parameters folder in the Report Data window. The parameter should be visible as shown in Figure 6-4.

Figure 6-4. The new parameter
Now when you preview the report, you will be prompted to fill in a year. Try it out by entering several values. As long as you enter a whole number between 2011 and 2014, you will see data when you run the report.
To make sure that the person running the report supplies a valid value, you can provide a dropdown list from which the user can choose.
The Hard-Coded Parameter List
The parameter list can be a hard-coded list or from the results of a dataset. Follow these steps to create a list of years:
1. Right-click the Year parameter and select Parameter Properties.
2. Select the Available Values page.
3. Select Specify values.
4. Click Add.
5. Type in 2011 for both the Label and the Value.
6. Repeat for years 2012, 2013, and 2014. The dialog box should look like Figure 6-5.

Figure 6-5. Adding values to a parameter
7. Click OK. Now when you preview the report, you will have a list to select from as shown in Figure 6-6.

Figure 6-6. The parameter list
The Label property of the parameter is what the end user sees; the Value property is what is passed to the query. In this case, they are the same.
Adding a Parameter List Based on a Query
Most of the time, it makes sense to base the parameter list on a query. This will save time since the list will not need to be manually maintained as the data changes. A parameter list will often be reused, so it makes sense to create a shared dataset instead of an embedded dataset. To create a parameter list based on a query, follow these steps:
1. Switch back to design view.
2. In the Solution Explorer, right-click on the Shared Datasets folder and select Add New Dataset.
3. Name the dataset Territory.
4. The Data Source property should point to AdventureWorks2016.
5. Make sure the Query type is set to Text.
6. Set the Query to
SELECT TerritoryID, Name AS TerritoryFROM Sales.SalesTerritory;7. The Shared Dataset Properties should look like Figure 6-7. Click OK.

Figure 6-7. The Territory dataset
8. Add a new dataset to the report named Territory by using the Report Data window.
9. Choose Use a shared dataset.
10. Select the Territory dataset from the dialog as shown in Figure 6-8.

Figure 6-8. The Territory dataset in the report
11. Click Ok.
12. Bring up the properties of the SalesByTerritory dataset and change the query to
SELECT YEAR(OrderDate) AS OrderYear, C.CustomerID, SUM(TotalDue) AS Sales,T.TerritoryID, T.Name AS Territory, s.Name AS StoreFROM sales.SalesOrderHeader AS SOHJOIN Sales.SalesTerritory AS T ON SOH.TerritoryID = T.TerritoryIDJOIN Sales.Customer AS C ON SOH.CustomerID = C.CustomerIDJOIN Sales.Store AS S ON S.BusinessEntityID = C.StoreIDWHERE YEAR(OrderDate) = @Year AND T.TerritoryID = @TerritoryGROUP BY C.CustomerID, T.TerritoryID, T.Name,YEAR(OrderDate), S.Name;13. This will filter the dataset by both Year and Territory. Bring up the properties of the Territory parameter.
14. Select the Available Values page.
15. Choose Get values from a query.
16. In the Dataset property, select Territory.
17. In the Value Field property, select TerritoryID. This is what is needed in the query.
18. Select Territory for the Label Field property. This is what the end user will see. The dialog box will look like Figure 6-9.

Figure 6-9. The Territory list properties
Note
SSDT was released with a bug affecting shared datasets. Microsoft has promised to fix this in a later release. To correct the issue until then, close the project and navigate to the Territory.rsd file. Change <Dataset> to <Dataset Name=“Territory”>. Save the file and relaunch the project.
After you click OK to accept the parameter, preview the report. The new parameter should look like Figure 6-10.

Figure 6-10. The Territory parameter list
Run the report multiple times selecting different sets of parameters. You will see how the data displayed changes each time.
Default Parameters
Often, there is a set of parameters that are most likely to be chosen. To save the user time, you can add a default for each parameter. When launching the report, it will run once with the default parameters. The user may then select a different set of parameters and run it again if needed. To demonstrate this, follow these steps:
1. Switch to design view.
2. Bring up the properties of the Year parameter and select the Default Values page.
3. Select Specify values.
4. Click Add.
5. Fill in 2012. The dialog should look like Figure 6-11.

Figure 6-11. The Default Value properties
6. Click OK to accept the properties.
7. Add a default value to the Territory parameter using the same method.
8. Supply the value 7. The values must come from the TerritoryID field since that is what is passed to the query.
9. Click OK to accept the properties and preview the report. It should run without supplying parameter values and look like Figure 6-12.

Figure 6-12. The report after running with default parameters
Multivalued Parameters
So far, you have created parameters that allow the user to select one value from a list. It is also possible to create parameters that allow multiple selections. To do this, the query must be modified to select a list of values. Instead of ColumnName = @Parameter, you will use ColumnName IN (@Parameter). Follow these steps to create a multivalued parameter:
1. Switch back to design view.
2. Bring up the properties of the Year parameter.
3. On the General tab, check Allow multiple values.
4. On the Default Values page switch back to No default values.
5. Click OK to save the changes.
6. Bring up the SalesByTerritory dataset.
7. To enable the expression in the WHERE clause to accept a list of values, the operator must change from equals (=) to IN. Change the Query property to
SELECT YEAR(OrderDate) AS OrderYear, C.CustomerID, SUM(TotalDue) AS Sales,T.TerritoryID, T.Name AS Territory, s.Name AS StoreFROM sales.SalesOrderHeader AS SOHJOIN Sales.SalesTerritory AS T ON SOH.TerritoryID = T.TerritoryIDJOIN Sales.Customer AS C ON SOH.CustomerID = C.CustomerIDJOIN Sales.Store AS S ON S.BusinessEntityID = C.StoreIDWHERE YEAR(OrderDate) IN (@Year) AND T.TerritoryID = @TerritoryGROUP BY C.CustomerID, T.TerritoryID, T.Name,YEAR(OrderDate), S.Name;8. Run the report . The Year parameter should look like Figure 6-13.
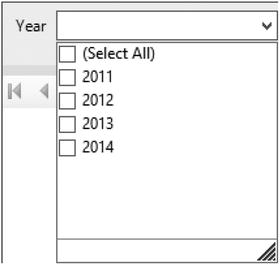
Figure 6-13. The multivalued parameter
You can now select one or more years. Run the report a few times to see how the data changes when you choose different sets of parameters.
Cascading Parameters
Maybe you have noticed that some of the territories do not have sales in 2011. If you select 2011, all of the territories still show up in the parameter list. You can design a parameter so that it is based on the value of another parameter. Follow these steps to adjust the Territory parameter list based on the Year parameter.
1. Switch to design view.
2. Open the properties of the Territory dataset.
3. Switch to Use a dataset embedded in my report.
4. Set the Data source property to AdventureWorks.
5. Set the Query property to
SELECT DISTINCT T.TerritoryID, T.Name AS TerritoryFROM sales.SalesOrderHeader AS SOHJOIN Sales.SalesTerritory AS T ON SOH.TerritoryID = T.TerritoryIDJOIN Sales.Customer AS C ON SOH.CustomerID = C.CustomerIDJOIN Sales.Store AS S ON S.BusinessEntityID = C.StoreIDWHERE YEAR(OrderDate) IN (@Year);6. Click OK to save the changes.
7. Open the Territory parameter properties.
8. On the Default Values page, change to No default value.
9. Click OK to save the changes.
Now when you preview the report, the Territory parameter will be grayed out until the year is chosen. Select 2011. The Territory parameter list will look like Figure 6-14.

Figure 6-14. The Territory parameter list based on 2011 sales
You may have noticed that the query for the Territory parameter is similar to the SalesByTerritory query. Instead of querying for the values needed in the report, it produces a distinct list of territories. The tables used in the query are identical. The expression in the WHERE clause, YEAR(OrderDate) IN (@Year), is filtering on the Year parameter values chosen.
You can cascade even more parameters, each one based on the value of the previous parameter. Be cautious, however, that you do not negatively impact performance. For example, displaying the list of territories from the Sales.SalesTerritory table is much more efficient than the query used to display only those with sales in specifically chosen years. By the way, you can also select all years and the cascading will still work.
Parameter Placement
While in design view, you may have noticed a parameter section above the report. If you don’t see it, right-click the design canvas and select View ➤ Parameters. The parameter section should look like Figure 6-15.

Figure 6-15. The parameter section
This feature is new with SQL Server 2016, and it provides improved flexibility with the parameter layout. In previous versions of SQL Server, you could change the order of parameters by selecting a parameter from the Parameters folder and clicking the up or down arrow as shown in Figure 6-16.

Figure 6-16. The arrows for moving parameters
Changing the positions using the method found in earlier versions of SSRS didn’t always produce optimum placement. There was no control over which parameters end up on the same line. If you had a report with starting and ending dates, you may have wanted to keep the dates on the same line, but it wasn’t always possible.
Beginning with SQL Server 2016, up to six parameters can display across. You can now control the placement of the parameters by dragging them to different cells. For example, drag the Territory parameter below the Year parameter. The parameter pane should look like Figure 6-17.

Figure 6-17. The parameters rearranged
When you preview the report, the parameters look like Figure 6-18.

Figure 6-18. The parameters in preview mode
By default, there are two rows for parameters. To increase this, right-click within the parameters area while in design view and select Insert Row Above or Insert Row Below. Be cautious, however, when moving parameters around if you are using cascading. Make sure that the parameters needed first are also displayed first to avoid a dependency error.
Parameter Data Types
So far, you have worked with numeric parameters, although the default type is text. You can also have parameters of other data types, and the parameter control will change based on the type. Follow these instructions to see the additional data types:
1. Make sure that the latest changes to the Sales by Territory Matrix report have been saved. You can click the Save icon or run the report.
2. Right-click Sales by Territory Matrix report and select Copy.
3. Right-click the project name, Dynamic Reports, and select Paste.
4. Change the name of the new report to Data Types.
5. While in design view, right-click the Parameters folder and select Add Parameter.
6. This brings up the Report Parameter Properties dialog box. Name the parameter DateParameter.
7. Fill in Date Parameter for the Prompt. The prompt is what the user will see when running the report.
8. Change the Data Type to Date/Time. The General page will look like Figure 6-19.

Figure 6-19. The General properties of the parameter
9. Click the Default Values page.
10. Select Specify Values.
11. Click Add.
12. Instead of typing in a value, click the fx symbol as shown in Figure 6-20 to open the expression dialog box.
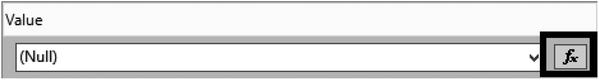
Figure 6-20. The expression button
13. Fill in =Today() for the expression and click OK.
14. Click OK to accept the properties.
15. You should now see the Date Parameter in the grid with a calendar icon as shown in Figure 6-21.

Figure 6-21. The new Date Parameter
16. Preview the report.
17. If the Date Parameter is grayed out, select values for Year and Territory. The current date should be automatically chosen. You can either type in or use the calendar picker control to select another date. At least in the build I am using, the Date/Time parameter must be in the first position in order to be available before the other parameters are selected.
18. Switch back to design view and add another parameter.
19. Name this parameter TrueFalse with Prompt True or False.
20. Change the Data Type to Boolean and click OK.
21. This will add a set of radio buttons as shown in Figure 6-22.

Figure 6-22. The new True or False parameter
You can also set a default for the Boolean data type by adding True or False on the Default Values page.
The default data type is Text which lets the user type in anything. If you would like to restrict the input to a number, you can select the Integer or Float data types. The control will look like a regular text box but will accept only whole numbers or decimals, respectively.
Using Stored Procedures
SQL Server stored procedures, also called stored procs or sprocs , are objects that contain T-SQL scripts. These stored procs may contain programming logic such as loops, may update data, or may just contain a SELECT query. Stored procs are often used in SSRS datasets and they may require parameters by definition. If you are using a network SQL Server , you may need to contact your database administrator for rights to create a stored proc. Otherwise, to create a stored procedure, follow these steps.
1. Using SQL Server Management Studio (SSMS), connect to your SQL Server.
2. Click New Query which opens a query window.
3. Enter this code into the query window by typing or copying it from the Source Code/Download area for this book on the Apress web site ( www.Apress.com ). The code creates a stored proc that requires one argument, TerritoryID. It then returns the results filtered by that TerritoryID.
USE AdventureWorks2016;GOIF OBJECT_ID('usp_SalesByTerritory') IS NOT NULLDROP PROC usp_SalesByTerritory;GOCREATE PROC usp_SalesByTerritory @Year INT, @TerritoryID INT ASSELECT YEAR(OrderDate) AS OrderYear, C.CustomerID,SUM(TotalDue) AS Sales,T.TerritoryID, T.Name AS Territory, s.Name AS StoreFROM sales.SalesOrderHeader AS SOHJOIN Sales.SalesTerritory AS T ON SOH.TerritoryID = T.TerritoryIDJOIN Sales.Customer AS C ON SOH.CustomerID = C.CustomerIDJOIN Sales.Store AS S ON S.BusinessEntityID = C.StoreIDWHERE YEAR(OrderDate) = @Year AND T.TerritoryID = @TerritoryIDGROUP BY C.CustomerID, T.TerritoryID, T.Name,YEAR(OrderDate), S.Name;4. Click Execute in the menu bar or press F5 to create the proc as shown in Figure 6-23.

Figure 6-23. The Execute icon
5. Click New Query. In the new query window, test the proc by running the following code:
usp_SalesByTerritory @Year = 2011, @TerritoryID = 6;
Using a stored proc in a dataset is not very different from using a query. Follow these steps to create a report that uses the new stored proc.
1. Add a new report to the project named Stored Proc.
2. Add a data source pointing to AdventureWorks2016 and name it AdventureWorks.
3. Add an embedded dataset to the report named SalesByTerritory. Use the AdventureWorks data source.
4. Change the Query type to Stored Procedure.
5. When you do, the dialog changes. You will see a dropdown box listing the stored procedures in the database . Select usp_SalesByTerritory. The dialog should look like Figure 6-24.

Figure 6-24. Using a stored procedure in the dataset
6. Click OK to create the dataset. It also adds the parameters to the report automatically.
7. Drag a matrix control to the report canvas.
8. Add OrderYear to the Columns cell.
9. Add Sales to the Data cell. It will automatically sum.
10. Add TerritoryID to the Rows cell. The layout should look like Figure 6-25.

Figure 6-25. The matrix design
When you preview the report, you will be prompted for an OrderYear and TerritoryID. Fill in 2012 and 7 to see data.
There is an issue with using stored procedures, however. If you switch the parameters to accept multiple values, the report will no longer work. That’s because the stored proc is expecting one integer value for each parameter, not a list of variables. To see the problem, follow these steps.
1. Switch back to design view.
2. Modify the Year parameter so that it allows multiple values.
3. On the Available Values page, select Specify values and add 2011 through 2014.
4. Click OK to save the changes.
5. Preview the report.
6. Select more than one year. Enter 7 for the TerritoryID.
7. When you click View Report, you will see an error message as shown in Figure 6-26.

Figure 6-26. The error when multiple values are chosen for OrderYear
As a workaround, the parameters for the stored proc must be changed to accept string values instead of just integers. Then, logic must be added to the proc to handle a comma delimited list instead of one value for each parameter. A function is often used to parse the list and save the values into a temporary table. Follow these steps to change the stored proc so that it can accept multiple values.
1. In SSMS, run this code to create a function to change a list of values into a table. You can copy the code from the Source Code/Download area for this book on the Apress web site ( www.Apress.com ).
USE AdventureWorks2016;GOIF OBJECT_ID('udf_ListToTable') IS NOT NULLDROP FUNCTION dbo.udf_ListToTable;GOCREATE FUNCTION dbo.udf_ListToTable(@List NVARCHAR(4000),@Delimiter NCHAR(1))RETURNS @ValueList TABLE (ListItem NVARCHAR(50)) ASBEGINDECLARE @Pos INT;DECLARE @Item NVARCHAR(50);--Find the first delimiterSET @Pos = CHARINDEX(@Delimiter,@List);--loop until all items are processedWHILE @Pos > 0 BEGIN--insert the current itemINSERT INTO @ValueList(ListItem)SELECT LEFT(@List,@Pos-1);--remove current item from the stringSET @List = SUBSTRING(@List,@Pos+1,4000);--find the next delimiterSET @Pos = CHARINDEX(@Delimiter,@List);END;--add the last itemINSERT INTO @ValueList(ListItem)SELECT @List;RETURN;END;GO2. Click Execute to run the code and create the function.
3. Click New Query to open another query window.
4. Run this code in SSMS to modify the stored procedure.
USE AdventureWorks2016;GOIF OBJECT_ID('usp_SalesByTerritory') IS NOT NULLDROP PROC usp_SalesByTerritory;GOCREATE PROC usp_SalesByTerritory@YearList NVARCHAR(4000), @TerritoryIDList NVARCHAR(4000) ASDECLARE @Years TABLE (OrderYear INT);DECLARE @Territories TABLE(TerritoryID INT);--Save the lists into table variablesINSERT INTO @Years(OrderYear)SELECT ListItemFROM dbo.udf_ListToTable(@YearList,',');INSERT INTO @Territories(TerritoryID)SELECT ListItemFROM dbo.udf_ListToTable(@TerritoryIDList,',');--Change the query to use IN lists in the WHERE clauseSELECT YEAR(OrderDate) AS OrderYear, C.CustomerID,SUM(TotalDue) AS Sales,T.TerritoryID, T.Name AS Territory, s.Name AS StoreFROM sales.SalesOrderHeader AS SOHJOIN Sales.SalesTerritory AS T ON SOH.TerritoryID = T.TerritoryIDJOIN Sales.Customer AS C ON SOH.CustomerID = C.CustomerIDJOIN Sales.Store AS S ON S.BusinessEntityID = C.StoreIDWHERE YEAR(OrderDate) IN (SELECT OrderYear FROM @Years)AND T.TerritoryID IN (SELECT TerritoryID FROM @Territories)GROUP BY C.CustomerID, T.TerritoryID, T.Name,YEAR(OrderDate), S.Name;GO5. Click Execute to run the code.
You now have a function that can be used whenever you run into this problem. The stored procedure uses the new function to insert each list into a table variable. Then, in the WHERE clause, the table variables are used as IN lists. If your source of data is hosted on SQL Server 2016, you can use a new built-in function called STRING_SPLIT() instead of the custom function used in this example.
Now it is time to make a few changes to the report to work with the changes to the stored proc. Follow these steps:
1. Switch to design view of the Stored Proc report.
2. Bring up the properties of the SalesByTerritory dataset.
3. On the Query page, click Refresh Fields. This will create new parameters that match the updated stored procedure, @YearList and @TerritoryIDList.
4. Click OK.
5. Expand the Parameters folder.
6. Delete the Year and TerritoryID parameters. They are no longer needed with the modified stored proc.
7. Create a new dataset named Territory. It should point to the shared Territory dataset.
8. Bring up the properties of the TerritoryIDList parameter.
9. Check Allow multiple values.
10. On the Available Values page, select Get values from a query.
11. Select Territory from the Dataset list.
12. Select TerritoryID from the Value field list.
13. Select Territory from the Label field list.
14. Click OK to accept the changes.
15. Open the properties of the YearList parameter.
16. Check Allow multiple values.
17. On the Available Values page, enter 2011 through 2014 as hard-coded values.
18. Click OK to save the properties.
19. Drag the parameters to the left in the parameter pane. The two deleted parameters left empty spaces.
20. Preview the report; it should now work as expected when multiple values are chosen.
Stored procedures are often the preferred type of command when working in SSRS. They allow reuse of code and also can be created to be more secure than just allowing the user to run queries against the tables. The main downfall is that the report developer may not have rights to create or modify stored procs in the database.
Controlling Properties
While filtering the data is a very common reason to make a report dynamic, you can also control almost any property dynamically. To do this, you will take advantage of expressions based on the data or parameters. You saw an example of this in Chapter 4 where you set up alternating background colors.
You can control any property that shows Expression as a property choice or with the fx icon next to the property. This section covers several examples.
Visibility
You can show or hide objects such as tables or rows with an expression, but the value of the expression must be known before the report actually displays. Follow these steps to use a parameter to control visibility.
1. Add a new report to the project named Visibility.
2. Add two rectangle controls to the report.
3. Change the Fill Color of the two rectangles to a dark color such as Blue.
4. Alter the sizes so that one is a large rectangle and one is a small square. The report layout should look like Figure 6-27.

Figure 6-27. The report with two rectangles
5. Add a parameter to the report named ShowRectangle with the Prompt property set to Show Rectangle.
6. Change the Data type to Boolean.
7. Click OK to create the parameter.
8. Add a second parameter named ShowSquare with the Prompt property set to Show Square.
9. Change the Data type to Boolean.
10. Click OK to create the second parameter.
11. Right-click the rectangle shape and select Rectangle Properties.
12. Switch to the Visibility page.
13. Change the When the report is initially run property to Show or hide based on an expression.
14. Click the fx icon to open the Expression dialog. Notice that you will be setting an expression to hide the rectangle as shown in Figure 6-28. This may seem counter-intuitive, so always keep it in mind when creating an expression for this property.

Figure 6-28. Set the expression for Hidden
15. In the Category list, select Parameters. You will see the two parameters listed in the Values list as shown in Figure 6-29.

Figure 6-29. The parameters of the report in the Expressions dialog box
16. Double-click ShowRectangle.
17. If the expression evaluates to True, the rectangle will be hidden. Change the expression to
=Not Parameters!ShowRectangle.Value18. Click OK to dismiss the Expression dialog and then OK to dismiss the Rectangle Properties dialog.
19. Repeat the process for the small square shape, selecting the ShowSquare parameter.
20. Preview the report to test it. Figure 6-30 shows an example.

Figure 6-30. The report showing just the square
Another way to control visibility is often used with groups. This was demonstrated in the wizard report in Chapter 2 where you could click a plus sign to expand the details.
You will set a property on a group to toggle the visibility based on a cell found in the parent group . To learn how to do this manually, follow these steps:
1. Import the Sales by Territory 2.rdl file from the Chapter 5 project by right-clicking Reports and selecting Add ➤ Existing Item.
2. Double-click the report to open it in design view.
3. Right-click the TerritoryID cell and select Text Box Properties.
4. Change the Name property to TerritoryID if it is not set that way already.
5. Click OK to accept the change.
6. In the Row Groups window, right-click the Details group. This is the innermost child group.
7. Select Group Properties.
8. Select the Visibility page.
9. Select Hide and check Display can be toggled by this report item.
10. In the dropdown list, select TerritoryID. The properties should look like Figure 6-31.
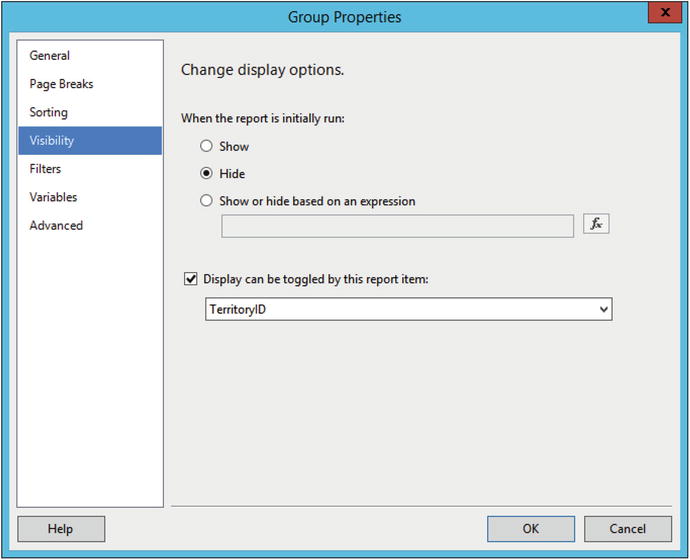
Figure 6-31. The visibility settings
11. Click OK to accept the properties.
12. Make sure that the OrderYear cell is named OrderYear as was done with TerritoryID.
13. Right-click the TerritoryID group and select Group Properties.
14. On the Visibility page, select Hide and make this group toggle by OrderYear.
15. Click OK to accept the properties. You do not need to set the property on the OrderYear group since it is the highest level parent.
16. Preview the report. It should look like Figure 6-32.

Figure 6-32. The report with collapsed sections
When you click the plus sign, next to the year, you will see the territories for that year. When you click the plus sign next to the TerritoryID, you will see the details for that territory as shown in Figure 6-33.

Figure 6-33. The expanded report
The main drawback of this method is that you can only expand one group at a time. That’s a lot of clicking to display all the details. A better solution would be to add parameters to the report to control the visibility of the groups. To do this, follow these steps :
1. In Solution Explorer, create a copy of the Sales by Territory 2 report. Name the new report Visibility by Parameters.
2. Add a parameter named DisplayTerritories. The Prompt should be Display Territories and the data type should be Boolean. Set the default value to False.
3. Add another parameter named DisplayDetailRows. The Prompt should be Display Detail Rows. It should also be a Boolean with a default of False.
4. Open the Group Properties of the Details group.
5. On the Visibility page, uncheck Display can be toggled by this report item.
6. Select Show or Hide based on an expression. The Dialog should look like Figure 6-34. The TerritoryID field may still be visible as the report item, but disabled.

Figure 6-34. The Group Properties dialog
7. Click the fx icon to open the Expression dialog.
8. Add this expression:
=NOT Parameters!DisplayDetailRows.Value9. Click OK to accept the expression and OK again to close the Group Properties dialog.
10. Repeat the process for the TerritoryID group. This time the expression is
=NOT Parameters!DisplayTerritories.Value11. Preview the report. It should look like Figure 6-35 before you change the parameters.

Figure 6-35. The report with summary only
Notice that the plus signs next to the years are gone. If you change Display Territories to True and run the report again, this time the Territories will all display. To view the details, both parameters must be set to true.
Formatting
Almost any property can be controlled by an expression. The expression may include a field from the dataset. To demonstrate, you will bold the font of the territory rows where the sales are over $2,000,000. Follow these steps:
1. Switch to design view of the Sales by Territory 2 report.
2. Select the territory row.
3. In the Properties window, locate the FontWeight property.
4. From the dropdown list, select <Expression> which opens the Expression dialog box.
5. Add this expression:
=Iif(SUM(Fields!Sales.Value)>=2000000,"Bold","Default")6. Click OK to save the change.
7. Preview the report and expand to see the territories. The report will look like Figure 6-36.

Figure 6-36. The territories with sales at $2,000,000 or more are in bold
The Iif function , also called inline if, takes three arguments. The first is an expression to test. If the expression returns true, then the second argument is returned. If the expression returns false, then the third value is returned. The value returned by the expression is used as the property value. In this example, the word Bold is returned when the sales are at least $2,000,000.
Interactive Sorting
Sorting can be controlled using a property of the cells in the header row. In my experience, it doesn’t work well with collapsing sections. Follow these steps to enable interactive sorting:
1. Create a copy of Sales by Territory 2. Change the name to Interactive Sort.
2. Double-click the new report in the Solution Explorer to open it in design view.
3. Clear the visibility settings for both the TerritoryID and Details groups. Set both back to Show and uncheck Display can be toggled by this report item.
4. Preview the report to make sure that the groups and details are all visible.
5. Switch back to design view.
6. Right-click the Order Year header cell and select Text Box Properties.
7. Select the Interactive Sorting page.
8. Check Enable interactive sorting on this text box.
9. Under Choose what to sort, select Groups.
10. From the dropdown box , select OrderYear. This is the section to sort.
11. From the Sort by list, select [OrderYear]. The dialog box should look like Figure 6-37.

Figure 6-37. The Interactive Sorting properties
12. Click OK to accept the properties.
13. Set the interactive sorting property for the Territory ID header cell. The sort should apply to the TerritoryID group and sort by TerritoryID.
14. Set the interactive sorting property for the Customer ID header cell. The sort should apply to the Detail rows. Sort by CustomerID.
15. Set the interactive sorting property for the Store header cell. The sort should apply to the Detail rows. Sort by Store.
16. Preview the report. You will see arrow icons next to each sortable column as shown in Figure 6-38.

Figure 6-38. The sorting icon
Click the icons to change the sort order of the report. The first time you click, the sort will change to ascending. Click again to change to descending order. You can change the Order Year column from descending to ascending. You can switch the sort of the details between Customer ID and Store.
Creating Drill Through Reports
This chapter is full of great ways to make your reports dynamic, and the sky is the limit. There is one more feature to show you that is frequently requested. This is the ability to click a cell in a report and automatically navigate to another report containing the detail rows.
Follow these steps to create a detail report :
1. Add a new report to the project named Sales Details.
2. Add a data source to the report named AdventureWorks that points to the AdventureWorks2016 shared data source.
3. Add an embedded dataset to the report named SalesDetails. It should point to the AdventureWorks data source.
4. The query should be
SELECT C.CustomerID, SalesOrderID, OrderDate, TotalDue,T.TerritoryID, T.Name AS Territory, s.Name AS StoreFROM sales.SalesOrderHeader AS SOHJOIN Sales.SalesTerritory AS T ON SOH.TerritoryID = T.TerritoryIDJOIN Sales.Customer AS C ON SOH.CustomerID = C.CustomerIDJOIN Sales.Store AS S ON S.BusinessEntityID = C.StoreIDWHERE YEAR(OrderDate) = @Year AND T.TerritoryID = @Territory;5. Add a table control to the report.
6. Populate the table control with these fields: CustomerID, Store, SalesOrderID, OrderDate, and TotalDue,
7. Bold the header row and format the TotalDue cell as currency. The design should look like Figure 6-39.

Figure 6-39. The detail layout
8. Drag the table to the upper left and tighten up the report canvas.
9. Add a Report Page Header to the report.
10. Drag the Report Name into the header from the Built-In Fields folder.
11. Change the font size to 14 pt and expand the width of the text box.
12. Drag the Year parameter to the header.
13. Drag the Territory field from the SalesDetails dataset into the header. Since this is outside the table, it will pull the first value from the dataset. This works because the report is filtered by TerritoryID so there is only one Territory value available. The report layout should resemble Figure 6-40.

Figure 6-40. The report layout
At this point, it makes sense to run the report to make sure it works. When you do, just enter 2011 and 3 for the parameters. Instead of displaying parameter lists, this report will receive the values from another report. The end user will always run the report by clicking the summary report and should never need to see the parameters. Follow these steps to hide the parameters:
1. Switch back to design view of the detail report.
2. Open the properties of the Year parameter.
3. Change the Select parameter visibility property to Hidden and click OK to accept the change.
4. Repeat the process for the Territory parameter.
The next step is to add an action to a cell in a summary report. Follow these steps to add an action:
1. Create a copy of the Sales by Territory Matrix report. Name it Sales Summary.
2. Double-click the Sales Summary report to open it in design view.
3. Right-click and bring up the Text Box Properties of the cell that is at the intersection of the TerritoryID and OrderYear. Figure 6-41 shows the cell to select.

Figure 6-41. The cell to select
4. Select the Action page.
5. Select Go to report.
6. In Specify a report, select Sales Details.
7. Click Add. This adds a parameter from the Sales Details report to map to the Sales Summary report. The Name property is the parameter needed by the Sales Details report. In the Value property, you will map something from the summary report to pass through to the detail report.
8. Select the Year parameter in the Name column.
9. Select OrderYear from the Value list.
10. Click Add once more. This time, map Territory to the TerritoryID field. The dialog should look like Figure 6-42.

Figure 6-42. The Action properties
11. Click OK to accept the properties.
Now when your run the report click any of the total sales values on the Territory row. The Sales Details report will open already filtered based on the value you selected. To navigate back to the Sales Summary report, click the Back to Parent Report button.
Summary
In this chapter you saw many ways that you can make your report dynamic based on user interactivity or the data itself. You can give the user the ability to filter the data or modify properties with parameters. Text boxes and other controls can be formatted by expressions based on the data. There are no limits to what you can do.
In Chapter 7, you will learn about the visual elements that can be added to reports. These elements can be used to make a report more informative with just a glance or to create a dashboard.