
Business owners want to see the unit cost of every product. They also want the entries to be grouped by product line and see the highest unit cost for each product line. At the end of the report, they want to see the average unit cost for the whole range.
Create a simple list report with Product | Product line, Product | Product name and Sales Fact | Unit Cost as columns.
- We will start by examining the Unit Cost column. Click on this column and check the Aggregate Function property.
- Set this property to Average.
- Add grouping for Product line and Product names, by selecting those columns and hitting the GROUP button from toolbar.
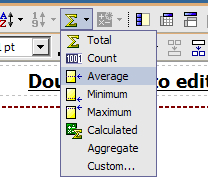
- Click on the Unit Cost column and click on the Aggregate button from toolbox. Select Aggregate option from the list.
- Now click again on the Aggregate button and choose Average option.
- This will create footers shown as follows:
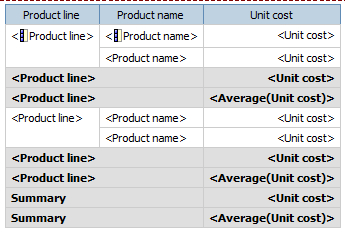
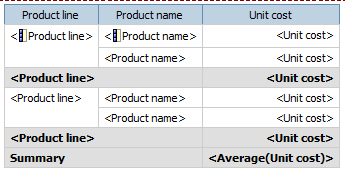
- Now delete the line with Average (Unit cost) measure for Product line. Similarly, delete the line with <Unit cost> measure from Summary. The report should look like this:
- Click on the Unit cost column and change its rollup aggregate function to Maximum.
- Run the report to test it.
In this recipe, we have seen two properties of the data items related to aggregation of the values.
We first examined the aggregation property of unit cost and ensured that it is set to average. Remember that the unit cost here comes from the sales table. The grain of this table is sales entries or orders. This means there will be many entries for each product and their unit cost will repeat.
We want to show only one entry for each product and the unit cost needs to be rolled up correctly. The aggregation property determines what value is shown for unit cost when calculated at product level. If it is set to TOTAL, it will wrongly add up the unit costs for each sales entry. Hence, we are setting it to AVERAGE. It can be set to MINIMUM or MAXIMUM depending on business requirements.
In order to show the MAXIMUM unit cost for product type, we create an 'Aggregate' type of footer in step 4 and set the Rollup
Aggregation to Maximum in step 8.
Note
Here we could have directly selected MAXIMUM from the 'Aggregate' drop-down toolbox. But that creates a new data item called Maximum
(Unit Cost). Instead, we ask Cognos to aggregate the number in footer and drive the type by rollup aggregation property. This will reduce one data item in the Query Subject and Native SQL.
We also need to show the overall average at the bottom. For this we have to create a new data item. So, we selected unit cost and created an 'Average' type of aggregation in step 5. This calculates the Average (Unit Cost) and places it on the product line and in the overall footer.
We then deleted the aggregations that are not required in step 7.
The rollup aggregation of any item is important only when you create the aggregation of 'Aggregate' type. When it is set to automatic, Cognos will decide the function based on data type which is not preferred.
It is good practice to always set the aggregation and rollup aggregation to meaning function than leaving as 'automatic'.