
In this recipe, you will learn about the new conditional styles property introduced in Report Studio which, in my humble opinion, is the best feature added to make a report author's life less tedious.
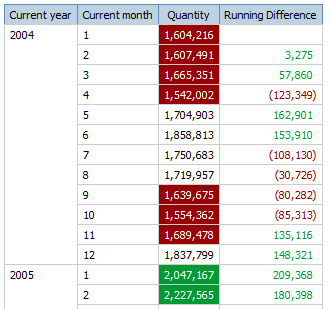
Assume that the following report needs to be formatted such that quantities below 1.7M will be highlighted with red background and those above 2M should be green. Also, we need the negative values for Running Difference (month-on-month) to be shown in red and in a bracket.

As shown in previous recipe, this would have needed us to define two conditional variables. Then attach each to the corresponding column as 'Style variable' to define the styles. With one more such numeric column, the author had to define one more variable and repeat the exercise. Let's see how the new conditional styling feature solves this problem.
Write a new report similar to the one shown in the previous screenshot. Use Report Studio version 8.3 or later.
- Select the Quantity column on report page.
- Open the new Conditional Styles dialog from Properties pane.Alternatively, you can also click on the Conditional Styles button
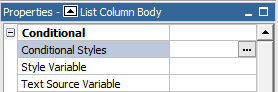
 from the toolbar.
- Create a New Conditional Style.

- Choose quantity to base the conditions on.
- Define three values (0, 1.7 million and 2 million) by hitting the new value button on bottom left corner. This will look like the following:

Also choose corresponding styles for each range as shown in the screenshot. Give appropriate name, like Quantity colors in this case.
- Similarly, define the negative values for Running Difference column to be shown in red.

- Run the report to test it.
With this new feature, we can now define styling for any column without explicitly defining the conditional variable. The styling can be based on the values on the column itself (8.3 onwards) or some other column (8.4 onwards).
Also, defining actual formatting (font, color, border, and so on) for different conditions is now done within one dialog box. This is more author-friendly than traversing through the conditional variable pane and choosing each condition.