
8. Implications for Production: Disrupted Process Flows
Filmmaker Stanley Kubrick warned us what a future might look like where humans and their computing machines find themselves in conflict, as the mission-fixated HAL conspired against his mortal crewmates in 2001: A Space Odyssey. But computer processing power and the performance capabilities of computer-driven automation are exciting considerations today. A tour of a modern manufacturing facility equipped with robotic automation and guided vehicles can astound and amaze the casual observer. Following such a visit, you might think that humans’ role in the production process is being marginalized as advanced technology takes over. However, humans and machines more often than not work hand-in-hand. When competition between humans and machines does ensue, the victor is not always so obvious at the outset. Consider, for instance, when the world’s top national soccer teams descended on London for the 2012 Summer Olympics. There they played using an Adidas ball known as the Albert. Was it produced in the same highly automated factory as the notoriously unpredictable Jabulani ball used at the 2010 World Cup in South Africa? No. The company called on its supplier in Sialkot, Pakistan, a remote city in the Kashmir foothills, to make the Albert for the London games. In Sialkot, workers hand-stitch balls for the top competitions, which require the highest levels of quality and craftsmanship. Not long ago, Sialkot produced 75% of the world’s soccer balls. But in recent years, its global share has dropped to around 40% as more balls are produced via automation elsewhere. Yet as the global appetite for soccer balls grows each year, companies like Adidas, Nike, and Puma continue to seek out the craftspeople of Sialkot to meet the demand for their premium-quality balls. In fact, the volume of high-quality soccer balls produced in the rural region motivated the installation of a private world-class airstrip that can support large cargo aircraft to ship balls wherever the biggest games are played.1 The repetitive juxtaposition of technology and people is but one major production-related theme impacted by the macrotrends we study in this book. This chapter explores the various ways in which the macrotrends affect the manufacturing function, as well as strategies for enacting value-added production in rapidly transforming supply chains.
Manufacturing and the Larger Economy
Traditionally, no activity has signaled vibrancy in an economy like manufacturing. For centuries, the ability to “make stuff” has been among the most influential forces in a nation’s economic vitality. Particularly throughout the past three centuries or so, the premise of being a “world power” has been closely tied to the ability to compete globally in the creation of valued products. Hungarian economist Nicholas Kaldor’s work on the relationship between manufacturing output and a society’s quality of life is cited as a classic treatise in support of domestic production. “Kaldor’s First Law,” conceived in the late 1960s, conclusively demonstrated that GDP growth occurs fastest when the share of manufacturing-to-nonmanufacturing work in a nation is higher. It also showed that consumers’ quality of life grows roughly in parallel with the GDP.2 However, being the world’s best “consumption society” is hardly a game plan for manufacturing competence and economic prominence. Rather, consumption is the reward for gaining economic prowess. There is reason to worry that less production is occurring in many developed nations, including the U.S. Much concern is being voiced in the U.S. over manufacturing’s shrinking share of the GDP.3 It is feared that outsourcing considerable production activity to distant locations guts manufacturing capacity and causes a loss of critical skills needed to produce goods.
Additionally, for the last decade or so, we have seen the relative impact of manufacturing on overall domestic production wane. A countervailing argument can be made that Kaldor was wrong because he never anticipated that knowledge could generate more value than production. Critics say that a knowledge economy leads to more prosperous outcomes, and the immediate data seems to support their views. U.S.-based Apple nets 30% profits on iPads produced in China, where the final assembler Foxconn claims merely 2% of the product’s revenues.4 In fact, South Korean component suppliers claim a substantially higher share (7%) than Foxconn’s stake earned for the final assembly process.5 Consider also the macroeconomic data point illustrated by Thailand, where the nation leads world production in dollars per capita but is ranked only in the 70s in GDP. This flies somewhat in the face of traditional wisdom on the value of manufacturing within domestic borders. We see the issue as a matter of control: The societies that will be able to drive manufacturing in other locations as a result of their aggregate knowledge development will prosper the most.6 Regardless of its location, production continues to serve as the engine for the world economy, and it will continue to do so for as long as value to consumers is embedded in physical goods.
Simply performing—or controlling—value-added work is insufficient to generate economic outcomes, because a viable marketplace must be willing to consume the output. The matter of enticing demand for one’s output makes for an interesting history lesson. Consider the British Industrial Revolution, which is widely regarded as the most significant societal transformation since the domestication of plants and animals. England’s ability to transform textile industries from manual to machine-driven processes that were highly efficient, precise, and replicable helped the country move from an agrarian economy to the world’s first truly industrialized nation. Innovations such as the use of interchangeable parts within products and machinery led costs of production to decrease markedly, while opportunities for manufacturing employment simultaneously exploded. A second revolution was triggered by developments in power-generation technologies such as steam engines and, ultimately, the internal combustion engine and electric power generation. These inventions dramatically boosted production speed and efficiency. The combination of lower costs for goods and rising incomes led to the greatest, most sustained rise in living standards the world had ever known. The paradigm spread virally from England to Western Europe, North America, and Japan throughout the balance of the second millennium. Manufacturing skill touched every aspect of daily life for the citizens of these societies, but it has sometimes resulted in conflict among nations (such as the two world wars of the 20th century).
The production of steel serves as a proxy for comparing nations’ productivity, given steel’s integral role in both consumer and business goods. Steel production represents a bellwether measure primarily due to its position as a critical input for staple industries, such as construction and heavy manufacturing. Table 8.1 lists the top ten nations in crude steel production in five-year increments from 1991 to 2011. These numbers are effective proxies for the combination of material resource wealth, processing capability, relative economics, and regulatory environment that mark leading-edge industrialized nations. The table points out the dominance of Chinese steel producers over the past decade, with China providing nearly 46% of the world’s supply of steel, up from less than 10% in 1991. While global supply has more than doubled over this 20-year time frame, China’s capacity has increased nearly tenfold, outpacing its nearest rival (Japan) by 635%. International competitors make claims of undue government support in the form of an undervalued currency; export rebates; generous financing arrangements; and lax regulations in the areas of environment, labor, and safety. Yet the rise of China is not the only compelling story to be found in the data. Also noteworthy is the rise of nations like India, Brazil, and Turkey as major players in the global steel industry. These nations can support their own growing appetite for steel and also provide export volumes for global production.
Table 8.1. Top Ten Nations in Crude Steel Production, 1991–2011
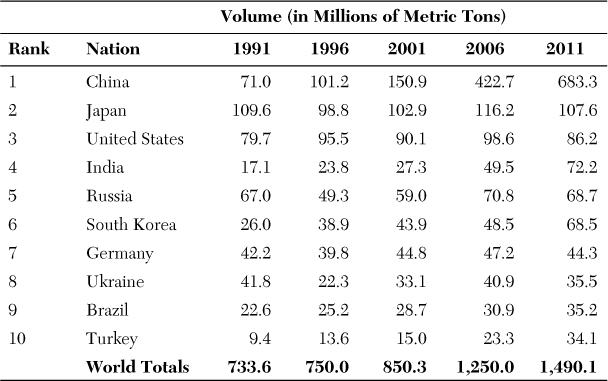
Source: World Steel Association
Yet crude steel production is only part of the story. Table 8.2 shows the export volumes of semifinished and finished steel products during roughly the same 20-year period. (Note that we must look at the top 11 exporting nations in order to include the United States in this analysis.) Examining these processed steel products indicates how nations move up the industrial food chain, by not only producing raw materials but also adding value to them. Meanwhile, examining exports indicates that the supply exceeds the demands of the home nation and that the supply of steel is competitive in the world markets. Several stories emerge from this analysis. Starting at the top, we see that Japan regained its leadership in the most recent reading, edging out China. Japan enjoyed substantial growth in exports during the 1996–2001 period, surpassing Germany and Russia for the global lead at the time. However, it’s hard to find the words to describe China’s rise in the 2001–2006 time period, because it increased 710%! Global demand for steel increased markedly in the boom years of the early 2000s. This led many to accuse China of unfairly (and illegally) dumping steel supplies on the world market, saturating supply, and putting international competitors in peril due to falling prices. The problem was worsened during the “Great Recession” that choked demand in the United States and Europe beginning in 2008. Although China reduced export volumes in the most recent reading, the nation continues to feed its own demand. This demand is greater than the world has ever seen, with substantial volumes available to supply more than 10% of the global export volume.7
Table 8.2. Top Exporters of Semifinished and Finished Steel Products, 1991–20108,9
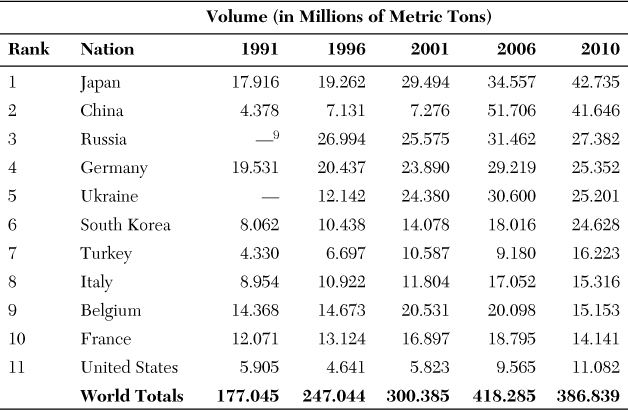
Source: World Steel Association
We again ask: Does such manufacturing dominance yield wealth for a nation and its people? Let’s look at one common measure of national wealth, per-capita GDP (the nation’s GDP divided by the population). Based on 2011 data, the United States ranks 13th ($48,442), and China ranks well below, with a per-capita GDP of merely $5,430 (but an amazing increase of 1,650% over the past 20 years). So do the oil-rich nations of Qatar, Kuwait, the UAE, and Saudi Arabia top the rankings? They are near the top, but tiny Luxembourg stands tall among its wealthy neighbors of Western Europe. With a per-capita GDP of $115,038, it earns 17% more (on a per-capita basis) than #2 Norway, and it is ahead of the oil states of the Middle East. How did it get there? The nation is something of a financial center in Europe,10 but it exports large volumes of steel and is home to ArcelorMittal, the world’s largest steel company. The company earned 2011 revenues of almost $94 billion and ranked #70 on Fortune’s Global 500 list. It is the nation’s largest employer and its largest contributor to exports. Housing this manufacturing powerhouse is instrumental in the nation’s wealth creation. Yet if ArcelorMittal is to maintain its position in an intensifying marketplace, it must successfully navigate the churning waters of global competition. To explore the strategies of individual companies in the face of these massive shifts, we look to the manufacturing-driven supply chain strategies employed by firms today.
Manufacturing-Driven Supply Chain Strategies
Given the central role that manufacturing plays in the supply chain, the strategies employed by manufacturers set the tone for supply chain execution throughout the network of companies. This suggestion is largely based on two driving factors:
• Manufacturing is often the most capital-intensive and value-inducing process in the supply chain.
• Manufacturing represents a common bottleneck in supply chain operations.
Taken together, these observations imply that manufacturing capabilities can be a key competitive differentiator, separating the most capable providers from the pack.
A common way to define the strategy for an entire supply chain is to identify the strategic decoupling point. This is the point up to which product is pushed through the supply chain based on sales forecasts and beyond which it is pulled based on actual end-user demand. Where manufacturing lead times prove long and insufficient to meet customers’ needs in a timely manner, the various entities of the supply chain will be forced to generate forecasts (usually independent of one another) and place orders in advance of end-user demand. This stockpiling of inventory at the various tiers of the supply chain is characteristic of a “pure push” strategy of anticipatory supply chains described in Chapter 6, “Implications for Supply Chain Planning: Demand and Supply Uncertainty.” The strategic decoupling point in this case is located at the store shelf, where consumers are greeted by waiting inventory. Great faith is placed in the forecast. It drives not only production, but also the procurement of raw materials through the materials requirements plan (MRP) and the allocation of finished-goods (FG) inventory through the distribution resource plan (DRP). Such strategies are best used when demand is relatively “known” or when speculation is relatively safe and inventory carrying costs are low. Holding too much inventory is of minimal concern under these circumstances, compared to the risks of stocking out.
However, the pure push strategy is usually quite inflexible and blind to market changes. With execution throughout the supply chain based on forecasts, the pure push strategy is susceptible to bad planning. As a result, it is prone to the ills of excess inventory when demand drops and extended stockouts when demand surges unexpectedly. Despite these concerns, marketers of grocery and household goods deploy the pure push in stocking stores in advance of demand. Given that the traditional supermarket stocks, on average, 38,718 different items,11 the challenge of achieving forecast accuracy across this range is obvious. By some estimates, grocery stores average only 80% in-stock performance at the item level. Out-of-stocks are often covered up by ready substitutes, in which a different flavor, count, or pack size can be chosen. The big fear of the manufacturer is that the consumer will switch to a competitor’s offering. Meanwhile, the fear of the retailer is that the consumer will take issue with the stockout and switch stores.
One way that companies in the supply chain seek to counter the uncertainties of demand in a pure push system is to abandon independent planning efforts and collaborate on the forecast. Such efforts help bolster confidence in the forecast by virtue of making it a team effort while providing supply chain partners with an opportunity to identify and remedy supply issues. However, this does nothing to shift the strategic decoupling point further upstream from the retail store shelf. Furthermore, it raises the ante on the shared forecast by generating one “best guess” that all parties buy into. To boot, it does not necessarily improve the accuracy of the forecast. For these reasons, the synchronized push strategy remains the domain of products either believed to have stable demand or for which the costs of stockout are so great that companies are willing to invest in sizeable inventories and position them throughout the supply chain.
Such a supply chain system is more aware of changes in demand. However, the make-to-stock provision employed by manufacturers in this arrangement often remains too inflexible to change the speed and direction of operations. Besides, it does nothing to shift the strategic decoupling point any further upstream in the supply chain, keeping it firmly entrenched at the retail location, with inventory waiting patiently for buyers. Historically, this has been the case with U.S. automotive manufacturers. They operated highly integrated supply chains with dedicated suppliers and company-owned and -franchised dealers, and point-of-sale data flowed freely. Yet the long lead times and inflexibility in operations prevented more pull-based orientations to provide the in-stock performance that auto buyers had come to expect. Although it’s less common around the world, traditional U.S. auto buyers want to kick the tires and test-drive the very automobile they will subsequently take home. This requires the dealer to stock a seemingly endless assortment and quantity of vehicles to achieve a match between their supply and the customer’s demand. Given the countless options available on vehicles today, you can readily recognize that it would be almost impossible to achieve a perfect match between the customer’s expectations and a nearly infinite assortment of automobiles. Despite those odds, it is not uncommon for automakers and dealers in the United States to hold more than 100 days’ supply, totaling more than 3 million vehicles nationwide sitting idle in anticipation of demand. Inventory has been known to balloon so much among the Big Three U.S. automakers that dealers and regional distributors cannot accommodate the deluge. The massive parking lots at the Michigan State Fairgrounds are used to house the excess.
To address this imbalance, many companies today are embracing the philosophy and principles of Lean Manufacturing. Inspired by the Toyota Production System and made famous by authors James Womack and Daniel Jones,12 Lean Manufacturing seeks to reduce various forms of waste, or muda, that are created by poorly defined or ill performing processes. In their influential book Lean Thinking, Womack and Jones succinctly state that lean-ness is achieved by the following:
• Specifying value by product
• Identifying the value stream for the product
• Making the product flow
• Pulling from the customer
• Pursuing perfection in operations
The persuasion of the “Lean” argument has been considerable and it is widely embraced, with nearly 70% of U.S. manufacturers claiming to pursue Lean as of 2007.13 This number is likely to exceed 90% today. Also, application of Lean principles has spread widely into every walk of life. Devotees can be found among manufacturers of virtually every product category; providers of industrial and consumer services; and even government, schools, and charitable organizations, with resounding success. Yet the fourth principle in Womack and Jones’ list often leads to confusion and keeps Lean’s fullest potential from being realized. When suggesting that companies “pull” (demand) from the customer, the question that often arises is, “Who is the customer?” Is it the firm’s immediate customer, the end user, or even an internal customer (the person who receives your work)?
Manufacturers often seek to pull demand from their immediate customer, which is typically a distributor or retailer. This equates to using a forecast to preposition inventory at the distribution point that serves the manufacturer’s customer(s). When inventory is depleted at the distribution location, these supplies are replenished in kind. This presents the appearance of a “pull” system, but the replenishing supply is still speculative. In other words, it is produced before actual orders, making this provision nothing more than a glorified make-to-stock system. The strategic decoupling point for this “Lean-push” supply chain does shift one tier upstream, however, from the retail shelf to the distribution location that serves the retailer. You need look no further than Toyota’s operations in North America to see this kind of system in action. Even though Toyota is the benchmark in the industry, with the most flexible mass production system in the market, it still relies on forecasts to determine the initial supply of vehicles to be allocated to distributors and dealers. This so-called “supermarket supply” is then replenished based on actual consumer sales and the market reads provided by Toyota Motor Sales, the distribution company serving the Toyota Motor Corporation in North America.14 But if you visit a Toyota dealer, you will find more than a day’s supply at the lot. In fact, currently Toyota keeps 49 days of supply on hand. This is below the industry average but still is a very large and valuable supply.15 Some of this supply comes from domestic production locations. The rest (namely, cars sporting the Lexus brand) originates outside the United States—particularly Japan, Canada, and Mexico. The longer lead times associated with imported vehicles generally result in greater supplies of these vehicles.
Toyota has experimented in recent years with a variation of its conventional manufacturing and distribution arrangement. Arguably, this arrangement is considerably more “lean” than the primary method Toyota employs in making and selling cars in the United States. Beginning in 2002, Toyota launched the Scion brand in the U.S. market. This brand was designed to appeal to the younger market segment of individualism-minded Generation Y consumers. They were believed to be willing to wait a few days to receive a “custom-built” automobile based on a menu of options and standard pricing. Initially, three models (the xA, xB, and tC) were offered in a limited number of colors and options, ranging from the substantive (sport shocks and struts) to the cosmetic (an adhesive Scion logo to adorn the hood). Shoppers were encouraged to go online to “Build your own” automobile. What surprised many a prospective buyer was that the “custom-built” vehicle that was promised to arrive in 2 to 14 days was not produced, for the most part, in the United States. Rather, generic versions of the cars were built in Toyota City, Japan, and shipped to major distributors located in the U.S. (Tacoma, Washington, for customers in the western U.S. and Jacksonville, Florida, for eastern U.S. customers). Consumer orders were then placed against the supply of generic vehicles stocked at major distributors located at these two port cities. The distributor customized the vehicle in this provision of “forward-positioned postponement,” delaying the final form of the product until a firm customer order was in hand. Aside from the make, model, and color, other aspects of the car could take shape close to the consumer, allowing for precise accommodation of demand within a few short days. This strategy has come to be known as configure-to-order (CTO) manufacturing, or mass customization. Postponing the product’s final form until a firm customer commitment is in hand reduces the risks faced by the manufacturer in serving diverse customer needs.
Configure-to-order is a common practice in the consumer electronics industry. Consider the often-cited case of Hewlett-Packard serving customers in Western Europe. Customers of the company’s printers could be quite varied depending on their location, given the different languages spoken in the region as well as the different electrical voltages used in each nation. The printer itself, however, was uniform in its engineering and function, whether used in England, France, or Germany. To accommodate the diverse needs in the most economical fashion, the company elected to perform the packaging operations close to the market. Once printers arrived in Rotterdam via ship from the Asian supply location, they were maintained in a generic state until customer orders were placed. With the aid of a capable third-party logistics provider, HP bundled the proper power pack, software, and instruction manual to support the customer. This provision still relies on a forecast for production of the base configuration and the supplies for customization. Yet the level of speculation and the economic risks of a poor forecast are lower when the company is holding generic work-in-process (WIP) inventory rather than finished goods. Though the strategic decoupling point in supply chains for mass-customized products remains at the distribution center, the provision of generic WIP reduces the risk of costly forecast errors. The forecast is aggregated at the platform level (across several different varieties that customers might seek) and involves a lower-cost generic item that has yet to see its final value-added processes and associated costs. Granted, the cost of production is often higher in these arrangements, because assembly occurs in two locations. (The factory produces the generic item, and the forward-positioned distribution location performs the customization.)
Many supply chain experts advocate the application of Lean principles in the provision of generic items and the rapid, or agile, support of customization as soon as the customer order is received. This blending of Lean and Agile strategies results in “Leagile” supply chains. Revisiting our Scion example, Toyota is Lean in the production of the generic Scion car. When the car arrives at the U.S.-based distributor, the company reacts agilely to accommodate the specific configuration that suits the customer. Configure-to-order postponement may also occur at the factory, rather than at the downstream distribution location. When this is the case, the manufacturer is offsetting the risk of misallocating inventory (inventory located in the wrong location) by adding lead time to the delivery service. The goods will have to be transported from a central manufacturing facility, as opposed to the region’s distribution point.
Centralized postponement extends the strategic decoupling point upstream one tier in the supply chain, allowing the pull of the end customer to reach the factory. In fact, the role of the distribution facility might be diminished to the point of dismissing it from the logistics network and delivering directly to customers from the factory. Conducting all value-added processing in one location can reduce costs, yet transportation economies may be lost when products are shipped directly to customers from a central location. This represents another version of the Leagile strategy and, like forward-positioned postponement, it is employed by several prominent companies. Foremost among them are Dell and its successful direct-to-consumer model, which was described in Chapter 6. Golf equipment manufacturers, like TaylorMade and Calloway, custom-build golf clubs to their customers’ specifications, including club head angle, loft, shaft length, and grips at their manufacturing facilities. Package-to-order services also belong in this class of manufacturing strategy. In these instances, the customization occurs in the bundling and/or packaging of the goods, with the core product remaining unchanged. Delaying the commitment of the product’s final packaging can help mitigate the proliferation of stock-keeping units (SKUs) that differ only in their packaging.
The final strategy to find common usage among modern manufacturers is the make-to-order (MTO) provision. MTO is the least speculative of all strategies presented here, because the manufacturer does not commit to work-in-process or finished goods until the customer order is placed. The manufacturer may still generate a forecast, however, to allow for the procurement of raw materials and to plan capacities. Both would help reduce the extensive lead times associated with MTO operations. Note, however, that despite recognizing that more operational steps must be performed from the time of order receipt until delivery (such as building product and delivering it from a central plant location), customers sometimes lack this understanding. They expect service that competes with other companies’ speculation-based models, which have inventory prepositioned in the supply chain. With this in mind, MTO companies emphasize agile response to orders. When a manufacturer stops short of committing to the raw materials on hand for the impending orders, the company is employing a buy-to-order (BTO) strategy that is even less speculative than MTO, where inventory of raw materials is on hand. MTO and BTO strategies essentially extend the pull of the end customer all the way back to the manufacturer’s first-tier suppliers. This strategy ordinarily is reserved for products that are described as “impossible to forecast” or for which the risk of inventory obsolescence is too great for the company to bear. Aircraft, missiles, industrial and home construction projects, and custom-built automobiles fall into this category.
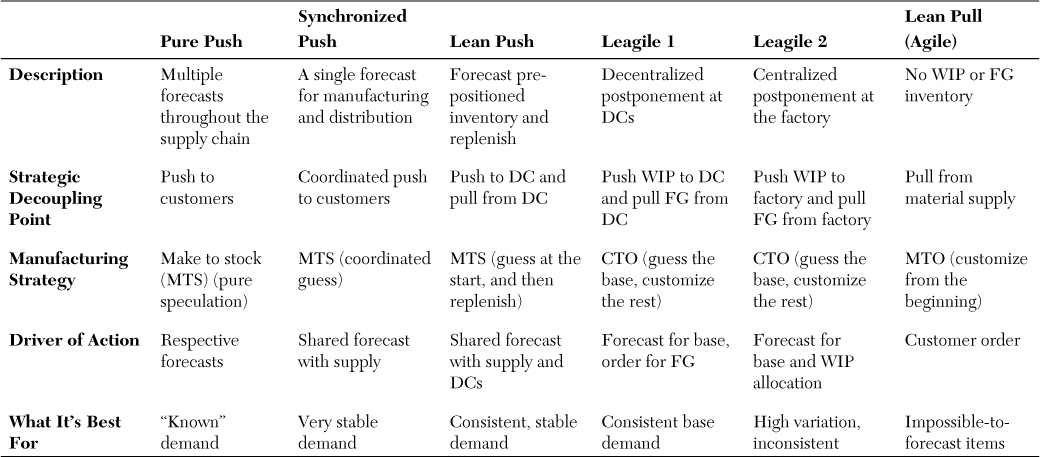
Table 8.3 and Figure 8.1 summarize these manufacturing-driven supply chain strategies and note their key distinctions. The strategic decoupling point distinguishes the push/pull boundaries of each supply chain strategy and the drivers of action. These strategies accommodate the range of products and diverse customer demands found in modern supply chains. Though they have served us well in the early phases of globalization, they will undergo considerable adaptation with the advent of the macrotrends we feature in this book. We continue by reviewing the influences of the macrotrends on the production function in general and the strategies companies will employ to address the transformative changes that lie ahead.

Figure 8.1. Manufacturing-driven supply chain strategies
Table 8.3. Summary of Manufacturing-Driven Supply Chain Strategies
Manufacturing Strategies for the Future Production Manager
Like planning and procurement strategies, manufacturing will undergo immense stresses resulting from the macrotrends. Manufacturing strategies must accommodate the rising demand and heterogeneous needs resulting from global population growth and migration. Companies will seek to capture less-developed markets that heretofore were regarded as unattractive, marginal, or unviable. Our examples of soft drink manufacturers entering India and automakers investing in the Chinese market spell out this realization. Global connectivity and socioeconomic leveling underscore the growth potential in less-developed markets as the consuming classes grow exponentially in these regions and gain greater awareness of and interest in a broader array of products and services. The stresses on manufacturing and supply chains are elevated in contending with natural resource scarcity and constraints of the physical environment. Geopolitical and social systems that are at odds with one another add to the challenge. The macrotrends hold major implications for demand and supply that will force transformation among manufacturing strategies. Table 8.4 outlines how specific forces have given rise to change, the implications for supply chain management, and the ensuing production considerations.
Table 8.4. Macrotrend Impacts, Supply Chain Implications, and Production Function Responses


Depending on how a company regards the macrotrend forces described in Table 8.4, the future could be laden with fears and challenges or robust in opportunity. What becomes clear is that the role of production in the transformation will be central. The means by which goods and services achieve their function and form utility have been and will continue to be a focal point in supply chains for all companies. Not to be lost in the conversation is the fact that the transformation in production will affect manufacturers and nonmanufacturers alike. Upstream parties to manufacturers, like commodity suppliers (agricultural, mining, fishing), will face a whole new set of challenges when their customers (the manufacturers) impart new demands. Consider a food processor that seeks to sell its products in Europe, where consumers fear the use of genetically modified organisms (GMOs) in the foods they consume. Can the farmer verify that the seeds used to grow the grains contained no GMOs? Can the farmer produce evidence that the grains’ integrity was maintained throughout the storage and distribution activities on the farm and beyond? Most farmers in the Americas today do not manage the genetic identity of grains independently or ensure that the handling and transportation of GMO and non-GMO grains are carried out in wholly separate supply chains. Similarly, vendors are not held fully accountable for the environmental and sustainability aspects of their materials and processes—yet. When sustainability reporting becomes mandated by governments and expected by consumers, manufacturers will require transparency in their vendors, and the definition of “quality” will expand to include these broader aspects.
Downstream of the conventional manufacturer, parties will expand their roles in the production process as well. Retailers that “own” the touch with the final consumer will continue to market private-label goods. But the more exciting developments will be found in other means of generating form utility as the roles of these downstream parties evolve. Logistics service providers have taken great strides in recent years to expand beyond storing and transporting goods. Large global providers like UPS, Exel/DHL, and Ryder, along with specialized providers like Kane Is Able and LeanCor, are gladly assuming the roles of final assemblers and packaging specialists. By performing postponed product customizations close to the customer market, these service providers can engender Leagile strategies to support the manufacturer’s diverse market needs. In one interesting development, steamship line companies are developing a service provision that would allow light assembly and packaging to occur while goods are being transported over the long ocean routes. In this way, the three weeks of transit time, during which merchandise is sitting idle, awaiting delivery to the import port location, could be put to better use. As many experts point out, however, the long and sometimes uncertain transits do not aid in lean and agile response. As Lean gurus Womack and Jones pointed out, “Lean thinkers don’t like large, slow ships. They like small, fast trucks.”16
Postponement and customization will proceed even further downstream in the supply chain, however. Retail locations also will increasingly be looked to as locations for postponement. Perhaps most exciting, though, is the prospect of consumers themselves performing postponement activities at home. In this way, brand marketers are de-industrializing product processing through at-home customization. Arguably, this personalizing of products was established by Apple with the applications (apps) that consumers can download to their iPhones and iPads. Apple provides the basic product platform, and the individual user customizes it at home to meet his or her unique needs. This may seem like a subtle shift in roles, but it marks a great departure in the conventional wisdom around value-added processing in the supply chain. Mass customization provides a limited assortment of product variety, and ultimate control over the product’s form and function rests with the manufacturer. But consumers are exhibiting greater interest and even are demanding to take control. Consumers in emerging markets will be quick to embrace this notion and exert their own influence on the products they buy and adapt.
These developments lead to one conclusion: Creating form utility is no longer the sole domain of “manufacturers.” Other supply chain members, including consumers, are creating form utility. To go further, informed and empowered consumers are seeking control over the form and functionality of the products they buy. Taken to an extreme, traditional manufacturers could be disintermediated, or bypassed, in favor of creating customized goods in the home. One small indication of this tendency might be found in the growing number of homebrewers, or people who craft their own beers and wines. The American Homebrewers Association boasts 30,000 members and claims that there are one million homebrewers in the United States. The trend could expand greatly with the advent of disruptive technologies, like 3-D printing. Such technologies could be game-changers—not only as they relate to the development of prototypes and engineering mock-ups for global corporations, but perhaps also as micro-assembly machines used in small shops and even homes in the future. This is among the many technology developments the world will watch closely in the next two decades as the evolution of humans and machines advances and the supply chains are called on to adjust to and accommodate the macrotrends.