
F
fabrication – A manufacturing process that transforms materials to make parts to go into an assembly.
Fabrication includes manufacturing processes (such as molding, machining, forming, or joining) and not assembly. Small businesses that specialize in metal fabrication are called fab shops. A semiconductor fabrication facility is called a wafer fab and makes integrated circuits (silicon chips).
See assembly line, manufacturing processes, respond to order (RTO).
facility layout – The physical organization of processes in a facility. ![]()
The layout of a factory should minimize the total cost of moving materials between workcenters. Some processes must be located next to each other, while others cannot be located next to each other due to heat, sound, or vibration. Other issues include cycle time, waste, space efficiency, communications, safety, security, quality, maintenance, flexibility, customer waiting time, aesthetics for workers, and aesthetics for customers.
The layout problem is not unique to manufacturing. Service businesses, such as hospitals and banks, have the same issues. Retailers use planograms to help layout retail stores. Similar layout problems are common in other design contexts, such as laying out an integrated circuit. Experience engineering issues are important when the customer contact is high.
The three basic types of facility layouts include the process layout (functional layout), the product layout, and the fixed-position (project) layout. Each of these is discussed briefly below.
Process layout (functional layout) – A layout that groups similar activities together in departments or workcenters according to the process or function that they perform. For example, all drills might be located together in the drill workcenter. The process layout is generally used in operations that are required to serve a wide variety of customer needs, so the equipment must serve many purposes and the workforce needs to be highly skilled. Although process layouts offer high flexibility, they are relatively inefficient because of long queues, long cycle times, and high materials handling costs. The best example of a process layout is a job shop. The major concerns in a process layout are cycle times, utilization, order promising, routing, and scheduling.
Traditional industrial engineering approaches to improving a process layout include process analysis, graphical methods, computer simulation, and computer optimization. CRAFT (Computerized Relative Allocation of Facilities Technique) is a heuristic approach developed by Buffa, Armour, and Vollmann (1964) that uses a heuristic (non-optimal) approach to solving a quadratic assignment formulation of the facility layout problem.
Product layout – A product layout arranges activities in the sequence of steps required to manufacture or assemble a product. Product layouts are suitable for mass production or repetitive operations in which demand is relatively steady and volume is relatively high. Product layouts tend to be relatively efficient, but not very flexible. The best example of a product layout is an assembly line. The major concern in a product layout is balancing the line. In designing an assembly line, many tasks (elements) need to be assigned to workers, but these assignments are constrained by the target cycle time for the product and precedence relationships between the tasks (i.e., some tasks need to be done before others). The line balancing problem is to assign tasks to workstations to minimize the number of workstations required while satisfying the cycle time and precedence constraints. Many operations researchers have developed sophisticated mathematical computer models to solve this problem18. The line balancing problem becomes less important when the organization can use cross-trained workers who can move between stations as needed to maximize flow. Cellular manufacturing is a powerful approach for converting some equipment in a process layout into a product layout for families of parts. Mixed model assembly allows some firms to justify having product layouts that are not dedicated to a single product. See the cellular manufacturing and mixed model assembly entries.
Fixed-position layout (project-layout) – A fixed-position layout is used in projects where the workers, equipment, and materials go to the production site because the product is too large, fragile, or heavy to move. This type of layout is also called a project layout because the work is usually organized around projects. The equipment is often left on-site because it is too expensive to move frequently. Due to the nature of the work, the workers in a fixed position layout are usually highly skilled. The most familiar examples of a fixed position layout are the construction of building or house. However, a fixed position layout is also used in shipbuilding and machine repair. The major concerns with a fixed-position layout are meeting the project requirements, within budget, and within schedule. See the project management entry.
The Theory of Constraints literature suggests that the focus for all layouts should be on the bottleneck process. See the Theory of Constraints (TOC) entry.
See 5S, assembly line, cellular manufacturing, continuous flow, CRAFT, cross-training, experience engineering, flowshop, focused factory, job order costing, job shop, lean thinking, line balancing, mixed model assembly, planogram, plant-within-a-plant, process design, process map, product-process matrix, project management, spaghetti chart, Theory of Constraints (TOC), workcenter.
facility location – The physical site for a building. ![]()
The facility location problem is to find the best locations for the organization’s facilities (warehouses, stores, factories, offices). The facility location problem is often defined in terms of minimizing the sum of the incoming and outgoing transportation costs. In a retail context, the problem is often defined in terms of maximizing revenue. In the service context, the problem is defined in terms of meeting some service criterion, such as customer travel time or response time for customer needs.
Facility location theory suggests that the problem can be broken into finite and infinite set location models. The finite set location models evaluate a limited number of locations and determine which one is best. The infinite set location models find the best x-y coordinates (or latitudes and longitudes) for a site (or sites) that minimize some mathematical objective function. The center-of-gravity and numeric-analytic location models are infinite set location models. The gravity model for competitive retail store location and the Kepner-Tregoe Model are finite set location models.
Some location models assume that vehicles can travel directly across any geography, while others assume that vehicles are constrained to existing transportation networks. Some models assume that cost is proportional to the distance or time traveled, whereas others include all relevant costs, including tariffs, duties, and tolls.
See center-of-gravity model for facility location, gravity model for competitive retail store location, great circle distance, greenfield, Kepner-Tregoe Model, numeric-analytic location model, process design, supply chain management, tariff, warehouse.
factor analysis – A multivariate statistical method used to reduce the number of variables in a dataset without losing much information about the correlation structure between the variables.
Factor analysis originated in psychometrics and is used in behavioral sciences, social sciences, marketing, operations management, and other applied sciences that deal with large datasets. Factor analysis describes the variability of a number of observed variables in terms of a fewer number of unobserved variables called factors, where the observed variables are linear combinations of the factors plus error terms. To use an extreme example, a study measures people’s height in both inches and centimeters. These two variables have a correlation of 100% and the analysis can be simplified by combining the variables into one “factor” without losing any information.
Factor analysis is related to Principal Component Analysis (PCA). Because PCA performs a variance-maximizing rotation of the variable space, it takes into account all variability in the variables. In contrast, factor analysis estimates how much of the variability is due to common factors. The two methods become essentially equivalent if the error terms in the factor analysis model can be assumed to all have the same variance.
Cluster analysis and factor analysis are both data reduction methods. Given a dataset with rows that are cases (e.g., respondents to a survey) and columns that are variables (e.g., questions on a survey), cluster analysis groups cases into clusters and factor analysis groups variables into factors. Using the survey example, cluster analysis groups similar respondents and factor analysis groups similar variables.
See cluster analysis, Principal Component Analysis (PCA).
factorial – A mathematical function denoted as n! and defined as the product of all positive integers less than or equal to n; in other words, n! = n · (n − 1) · (n − 2) · · · 2 · 1.
The factorial function is important in many fields of mathematics and statistics. For example, a sequence of items is called a permutation and a set of n items can be ordered in n! different ways (permutations). The exclamation symbol (!) is called the “factorial” operator. Note that 0! = 1 is a special case. For example, 5! = 5·4·3·2·1 = 120. The factorial function is not defined for negative numbers. The definition of the factorial function can be extended to non-integer arguments using the gamma function, where n! = Γ (n + 1). The gamma function entry covers this subject in more detail.
Most computers cannot accurately compute values over 170! In Excel, n! = FACT(n). Excel reports an integer overflow error for FACT(n) when n ![]() 171. For large n, n! can be computed (approximately) in Excel with EXP(GAMMALN(n + 1)) and the ratio of two large factorials can be computed approximately as m!/n! = EXP(GAMMALN(m + 1) – GAMMALN(n + 1)).
171. For large n, n! can be computed (approximately) in Excel with EXP(GAMMALN(n + 1)) and the ratio of two large factorials can be computed approximately as m!/n! = EXP(GAMMALN(m + 1) – GAMMALN(n + 1)).
See combinations, gamma function.
Fagan Defect-Free Process – A formal process for reviewing products that encourages continuous improvement.
Fagan (2001) created a method of reviews and inspections for “early detection” of problems in software development while working at IBM. Fagan argues that the inspection process has two goals: (1) find and fix all defects and (2) find and fix all defects in the process that created the defects. The process specifies specific roles for a team of four people: Moderator, Reader, Author, and Tester.
See agile software development, early detection, New Product Development (NPD), scrum.
fail-safe – See error proofing.
Failure Mode and Effects Analysis (FMEA) – A process that identifies the possible causes of failures (failure modes), scores them to create a risk priority number, and then mitigates risk starting with the most important failure mode. ![]()
Failure Mode and Effects Analysis (FMEA) was invented by NASA early in the U.S. Apollo space program. NASA created the tool to alleviate the stress between two conflicting mottos: “Failure is not an option” and “Perfect is the enemy of good.” The first meant successfully completing the mission and returning the crew. The second meant that failure of at least some components was unavoidable.
FMEA is a simple process that identifies the possible causes of failures (failure modes), scores them on three dimensions (severity, occurrence, and detection) to create a risk priority number, and then mitigates risk starting with the most important failure mode. The first step in FMEA is to identify all potential failure modes where a failure might occur. Once these failure modes have been identified, FMEA then requires that each one be scored on three dimensions: severity, occurrence, and detection. All three dimensions are scored on a 1 to 10 scale, where 1 is low and 10 is high. These three scores are then multiplied to produce a Risk Priority Number (RPN). The failure models can then be prioritized based on the RPNs and risk mitigation efforts can then be designed for the more important failure modes.
Many organizations have found FMEA to be a powerful tool for helping them prioritize risk mitigation efforts. At 3M and other firms, FMEA is a required tool for all lean sigma projects.
Whereas Root Cause Analysis (RCA) identifies contributors to an adverse event after the fact, FMEA is intended to be a proactive (before the fact) tool. Ideally, FMEA anticipates all adverse events before they occur.
The scoring part of an FMEA requires the subjective evaluation of three dimensions for each failure mode, where each dimension is scored on a 1 to 10 scale:
Severity – Impact of the failure. If failure occurred, what is the significance of the harm of this failure in terms of cost, time, quality, customer satisfaction, etc.?
Occurrence – Frequency of occurrence. What is the probability that this failure will occur? (This is sometimes called the probability of occurrence.)
Detection – Ability to detect the problem and avoid the impact. Can the failure be detected early enough that it does not have a severe impact? (Important note: A 10 on detection means that it is hard to detect.)
Risk Priority Number (RPN) = (Severity) × (Occurrence) × (Detection)
It is easy to create an Excel workbook for FMEA. The following is a typical format. These actions usually target the likelihood of occurrence, but should also seek to make detection easier and reduce severity. After creating the workbook, the user can sort the rows by the RPN to prioritize the “actions to reduce risk.”
Failure Model and Effects Analysis (FMEA) example

See the Design Failure Mode and Effects Analysis (DFMEA) entry for information about how FMEA can be applied to design.
See Business Continuity Management (BCM), causal map, critical path, Design Failure Mode and Effects Analysis (DFMEA), error proofing, fault tree analysis, Hazard Analysis & Critical Point Control (HACCP), impact wheel, lean sigma, operations performance metrics, Pareto Chart, Pareto’s Law, prevention, risk, risk assessment, risk mitigation, robust, Root Cause Analysis (RCA), work simplification.
family – See product family.
FAS – See Final Assembly Schedule (FAS).
Fast Moving Consumer Goods (FMCG) – Any product sold in high volumes to end customers.
FMCG companies are firms that manufacture, distribute, or sell packaged consumer goods, food, hygiene products, grocery items, cleaning supplies, paper products, toiletries, soft drinks, diapers, toys, pharmaceuticals, and consumer electronics. These products are generally sold at low prices. FMCG seems to be synonymous with consumer packaged goods. The opposite of FMCG (and consumer packaged goods) is durable goods. Books and CDs are not FMCGs because consumers usually only buy them once.
See category captain, category management, consumer packaged goods, durable goods, Efficient Consumer Response (ECR).
fast tracking – See critical path.
fault tree analysis – A graphical management tool for describing the cause and effect relationships that result in major failures; a causal map usually used to identify and solve the causes for a specific actual historical problem.
Fault tree analysis is a causal map drawn from the top down. The actual historical fault or major failure being analyzed is identified as the “top event.” All possible causes of the top event are identified in a tree. The main distinquishing feature of a fault tree compared to other types of causal maps is the use of “OR” nodes for independent causes and “AND” nodes for multiple causes that must exist concurrently for a failure to occur.
See causal map, error proofing, Failure Mode and Effects Analysis (FMEA), risk assessment, risk mitigation, Root Cause Analysis (RCA), root cause tree.
faxban – A pull signal for a kanban system that is sent via fax.
Faxban uses fax communication rather than physical kanban cards to send a pull signal. Faxban can reduce the delay between the time that pull is needed and the time that the pull signal is sent. An e-kanban is similar, except that the signal is sent via e-mail, EDI, or through the Web.
See kanban.
FED-up model – See service quality.
field service – Repair and preventive maintenance activities performed by service technicians at the customer site.
Field service technicians (techs) often travel from their homes to customer sites to perform repairs. Techs usually carry inventory in their vehicles and often replace this inventory from a central source of supply on a use-one-order-one basis. Tech performance is often measured by average response time and customer satisfaction. Service calls can be under a warranty agreement or can be for time and materials. Hill (1992) presented a number of models for planning field service territories and tech truck stock inventory.
See response time, reverse logistics, Service Level Agreement (SLA), service parts.
FIFO – See First-In-First-Out (FIFO).
fill rate – See service level.
Final Assembly Schedule (FAS) – A schedule for the respond to order (RTO) customer interface of a manufacturing process.
For assemble to order (ATO), make to order (MTO), and RTO products, the Master Production Schedule (MPS) is a materials plan for longer-leadtime materials, subassemblies, and components that are kept in inventory until customer orders arrive. The MPS, therefore, is a statement of a longer-term plan for longer-leadtime inventoried materials based on a demand forecast. MRP uses this MPS to create a detailed materials plan that schedules the manufacturing and purchasing activities needed to support the materials plan for these master-scheduled items.
In contrast, the Final Assembly Schedule (FAS) is a short-term (e.g., 1-2 week) materials plan based on actual customer orders. The final assembly process might include assembly or other finishing operations, such as adding accessories, labeling, and packing. The push-pull boundary separates items that are in the MPS and the FAS. The Master Production Schedule (MPS) entry provides more information on this topic.
See assemble to order (ATO), bill of material (BOM), make to order (MTO), Master Production Schedule (MPS), push-pull boundary.
financial performance metrics – Economic measures of success. ![]()
All managers need to have a good understanding of financial performance metrics to make good decisions regarding capital investments, such as new plants and equipment, and also for process improvement projects. In virtually all public organizations and in most privately owned organizations, the financial performance metrics are the main goal. However, the operations performance metrics are often the “drivers” of the financial metrics. The cross-references below include most of the financial metrics that managers need to know.
See asset turnover, balance sheet, Balanced Scorecard, break-even analysis, Compounded Annual Growth Rate (CAGR), cost of goods sold, DuPont Analysis, EBITDA, Economic Value Added (EVA), goodwill, income statement, Internal Rate of Return (IRR), Net Present Value (NPV), operations performance metrics, payback period, performance management system, Return on Assets (ROA), Return on Capital Employed (ROCE), Return on Investment (ROI), Return on Net Assets (RONA), sunk cost, total cost of ownership, Y-tree.
finished goods inventory – The inventory units (or dollars) that are “finished” (completed) and ready for shipment or sale to a customer; sometimes abbreviated FG or FGI. ![]()
Other types of inventory include raw materials, Work-in-Process (WIP), Maintenance-Repair-Operations (MRO), and pipeline (in-transit) inventory.
See Maintenance-Repair-Operations (MRO), Work-in-Process (WIP) inventory.
finite loading – See finite scheduling.
finite population queuing model – See queuing theory.
finite scheduling – Creating a sequence of activities with associated times so that no resource (person, machine, tool, etc.) is assigned more work time than the time available.
The opposite of finite scheduling is infinite loading, which ignores capacity constraints when creating a schedule. Hill and Sum (1993) developed the following terms for finite scheduling: A due-date-feasible schedule satisfies all due date requirements for all tasks (orders or operations). A start-date-feasible schedule does not have any tasks (orders or operations) scheduled before the current time. A capacity-feasible schedule does not require any resource to work more time than is available in any period.
Most finite scheduling systems begin with the current due date and therefore will always create start-date feasible schedules. However, if the capacity is insufficient, these systems will not be able to create due-date feasible schedules.
In contrast, MRP systems plan backward from the due date and therefore always create due-date feasible schedules. However, MRP systems are infinite loading systems and ignore capacity when creating a schedule, which means they create schedules that are often not capacity feasible. MRP systems will “schedule” some orders in the “past-due” time bucket, which means that the orders should have been started before the current time. When MRP systems create orders in the “past-due” bucket, the schedule is not start-date feasible, but is still “due-date” feasible.
Although many ERP systems and project management tools have finite scheduling capabilities, few firms use these tools. Most firms use infinite loading for both ERP and project management and then resolve resource contention issues after the plan (schedule) has been created. Finite scheduling was one of the main needs that motivated the development of Advanced Planning and Scheduling (APS) systems.
See Advanced Planning and Scheduling (APS), backward loading, closed-loop MRP, forward scheduling, infinite loading, load, load leveling, Materials Requirements Planning (MRP), project management, time bucket.
firm order – In the manufacturing context, a customer order that has no uncertainty with respect to product specifications, quantity, or due date; also called a customer order or firm customer order.
In contrast a “soft order” is a forecast or a planned order sometimes provided to suppliers via EDI.
See Electronic Data Interchange (EDI), Master Production Schedule (MPS), Materials Requirements Planning (MRP).
firm planned order – A manufacturing order that is frozen in quantity and time and is not affected by the MRP planning system.
Firm planned orders are created manually by planners and only planners can change the date or quantity for a firm planned order. When an MRP system regenerates materials plans for all items, firm planned orders are not changed. Firm planned orders give planners the ability to adjust schedules to handle material and capacity problems. The order quantities in a master production schedule are often called firm planned orders. A firm planned order is similar to, but not identical to, a firm customer order.
See buyer/planner, manufacturing order, Master Production Schedule (MPS), time fence.
first article inspection – The evaluation of the initial item in an order to confirm that it meets all specifications.
Approval to run additional parts is contingent on this first item meeting all specifications. See inspection.
first mover advantage – The benefit sometimes gained by the first significant company to enter a new market.
Amazon is a good example of a firm that gained competitive advantage by being the first significant firm to enter the online book market. Although other firms sold books on the Internet before Amazon, it was the first firm to do so with appropriate systems and capitalization. Now that Amazon has established itself as the largest Internet book retailer, it has the economies of scale to offer low transaction costs (through good information systems and order fulfillment operations) and the economies of scope (and the network effect) to offer superior value to publishers and authors. The same arguments can be made for eBay in the on-line auction market.
Of course, the first firm in a market is not always able to establish a long-term competitive advantage. Dell Computer currently has the largest market share for personal computers, but many other firms, such as IBM, Apple, and Compaq, entered this market long before Dell.
See market share, operations strategy.
first pass yield – See yield.
first pick ratio – Percentage of items successfully retrieved from the initial warehouse storage location recommended on the pick list.
This is a performance measure for inventory accuracy and warehouse efficiency.
See operations performance metrics, picking.
First-In-First-Out (FIFO) – Using the arrival date as the priority for processing or as an accounting rule.
First-In-First-Out (FIFO) has several similar meanings:
Service priority – The customer who arrived first is serviced first. This is a common practice in walk-in clinics and restaurants.
Production scheduling – The customer order that was received first is processed first. Most lean systems use the FIFO rule. Although FIFO is the “fairest” rule, other dispatching rules often have better shop performance in terms of the average time in system.
Stock rotation – The method of picking goods from inventory that have been in inventory for the longest time.
Stock valuation – The method of valuing stocks that assumes that the oldest stock is consumed first and thus issues are valued at the oldest price.
See dispatching rules, inventory valuation, Last-In-First-Out (LIFO), queuing theory, warehouse.
fishbone diagram – See causal map.
five forces analysis – An industry analysis tool used to better understand a competitive environment.
Michael Porter’s five forces analysis (Porter 1988) can be used by any strategic business unit to evaluate its competitive environment. This analysis looks at five key areas: threat of entrants to the market, the power of buyers, the power of suppliers, the threat of substitutes, and competitive rivalry. The model is shown below.
See competitive analysis, industry analysis, operations strategy, SWOT analysis.
Porter’s Five Forces

five S – See 5S.
fixed order quantity – The policy of using a constant (fixed) lotsize in a production or inventory planning system.
The Economic Order Quantity (EOQ) is a special case of a fixed order quantity. SAP and most other ERP/MRP systems will order in multiples of the fixed order quantity if the net requirements require more than the fixed order quantity.
See Economic Order Quantity (EOQ), lotsize, lotsizing methods.
fixed price contract – A contract to complete a job at a predefined and set cost; also called a fixed-cost contract.
The contractor is obligated to finish the job, no matter how much time or cost is actually incurred. In other words, the contractor takes all the risk.
See buy-back contract, purchasing, risk sharing contract.
fixed storage location – The practice of storing items in a storage area that is labeled with the item ID.
With fixed storage locations, each item has a home location with the item’s identification (part number, item number, SKU) on the shelf. Fixed storage locations are generally inefficient and hard to maintain because the space requirements for products in storage usually change over time as the demand patterns change. These changes require that the organization frequently reallocate the fixed location assignments or have excessive amounts of extra space allocated to each product.
On the positive side, fixed storage locations make it easy for people to find products. Most firms find that a mixture of fixed and random storage locations systems makes sense. The fixed storage locations are used for high-volume products where people are frequently picking items. These locations are replenished often from random storage locations that hold larger bulk quantities of items.
See locator system, random storage location, supermarket, Warehouse Management System (WMS), zone storage location.
fixture – A device used to hold a work piece securely in the correct position relative to the tool while work is being done on the work piece.
Unlike a fixture, a jig can guide the tool.
See jig, manufacturing processes, tooling.
flexibility – The ability to change (adapt) quickly and efficiently in response to a change in the internal or external environment. ![]()
Although the term “flexibility” is used very commonly in business, it is often used inconsistently and has several very different definitions. A major contributing factor to this ambiguity is that organizations face a wide variety of uncertainties and therefore need to have many types of flexibility. However, when managers and researchers discuss flexibility, they often fail to specify which type of flexibility they have in mind. Flexibility can be viewed both strategically and tactically. From a strategic point of view, flexibility can be defined as:
Volume flexibility – The ability to quickly and efficiently increase or decrease the production rate. This is sometimes called scalability and is about having economies of scale or at least avoiding diseconomies of scale.
Mix flexibility – The ability to efficiently handle a wide variety of products in one facility. Other authors define mix flexibility slightly differently. Schroeder, Meyer Goldstein, and Rungtusanatham (2011) defined it as the time to change the mix of products and services; Sethi and Sethi (1990) defined it as the ability of the manufacturing system to produce a set of part types without major setups; and Dixon (1992) defined it as the ability to manufacture a variety of products within a short period of time and without major modifications of existing facilities. Mix flexibility is closely related to product range.
Customization flexibility – The ability to quickly and efficiently provide a wide range of “respond to order” products. This is sometimes called mass customization and is fundamentally about having economies of scope or at least avoiding diseconomies of scope.
New product development flexibility – The ability to quickly and efficiently bring new products to market.
All four of the above flexibilities require the flexibility to be efficient. Unless the organization can “flex” efficiently, it is not truly flexible. For example, it might be possible for a firm to reduce its volume from 100 units per day to 50 units per day, but it is not considered to have volume flexibility if the cost per unit doubles.
Sethi and Sethi (1990) provide a research review article on this subject.
See diseconomy of scale, mass customization, New Product Development (NPD), production planning, resilience, respond to order (RTO), scalability.
Flexible Manufacturing System (FMS) – An integrated set of machines that have automated materials handling between them and are controlled by an integrated information system.
See automation, cellular manufacturing, manufacturing processes, product-process matrix.
float time – See slack time.
floater – A direct labor employee used to fill in on a production line when the regular worker is absent.
floor planning – An arrangement used by a retailer to finance inventory where a finance company buys the inventory, which is then held in trust for the user.
floor stock – Inventory stored close to a production process so workers can use it without an inventory transaction.
The labor cost of handling inventory transactions for lower cost items, such as fasteners, can sometimes be more than the cost of the items themselves. This is also true for bulk items, such as liquids in drums or wire on rolls. This is often solved by moving materials to floor stock as either bulk issued or backflushed items.
With bulk issues, the inventory balance in the warehouse inventory is reduced by the quantity issued and the floor stock account is increased by the same amount. The floor stock inventory is considered out of the system and the system may immediately call for a new reorder. In contrast, with backflushing, the MRP system considers the floor stock as available inventory and the floor stock inventory is reduced when the product is shipped. The backflush quantity is based on the “quantity per” in the bill of material (BOM).
See backflushing.
flow – The movement of products and customers through a process with minimum time wasted in waiting, processing, and non-value-adding activities, such as rework or scrap.
In the lean philosophy, one of the main goals is to improve flow by reducing lotsizes, queues, and rework. Improving flow reduces cycle time, which increases visibility and exposes waste.
See lean, time-based competition.
flow rack – Warehouse shelving that is tilted with rollers so cases roll forward for picking.
With a flow rack, only one case needs to be on the pick face, which means that many items can be available in a small area. Flow racks allow for high item density, which decreases travel time and increases picks per hour.
flow time – See cycle time.
flowchart – A diagram showing the movement of information and objects over time; also called a flow chart and a process flowchart.
The term “flowchart” has historically been used primarily for information flow. Most process improvement leaders now use the term “process map” when creating a diagram to show the steps in a process. See the process map entry for much more detail.
See process map, seven tools of quality.
flowshop – An academic research term used to describe a process that involves a sequence of machines where jobs move directly from one machine to the next.
Dudek, Panwalkar, and Smith (1992) recognized that “there is no precise definition of a flowshop,” but they pointed out that “the following general assumptions are common in the literature. Jobs are to be processed in m stages sequentially. There is one machine at each stage. Machines are available continuously. A job is processed on one machine at a time without preemption and a machine processes no more than one job at a time.”
See facility layout, job shop, job shop scheduling.
FMCG – See Fast Moving Consumer Goods (FMCG).
FMEA – See Failure Mode and Effects Analysis (FMEA).
FMS – See Flexible Manufacturing System.
FOB – A common freight/shipping acronym meaning “free on board.”
When a buyer purchases something and pays for it with terms “FOB origin,” the responsibility of the seller stops when the goods are delivered to the transporting company in suitable shipping condition. It is then the buyer’s responsibility to pay for transportation. In addition, if something gets lost or is damaged during transport, it is settled between the buyer and the transportation company. FOB is an official Incoterm.
See Cash on Delivery (COD), Incoterms, terms, waybill.
focus group – A qualitative research technique that collects ideas from a small group of people.
Focus groups are often used as a marketing research tool to assess customer reactions to product ideas, but they can also be used for other purposes such as collecting employee opinions and gathering process improvement ideas. It is generally a good idea to have an experienced facilitator lead the focus group. Focus groups often use structured brainstorming methods such as the Nominal Group Technique (NGT).
See brainstorming, Nominal Group Technique (NGT).
focused factory – A process that is “aligned with its market” and therefore requires a limited range of operations objectives. ![]()
The concept of a focused factory was originally developed by Harvard Business School Professor Wickham Skinner (1974) in his seminal article entitled “The Focused Factory.” Skinner stated “The focused factory will out-produce, undersell, and quickly gain competitive edge over the complex factory.” Skinner’s article argues that a factory can excel at no more than one or two operations tasks, such as quality, delivery reliability, response time, low cost, customization, or short life cycle products.
“You can’t be everything to everyone” is an old phrase that suggests that people (and firms) cannot do everything well, at least not in one process. A focused factory is a means of implementing a strategic direction for an operation. A firm can have several “focused factories” in any one factory building or location.
Schroeder and Pesch (1994) define a focused factory as one with “a limited and consistent set of demands that originate from its products, processes, and customers, enabling the factory to effectively support the business strategy.” They state that “many manufacturing executives define focus simply as having a limited number of products ... but this definition is too narrow ... the key is to limit the demands placed on manufacturing by limiting the number of processes and customers as well as the number of products.” Schroeder (2008) notes that the types of focus could be based on products, processes, technologies, sales volume, customer interface (make to stock versus make to order), or product maturity.
A focused factory, therefore, is not necessarily a factory that produces only one product, but a factory that reduces the variability or range of process requirements so the factory can excel at its key operations tasks. Focused factories align their processes to their markets and to the operations tasks required for those markets. This approach has implications for many process design issues, such as workforce (skill levels, salaried versus direct, customer-facing skills, etc.), performance metrics, customer interface, planning and control systems, cost accounting systems, facility layout, and supplier relationships. For example, the table below compares an operationally excellent make to stock “focused factory” making high volumes of standard products to an engineer to order “focused factory” developing innovative new products in response to customer orders.
Make to stock focused (MTS) factory versus engineer to order (ETO) focused factory
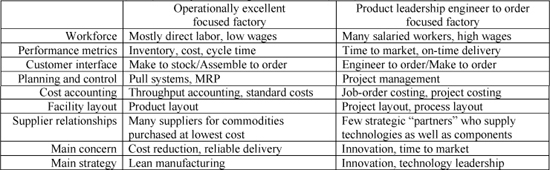
When a factory focuses on just a few key manufacturing tasks, it will be smaller, simpler, and more successful than a factory attempting to be all things to all customers. A focused factory can often deliver superior customer satisfaction to a vertical market, which allows it to dominate that market segment.
Some factories are unfocused originally because designers fail to recognize the limits and constraints of technologies and systems. Other factories start out highly focused, but lose focus over time due to product proliferation. In a sense, losing focus is “scope creep” for a factory.
See cellular manufacturing, core competence, facility layout, functional silo, handoff, operations strategy, plant-within-a-plant, product proliferation, scope creep, standard products, throughput accounting.
fool proofing – See error proofing.
force field analysis – A brainstorming and diagramming technique useful for gaining a shared understanding of the “tug of war” between the forces (factors) that drive (motivate) change toward a goal and the forces that restrain (block) change and support the status quo; force field analysis is supported by the force field diagram.
Force field analysis was developed by Kurt Lewin (1943), who saw organizations as systems where some forces were trying to change the status quo and some forces were trying to maintain it. A factor can be individual people, groups, attitudes, assumptions, traditions, culture, values, needs, desires, resources, regulations, etc. Force field analysis can be used by individuals, teams, and organizations to identify the relevant forces and focus attention on ways of reducing the hindering forces and encouraging the helping forces. The tool helps build a shared understanding of the relevant issues and then helps build an action plan to address the issues.
Force field example
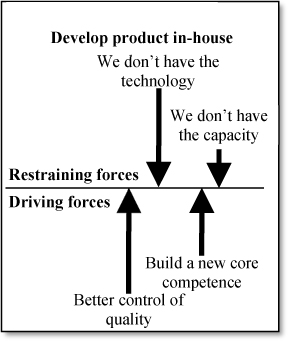
The figure on the right is an example of a force field “tug of war” on the issue of keeping new product development inside a firm. The equilibrium line separates the driving and restraining forces. (Note that the equilibrium line can be either vertical or horizontal.) The lengths of the arrows represent the strength of the forces. After the diagram is drawn, the team should focus on finding ways to strengthen or add driving forces and reduce or remove restraining forces.
See Analytic Hierarchy Process (AHP), brainstorming, decision tree, Kepner-Tregoe Model, Lewin/Schein Theory of Change, Pugh Matrix, stakeholder analysis.
force field diagram – See force field analysis.
force majeure – Events (or forces) beyond the control of the parties of a contract that prevent them from complying with the provisions of the contract; from French meaning superior force.
Typical forces that might be included in such a contract include governmental actions, restraints by court, wars or national emergencies, acts of sabotage, acts of terrorism, protests, riots, civil commotions, fire, arson, explosions, epidemics, lockouts, strikes or other labor stoppages, earthquakes, hurricanes, floods, lightning, embargos, blockades, archeological site discoveries, electrical outages, and interruptions of supply. The term “force majeure” is often used as the title of a standard clause in contracts exempting the parties for non-fulfillment of their obligations as a result of conditions beyond their control. In some cases, an industry shortage is considered a justifiable reason for a supplier to declare a force majeure and put customers on allocation.
Here is an example of a force majeure paragraph from naturalproductsinsider.com/ibg/terms.asp (November 27, 2005): “Neither party shall be deemed in default of this Agreement to the extent that performance of their obligations or attempts to cure any breach are delayed or prevented by reason of any act of God, fire, natural disaster, accident, act of government, shortages of materials or supplies, or any other causes beyond the control of such party, provided that such party gives the other written notice thereof properly and, in any event, within fifteen days of discovery thereof and uses its best efforts to cure the delay (force majeure). In the event of such force majeure, the time of performance or cure shall be extended for a period equal to the duration of the Force.”
See leadtime syndrome.
forecast accuracy – See forecast error metrics.
forecast bias – The average forecast error over time, defined mathematically as  , where Et is the forecast error in period t and T is the number of observations available.
The ideal forecasting system has a zero forecast bias, which means that it has an average forecast error of zero. When the forecast bias is zero, the positive and negative forecast errors “balance each other out.” Bias is not the same as forecast accuracy. It is possible that a forecasting system with low accuracy (high mean absolute error) has zero forecast bias, and conversely, a forecasting system with a high accuracy (low mean absolute error) has high forecast bias. Forecast bias is a measure of the average performance of the forecasting system, whereas forecast accuracy is a measure of the reliability of the forecast.
Good forecasting systems have built-in exception reporting systems that trigger a “tracking signal” report when the forecast bias is large. See the tracking signal entry.
In practice, forecast bias can be tracked with three approaches: the moving average, the running sum of the errors, or the exponentially smoothed average error. The moving average approach defines the forecast bias as the average over the last T periods. The running sum of the errors approach uses the simple equation Rt = Rt-1 + Et, where Rt is the running sum of the forecast error at the end of period t. With this approach, a small consistent bias will become large over many periods. The exponentially smoothed average uses the equation SEt = SEt-1 + αEt, where SEt is the smoothed average error at the end of period t and α is the smoothing constant (0 < α < 1). This is probably the best approach because it puts more weight on the most recent data.
See alignment, bias, demand filter, forecast error metrics, Mean Absolute Deviation (MAD), Mean Absolute Percent Error (MAPE), mean squared error (MSE), tracking signal.
forecast consumption – A method for reducing forecasted demand as the actual demand is realized.
See forecasting, Materials Requirements Planning (MRP).
forecast error metrics – Mathematical measures used to evaluate forecast bias and accuracy. ![]()
Forecast error is defined as the actual demand minus the forecast in a period. Using standard mathematical notation, Et = Dt − Ft, where Et is the forecast error in period t, Dt is the demand in period t, and Ft is the forecast made for period t. Given that the demand is rarely known, most organizations use actual sales as an estimate of demand. The following table is a summary of many forecast error metrics collected by this author. The symbol (![]() ) indicates metrics recommended by the author.
) indicates metrics recommended by the author.
Forecast bias metrics for a single item
• Average error, ![]()
![]()
• Smoothed error, SEt
• Mean Percent Error, MPE
• Mean Error Scaled by the Mean Demand,
• Running Sum of the Forecast Errors, RSEt
• Tracking Signal, TS1t, TS2t ![]()
Forecast accuracy metrics for a single item
• Mean Absolute Deviation (Mean Absolute Error), MAD
• Smoothed Mean Absolute Deviation, SMADt
• Mean Absolute Deviation as percent of average demand, MADP
• Mean Absolute Percent Error (Winsorized 1), MAPE
• Smoothed Mean Absolute Percent Error, SMAPEt
• Relative Absolute Error – Random Walk, RAErw
• Relative Absolute Error – Exponential Smoothing, RAEes
• Mean Absolute Scaled Error, MASE ![]()
• Thiel’s U, U1, U2, U3
• Mean Squared Error, MSE
• Smoothed Mean Squared Error, SMSEt
• Root Mean Squared Error, RMSE
• Forecast Attainment, FA
• Demand Filter, DFt ![]()
Forecast bias metrics for a group of items
• Count or percentage of items with positive forecast error, PPFE
• Weighted Average Forecast Error, WAFE
• Forecast Attainment, FA ![]()
Forecast accuracy metrics for a group of items
• Weighted Mean Absolute Percent Error (Winsorized at 1), WMAPE
• Weighted Mean Absolute Scaled Error, WMASE ![]()
• Median MAPE, MdMAPE
• Geometric Mean of the MAPE, GMMAPE
• Weighted Relative Absolute Error, WRAE
• Median RAE, MdRAE
• Geometric Mean RAE, GMRAE
• Forecast Attainment, FA
• Weighted Absolute Percent Error, WAPE
• Percent Better, PB
Other forecast error metrics
• Sample variance, standard deviation, ![]() ,
, ![]()
• Sample correlation, coefficient of determination, r, r2
• Regression, a, b, r2
• Sample autocorrelation at lag k, ![]()
See bias, Box-Jenkins forecasting, correlation, demand filter, exponential smoothing, forecast bias, forecast horizon, forecast interval, forecasting, geometric mean, linear regression, Mean Absolute Deviation (MAD), Mean Absolute Percent Error (MAPE), Mean Absolute Scaled Error (MASE), mean squared error (MSE), Median, Median Absolute Percent Error (MdAPE), operations performance metrics, Relative Absolute Error (RAE), standard deviation, Thiel’s U, tracking signal, weighted average, Winsorizing.
forecast horizon – The number of time periods into the future that are forecasted.
For example, if a firm regularly makes forecasts that cover the next six months, it has a six-month forecast horizon. If a firm has a six-month manufacturing leadtime, it should clearly forecast at least six months into the future. Forecast error increases rapidly with the forecast horizon. It is often more practical and more economical to spend money to reduce the manufacturing leadtime (and the corresponding forecast horizon) than it is to find a better forecasting method to improve the forecast error for a given forecast horizon.
See all-time demand, forecast error metrics, forecast interval, forecasting, forward visibility.
forecast interval – The highest and lowest reasonable values for a forecast.
This is usually set as the forecast (which is usually an expected value) plus or minus z standard deviations of the forecast error. A reasonable value is z = 3. A forecast interval is very similar to a confidence interval, but it is not exactly the same. It is important to understand that the forecast interval is strongly influenced by the forecast horizon, where the forecast interval increases with the forecast horizon.
See forecast error metrics, forecast horizon, forecasting, forward visibility, geometric mean.
forecasting – Predicting the future values of a variable. ![]()
Almost all organizations need to forecast sales or demand on a regular basis. Organizations also need to forecast the cost of materials, the availability of labor, the performance of a technology, etc. The two main types of forecasting methods are quantitative and qualitative methods. Quantitative methods can be further broken into time series methods and causal methods.
Time series methods (also called intrinsic forecasting methods) seek to find historical patterns in the data and then extrapolate those into the future. The simplest time series models are an average, moving average, and weighted moving average. Exponential smoothing forecasting models create forecasts with a weighted moving average, where the weights decline geometrically with the time lag. The Winters’ and Holt-Winters’ models for exponential smoothing (Winters 1960) add trend and seasonality. The Box-Jenkins method is a much more sophisticated model for time series forecasting (Box, Jenkins, & Reinsel 1994).
Causal methods (also called extrinsic or econometric forecasting methods) are nearly always multiple regression methods, where the model predicts one variable (the dependent variable) from one or more other independent lagged variables. See the linear regression and econometric forecasting entries.
Qualitative methods are subjective methods used to collect estimates from people. See the Delphi and technological forecasting entries for more information on qualitative models.
All time series can be decomposed into a seasonal pattern (tied to the calendar or a clock), a trend, cyclical (irregular patterns), and what is left over (random noise). See the seasonality, trend, and time series entries.
Forecast error is defined as the actual value minus the forecasted value. Most forecasting models assume that the random error is normally distributed. See the forecast error metrics entry for more detail.
Demand forecasts are better when:
• Expressed as a point estimate (a single number) and a forecast interval rather than just a point estimate.
• Aggregated across product families, regions, and periods.
• Made for a short horizon.
• Based on many periods of historical data.
• Supplemented by human intelligence.
• Clearly differentiated from a plan.
• Carefully aligned with reward systems.
• Created collaboratively by the supply chain.
• Used by everyone without modification.
Fundamental forecasting principles:
• Forecasting is difficult (especially if it is about the future).
• The only thing we know for sure about a forecast is that it is wrong.
• Separate forecasting and planning – forecast ≠ plan.
• It is easier to fit a model to historical data than it is to create accurate forecasts.
• Use lean to reduce cycle times and forecast horizons.
• Use information systems to replace inventory and improve service.
• Share demand information to reduce forecast error and coordinate the supply chain.
• Use leading indicators to reduce forecast error.
• Use demand management to balance supply and demand.
• Use yield management to maximize revenue.
• Use demand filters and tracking signals to control forecasts.
• Use the Bass Model for product life cycle forecasting, particularly at the beginning of the product life cycle.
• Use the geometric time series model for end-of-life forecasting.
Two misunderstandings of forecasting are common. Each of these is discussed below.
Confusing forecasting and planning – Many firms use the term “forecast” for their production plan. As a result, they lose important stockout (opportunity cost) information and create confusion and muddled thinking throughout their organizations. In a typical business context, the firm needs a forecast of the demand for its products without consideration of the firm’s capacity or supply. In response to this “unfettered” (unconstrained) demand forecast, the firm should make its production and inventory plans. In some periods, the firm might plan to have inventory greater than demand; in other periods, the firm might plan to have inventory short of demand.
Confusing sales and demand history – Many people use the terms “sales” and “demand” interchangeably. However, they are not the same. Technically, demand is sales plus lost sales. Most firms keep a sales history, which they sometimes call the “demand history.” (SAP uses the term “consumption” history.) This is a “censored” time series because sales will be less than demand when sales are lost due to lack of inventory. This distinction is important when using historical sales (not demand) to forecast future demand. Some retailers try to use information on the “in-stock position” to inflate the sales history to estimate the demand history.
The website www.forecastingprinciples.com provides a dictionary, bibliography, and other useful information on forecasting. The Principles of Forecasting is a free Web-based book by J. Scott Armstrong that can be found at www.forecastingprinciples.com/content/view/127/10 (April 18, 2011).
See all-time demand, anchoring, Bass Model, Box-Jenkins forecasting, censored data, coefficient of variation, Collaborative Planning Forecasting and Replenishment (CPFR), Croston’s Method, Delphi forecasting, demand, demand filter, demand management, econometric forecasting, elasticity, exponential smoothing, forecast consumption, forecast error metrics, forecast horizon, forecast interval, forward visibility, inventory management, leading indicator, linear regression, lumpy demand, Mean Absolute Deviation (MAD), Mean Absolute Percent Error (MAPE), moving average, Sales & Operations Planning (S&OP), seasonality, supply chain management, technological forecasting, Theta Model, time bucket, time series forecasting, tracking signal, trend.
forecasting lifetime demand – See all-time demand.
forging – A manufacturing process that shapes metal by heating and hammering.
Forging usually involves heating metal (below the melting point) and then using hammering or pressure to shape the metal. Forged parts usually require additional machining. Forging can be cold, warm, or hot.
for-hire carrier – A common carrier or contract carrier trucking firm that transports goods for monetary compensation.
See carrier, common carrier, logistics.
forklift truck – A vehicle used in warehouses, factories, and distribution centers to lift, move, stack, and rack loads (usually on pallets); also called a lift truck, fork lift, and hi-low.
A forklift may have a special attachment on the front for handling certain specialized products.
See cross-docking, logistics, materials handling, pallet, warehouse.
forming-storming-norming-performing model – A model that explains the progression of team development.
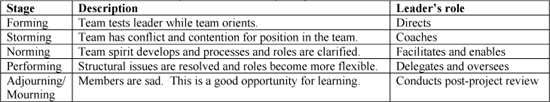
This model of group development was first proposed by Tuckman (1965), who maintained that all four phases are necessary for a team to be successful. Tuckman and Jensen (1977) added “adjourning” in 1970, which some call “mourning.”
• Forming – In this first stage, the team has high dependence on the leader for guidance. The team has little agreement on goals other than what the leader has defined. Individual roles and responsibilities are unclear. Processes are often ignored and team members often test the boundaries of the leader. The leader directs.
• Storming – Team members contend to establish their position relative to those of other team members and the leader and decision making is difficult. Informal alliances form and power struggles are common. The team needs to be focused on goals and compromises may be required to enable progress. The leader coaches.
• Norming – The team begins to develop consensus and clarify roles and responsibilities. Smaller decisions may be delegated to individuals or smaller teams. The team may engage in fun and social activities. The team begins to develop processes. The leader facilitates and enables.
• Performing – The team has a shared understanding of its vision and is less reliant on the leader. Disagreements are resolved positively and process changes are made easily. Team members might ask for assistance from the leader with personal and interpersonal development. The leader delegates and oversees.
• Adjourning (Mourning) – The team’s work is complete when the task is successfully completed and the team members can feel good about their work. The leader should conduct a post-project review to ensure that individuals learn and that organizational learning is captured and shared.
See brainstorming, mission statement, post-project review, project management.
formulation – A list of the quantities of each ingredient needed to make a product, typically used for chemicals, liquids, and other products that require mixing; also called a recipe.
forward buy – The practice of purchasing materials and components in excess of the short-term anticipated demand; the use of forward buys is called forward buying.
Forward buying is often motivated by trade promotions (temporary price reductions) or anticipation of a potential price increase. Although forward buying might reduce the acquisition cost for the customer, it can increase inventory carrying cost for the customer and increase the variability of the demand for the supplier. Everyday low pricing (EDLP) is a way to encourage customers to reduce forward buying and stabilize demand.
See acquisition, bullwhip effect, Everyday Low Pricing (EDLP), futures contract, loss leader, promotion, purchasing.
forward integration – See vertical integration.
forward loading – See forward scheduling.
forward pass – See forward scheduling.
forward pick area – A space within a warehouse used for storing and picking higher-demand items; this space is resupplied from a larger reserve storage area; sometimes called a golden zone.
This area usually has fixed storage locations so that pickers can remember where the items are located. Using a forward pick area can reduce unproductive travel time by order pickers but must be replenished from a bulk storage (reserve storage) area somewhere else in the warehouse. A forward pick area usually has small quantities of high-volume parts stored in carton flow racks positioned near a conveyor, shipping area, or the loading dock. Forward pick areas are common in distribution centers in North America, especially those supporting retail sales. Bartholdi (2011) provided more information in his free on-line book and Bartholdi and Hackman (2008) developed a mathematical model for optimizing the space allocated to a forward pick area.
See picking, reserve storage area, slotting, warehouse, Warehouse Management System (WMS).
forward scheduling – A finite scheduling method that begins with the start date (which could be the current time) and plans forward in time, never violating the capacity constraints; also called forward loading or forward pass.
The start date and task times are the primary inputs to a forward scheduling algorithm. The planned completion date is an output of the process. Forward scheduling is quite different from back scheduling, which starts with the due date (planned completion date) and plan backward to determine the planned start date. The critical path method uses forward scheduling to determine the early start and early finish for each activity in the project network. See the finite scheduling entry for more detail.
See back scheduling, Critical Path Method (CPM), finite scheduling.
forward visibility – Giving information on future demand and production plans to internal and external suppliers.
Customers can give their suppliers forward visibility by sharing their forecasts and production plans. This allows suppliers to plan their production to better meet their customers’ requirements.
See Electronic Data Interchange (EDI), forecast horizon, forecast interval, forecasting, Materials Requirements Planning (MRP).
foundry – A facility that pours hot metal into molds to create metal castings.
A casting is any product formed by a mold (British, mould), which is a hollow cavity with the desired shape. The casting can be either ejected or broken out of the mold. Castings do not always require heat or a foundry. For example, plaster may be cast. Sand casting uses sand as the mold material.
A foundry creates castings by heating metal in a furnace until it is in liquid form, pouring the metal into a mold, allowing the metal to cool and solidify, and finally removing the casting from the mold. Castings often require additional operations before they become products sold to customers. Castings are commonly made from aluminum, iron, and brass. Castings are used in many products, such as engines, automobiles, and machine tools.
See manufacturing processes, mold.
Fourth Party Logistics (4PL) provider – See Third Party Logistics (3PL) provider.
fractile – A selection portion of a probability distribution.
For example, the lower quartile is the lower 25% of the cumulative probability distribution and the top decile is the top 10% of the cumulative probability distribution.
See interquartile range, newsvendor problem.
Free-on-Board (FOB) – See FOB.
freight bill – Invoice for the transportation charges of goods shipped or received. See logistics
freight forwarder – An independent business that handles export shipments for compensation.
See logistics.
front office – See back office.
frozen schedule – See time fence.
FTE – See Full Time Equivalent.
fuel surcharge – An extra charge added to the cost of a shipment to cover the variable cost of fuel.
fulfillment – The process of shipping products to customers in response to customer orders; also called fulfillment operations.
The fulfillment process almost always involves order entry, picking items from a warehouse or distribution center, packaging, and shipping. In addition, fulfillment may also involve:
• Supplier-facing activities – Placing replenishment orders, managing in-bound logistics, providing information on current inventory status to suppliers, and expediting.
• Other customer-facing activities – Tracking orders, sending automated e-mails to customers to let them know their packages are in transit, satisfying customer requests for information, handling returns, and providing help desk support for products.
• Financial activities – Processing credit card transactions, invoicing customers, and paying suppliers.
The term “fulfillment” is most often associated with e-commerce and other operations that ship many small orders to end customers rather than operations that process shipments to other manufacturers, wholesalers, or resellers. Examples of fulfillment operations include fulfillment operations for mail-order catalogs, Internet stores, and service parts. A fulfillment house is a third party that performs outsourced storage, order picking, packaging, shipment, and other similar services for others.
See customer service, help desk, order entry, replenishment order, Third Party Logistics (3PL) provider, warehouse, Warehouse Management System (WMS).
Full Time Equivalent (FTE) – A labor staffing term used to equate the salary or work hours for a number of parttime people to the number of “equivalent” full-time people.
For example, three people working half-time is equal to 1.5 FTEs.
full truck load – See less than truck load (LTL).
functional build – A design and manufacturing methodology that de-emphasizes individual part quality and focuses on system quality.
Conventional design and manufacturing processes sequentially check each part being produced against design specifications utilizing Cp and Cpk metrics. This requires that all critical dimensions of a part be within specification limits. An example is an auto manufacturer checking 1,400 points on a door die. If any of these are out of tolerance, they would be reworked to achieve proper specifications. With a functional build, if the part is close to passing, it is used in the assembly and the overall assembly is held to tighter tolerances. In contrast, the functional build process checks fewer points and fixes only the ones necessary to bring the door assembly (system) into tolerance. The result is a higher quality assembly, which is what the customer really cares about, at a substantially lower cost.
A study conducted by CAR found that Japanese automobile manufacturers had the lowest quality doors as measured by Cpk for individual parts, but had high customer scores for the door assembly, while American manufacturers had higher door component Cpk values, but lower customer scores (adapted from “The Quest for Imperfection,” Charles Murray, Design News, October 10, 2005, www.designnews.com).
See process capability and performance, Taguchi methods.
functional silo – A functional group or department in an organization, such as marketing, operations, accounting, and finance, that is overly focused on its own organization and point of view, which results in inefficient and ineffective processes.

A silo is a tall cylindrical tower used for storing grain, animal feed, or other material. The photo on the right shows a series of six silos on an American farm. The metaphor here is that organizations often have “silos” where people in functional groups are overly focused on their own functions, do not coordinate with other functions, do not share information with other functions, and do not have constructive interactions with other functions. The functional departments are usually pictured as vertical lines, whereas processes serving each market segment are drawn as horizontal lines that cross multiple silos. The result of the functional silo problem is inefficient processes, poor customer service, and lack of innovation.
For example, a customer order begins with a salesperson who hands it off to order entry, but neglects to include some information. The order entry person enters the sales order data into the information system, but accidentally enters the promise date incorrectly. The manufacturing organization makes the product to the customer’s requirements, but misses one important unusual customer need. The shipping people accidently ship the product to the billing address rather than to the point of need. It is easy for information to get lost in this process because each “silo” (department) has different goals and information systems. It is hard for any one process to “own” this customer order because the process is too far from the voice of the customer.
The lean answer to this issue is to create organizations around value streams that are aligned with market segments. A focus on value streams instead of silos reduces waste, cycle time, cost, and defects. In the operations strategy literature, this is called a focused factory.
See Deming’s 14 points, focused factory, lean thinking, mass customization, order entry, value stream.
future reality tree – A theory of constraints term for a type of causal map used to show the relationships needed to create the future state desirable effects.
See causal map, current reality tree, Theory of Constraints (TOC).
futures contract – An agreement to purchase or sell a commodity for delivery in the future with (1) a price determined at initiation of the contract, (2) terms that obligate each party to fulfill the contract at the specified price, (2) the purpose of assuming or shifting price risk, and may be satisfied by delivery or offset; also called futures.
A futures contract is a standardized, transferable, exchange-traded contract that requires delivery of a commodity, bond, currency, or stock index, at a specified price, on a specified future date. Unlike options, futures convey an obligation to buy. The risk to the holder is unlimited, and because the payoff pattern is symmetrical, the risk to the seller is unlimited. Money lost and gained by each party on a futures contract is equal and opposite. In other words, futures trading is a zero sum game. Futures contracts are forward contracts, meaning they represent pledges to make certain transactions at future dates. The exchange of assets occurs on the date specified in the contract. Futures are distinguished from generic forward contracts in that they contain standardized terms, trade on formal exchanges, are regulated by overseeing agencies, and are guaranteed by clearinghouses. To insure that payment will occur, futures also have a margin requirement that must be settled daily. Finally, by making an offsetting trade, taking delivery of goods, or arranging for an exchange of goods, futures contracts can be closed. Hedgers often trade futures for the purpose of keeping price risk in check.
See commodity, forward buy, purchasing, zero sum game.
fuzzy front end – The process for determining customer needs or market opportunities, generating ideas for new products, conducting necessary research on the needs, developing product concepts, and evaluating product concepts up to the point that a decision is made to proceed with development.
This process is called the fuzzy front end because it is the most unstructured part of product development. Preceding the more formal product development process, it generally consists of three tasks: strategic planning, concept generation, and pre-technical evaluation. These activities are often chaotic, unpredictable, and unstructured. In comparison, the subsequent new product development process is typically structured, predictable, and formal, with prescribed sets of activities, questions to be answered, and decisions.
Adapted from www.pdma.org (April 18, 2011).
See New Product Development (NPD).
G
Gage R&R – See Gauge R&R.
gainsharing – An incentive program that provides financial benefits to employees based on improvements in quality or productivity; also called pay for performance.
See Balanced Scorecard, human resources, job design, pay for skill, piece work.
game theory – A branch of mathematics that models the strategic interactions among competitors to determine the optimal course of action.
Business can be viewed as a “game” between the competitors in a market. A decision (move) by one player motivates a move by another player. Historically, game theory can be traced back to the Talmud and Sun Tzu’s writings. John von Neumann and Oskar Morgenstern are credited with the mathematical development of modern-day game theory in their book Theory of Games and Economic Behavior (Neumann & Morgenstern 1944). In the early 1950s, John Nash generalized these results and created the basis for the modern field of mathematical game theory19. The most widely known example of game theory is the prisoners’ dilemma.
A major issue with game theory is the trade-off between realism and simplicity. The most common assumptions in game theory are (1) rationality (i.e., people take actions likely to make them happier, and they know what makes them happy) and (2) common knowledge (i.e., everyone else is trying to make themselves happy, potentially at our expense).
See co-opetition (co-competition), prisoners’ dilemma, zero sum game.
gamma distribution – A continuous probability distribution often used to model task times and other variables that have a left tail bounded by zero.
The gamma distribution has shape parameter α and scale parameter β. Important special cases of the gamma distribution include the exponential, k-Erlang, and chi-square distributions. The k-Erlang is a special case of the gamma with an integer shape parameter.
Gamma density and distribution functions: The gamma density function is f(x) = β-α xα-1 e-x/β/Γ(α) for x > 0; f(x) = 0 otherwise, where ![]() dt is the gamma function. The gamma function does not have a closed form when α is not an integer, which means that the gamma density and distribution functions must be approximated numerically. The gamma function entry presents the VBA code for the gamma function.
dt is the gamma function. The gamma function does not have a closed form when α is not an integer, which means that the gamma density and distribution functions must be approximated numerically. The gamma function entry presents the VBA code for the gamma function.
Graph: The graph below shows a gamma density function with a range of α parameters and scale parameter β = 1. Note that if X is a gamma distributed random variable with shape α and scale 1, then βX is a gamma distributed random variable with shape α and scale β.
Statistics: Mean μ = αβ, variance σ2 = αβ2, mode β(α - 1) if α ![]() 1 and 0 otherwise, skewness
1 and 0 otherwise, skewness ![]() , and coefficient of variation
, and coefficient of variation ![]() .
.

Parameter estimation: Many authors, such as Fisher and Raman (2010), use the method of moments to estimate ![]() and
and ![]() , where
, where ![]() and s are the sample mean and standard deviation. Law (2007) presented a maximum likelihood estimation procedure that requires numerical methods. Minka (2002, p. 2) claimed that the approach in Law “can be quite slow, requiring around 250 iterations if α = 10” and presented an MLE approach that converges in about four iterations. All MLE approaches are based on the fact that the MLE estimate for beta is
and s are the sample mean and standard deviation. Law (2007) presented a maximum likelihood estimation procedure that requires numerical methods. Minka (2002, p. 2) claimed that the approach in Law “can be quite slow, requiring around 250 iterations if α = 10” and presented an MLE approach that converges in about four iterations. All MLE approaches are based on the fact that the MLE estimate for beta is ![]() .
.
Excel: In Excel, the natural log of the gamma function is GAMMALN(α), which means that the gamma function is EXP(GAMMALN(α)). The gamma density and distribution functions are GAMMADIST(x, α, β, FALSE) and GAMMADIST(x, α, β, TRUE). The inverse distribution function is GAMMAINV(p, α, β). In Excel 2010, the gamma distribution function is renamed GAMMA.DIST(x, α, β, TRUE), and the gamma inverse function is renamed GAMMA.INV(p, α, β).
Excel errors: The GAMMADIST and GAMMAINV functions in Excel 2003 and Excel 2007 will return #NUM for some combinations of input parameters. Knüsel (2005) stateed that the GAMMADIST function “can have numerical problems just in the most important central part of the distribution.” Evidently, these problems have been fixed in Excel 2010.
Excel simulation: An Excel simulation can generate gamma distributed random variates with the inverse transform method using x = GAMMAINV(1-RAND(), α, β).
Partial expectation function: H(x) = μFGamma(x|α+1,β).
Related distributions: If X ~ Gamma(1, β), then X ~ Exponential(β), where β is the mean. If X ~ Gamma(k,β), then X ~ Erlang(k, β), where k is an integer. If X ~ Gamma(k / 2, 2), then X ~ Chi-square with k degrees of freedom. See Law (2007) for more details. The gamma, Weibull, and lognormal distributions are special cases of the generalized gamma distribution (Wikipedia 2010). The gamma converges to the normal distribution as the shape parameter (α) approaches infinity.
See beta distribution, chi-square distribution, Erlang distribution, exponential distribution, gamma function, inverse transform method, negative binomial distribution, partial expectation, probability density function, probability distribution.
gamma function – A mathematical extension of the factorial function to real and complex numbers.
The gamma function is ![]() for α > 0. When α is a non-negative integer, α! = Γ(α + 1). Note that
for α > 0. When α is a non-negative integer, α! = Γ(α + 1). Note that ![]() . In Excel, the gamma function can be computed as exp(GAMMALN(x)).
. In Excel, the gamma function can be computed as exp(GAMMALN(x)).
The gamma function is used in several probability distributions, including the beta, F, gamma, chi-square, and Weibull, and is also useful for evaluating ratios of factorials. The factorial of a positive integer n is defined as n! = n·(n - 1)·(n - 2) ... 1, where 0! ≡ 1. The gamma function generalizes this to all non-negative real numbers where α! = Γ(α + 1).
The gamma function provides a practical tool for evaluating ratios of factorials, such as n!/m!, that are common in probability, statistics, and queuing theory. When n or m is large, the factorial results in integer overflow problems. (The largest factorial that Excel can handle is 170!) Given that n!/m! = Γ(n + 1)/Γ(m + 1), we know that ln(n!/m!) = ln(Γ(n + 1)/Γ(m + 1)) = ln(Γ(n + 1)) − ln(Γ(m + 1)). Defining GLN(x) = ln(Γ(x)), then ln(n!/m!) = GLN(n + 1) − GLN(m + 1) and n!/m! = exp(GLN(n + 1) − GLN (m + 1)). This procedure can be done in double precision and eliminates the risk of integer overflow problems. However, this procedure can have rounding problems. This method is comparable to cancelling out common terms in the ratio n!/m! before doing the division. In Excel, the function for the natural log of the gamma function is GAMMALN(x).
The following table illustrates this point in Excel. From basic algebra, we know that y = (n + 1)!/n! is equal to n + 1. The table shows that for n = 2, 4, and 169, the factorial and gamma function approaches both provide the correct values. However, for n > 170, the factorial method has integer overflow problems. In contrast, the gamma function provides the correct answer within the limits of computer precision.
Table comparing the factorial approach to the gamma approach

Source: Professor Arthur V. Hill
The gamma function has no closed form, but accurate and efficient approximate numerical methods are available. The following VBA code was written by this author based on the algorithm in Press et al. (2002). This was tested in Excel and found to be identical to the Excel function GAMMALN() in every case tested.
According to Wikipedia, Stirling’s approximation is said to be good for large factorials. However, this author’s implementation found that it had overflow problems for n > 170. The Wikipedia entry suggests Nemes approximation as an alternative, where ln ![]() . The author has tested this approximation and found it to be very precise for all values of z. Interestingly, the average of the gamma function approach and Nemes approach was consistently better than either approach in these tests.
. The author has tested this approximation and found it to be very precise for all values of z. Interestingly, the average of the gamma function approach and Nemes approach was consistently better than either approach in these tests.
See algorithm, beta distribution, beta function, chi-square distribution, combinations, error function, factorial, gamma distribution, hypergeometric distribution, Student’s t distribution.
Gantt Chart – A graphical project planning tool that uses horizontal bars to show the start and end dates for each task. ![]()
The simple Gantt Chart example on the right shows the start and end dates for five tasks. Although a Gantt Chart is a useful tool for communicating a project schedule (plan), it does not usually show precedence relationships between tasks and therefore is not a good project planning tool for large projects.

Microsoft Project, the most popular project planning software on the market today, uses Gantt Charts to communicate project schedules. Unlike most Gantt Charts, this software can use arrows to show precedence relationships between tasks.
See bar chart, Critical Path Method (CPM), project management, waterfall scheduling.
gap model – See service quality.
gate – See project management, stage-gate process.
gateway workcenter – The location in a facility where a manufacturing order has its first operation.
GATT – See General Agreement on Tariffs and Trade (GATT).
gauge – An instrument used for measurement or testing; also spelled gage.
The word “gauge” is often spelled “gage,” but according to the New Merriam-Webster Pocket Dictionary (G. & C. Merriam Co. 1971), “gauge” is the proper spelling.
An old management proverb says, “You cannot manage what you cannot measure.” This is particularly true for managing process improvement. It is impossible to reduce variation in a process (and the products that are produced by that process) without a reliable measurement system.
Many people assume that the term “gauge” is confined to mean a micrometer, but in the context of Gauge R&R, the term “gauge” can mean any measurement device. In fact, “Gauge R&R” can be used for any measurement tool and can even be used for surveys and other non-factory measurement tools. The following list of common measurement and test equipment includes a broad range of measuring devices:
• Hand tools (calipers, micrometers, linear scales)
• Gauges (pins, thread, custom gauges)
• Optical tools (comparators, profiles, microscopes)
• Coordinate measuring machines
• Electronic measuring equipment (digital displays, output)
• Weights, balances and scales
• Hardness testing equipment
• Surface plate methods and equipment
• Surface analyzers (optical flats, roughness testers)
• Force measurement tools (torque wrenches, tensiometers)
• Angle measurement tools (protractors, sine bars, angle blocks)
• Color measurement tools (spectrophotometer, color guides, light boxes)
• Gauge maintenance, handling, and storage
See Gauge R&R, manufacturing processes, Measurement System Analysis (MSA), metrology.
Gauge R&R – A statistical tool that measures the variation in measurements that arises from (a) measurement device variability (repeatability) and (b) operator variability (reproducibility); also called Gage R&R.
The measurement system is a key part of understanding and improving process capability and Gauge R&R is a key part of the measurement system. In many lean sigma and lean manufacturing applications, Measurement System Analysis (MSA) is conducted in the Measure step of the DMAIC process. MSA is also a key part of the Control step (the “C”) in DMAIC.
Gauge R&R measures two different types of variation in the measurement process:
• Repeatability – The ability of a device (gauge) to produce consistent results. It is a measure of the “within” variability between repeated measurements for one device, with one operator, on one part.
• Reproducibility – The ability of the appraiser (operator) to produce consistent results. It is the variation between different operators who measure the same part with the same device.
In addition, most Gauge R&R studies also measure the interaction between the gauge and the operator. For example, out of several inspectors, one might have a tendency to read one gauge differently than others.
The two most common methods used for Gauge R&R are the (1) Average and Range method and (2) Analysis of Variance (ANOVA). The Average and Range method, like many classical SPC methods, is based on ranges, which are easy to calculate manually. ANOVA is more accurate, but the Range and Average method is simpler and therefore has been more widely used. With the increased availability of statistical software tools for ANOVA, it is likely that ANOVA-based Gauge R&R will become the method of choice in the future.
Although the most obvious application of Gauge R&R is for tools, it can be applied to any type of measurements. For example, it can be applied to customer satisfaction and employee engagement surveys.
Some of the material above was adapted from e-mail correspondence with Gary Etheridge, Staff Engineer at Seagate, and from the website for the Automotive Industry Action Group (www.aiag.org). DeMast and Trip (2005) is a good reference on Gauge R&R.
See Analysis of Variance (ANOVA), Design of Experiments (DOE), DMAIC, gauge, lean sigma, Measurement System Analysis (MSA), metrology, tooling.
gemba – A Japanese term for the actual place where “real” work takes place; sometimes spelled genba.
The Japanese word “gemba” is frequently used for the shop floor or any place where value-adding work actually occurs. The main idea communicated by the term is that improvement really only takes place with (1) engagement of the people who work the process and (2) direct observation of the actual current conditions. For example, standardized work cannot be documented in the manager’s office, but must be defined and revised in the “gemba.” According to one source21, the more literal translation is the “actual spot” and was originally adapted from law enforcement’s “scene of the crime.”
The Japanese characters are ![]() (from www.fredharriman.com/resources/documents/FHcom_Kaizen_Terminology_03.pdf (January 27, 2009).
(from www.fredharriman.com/resources/documents/FHcom_Kaizen_Terminology_03.pdf (January 27, 2009).
See 3Gs, checksheet, kaizen workshop, lean thinking, management by walking around, waste walk.
gemba walk – See waste walk.
General Agreement on Tariffs and Trade (GATT) – A set of rules created by the United Nations to promote freer trade by limiting or eliminating tariffs and import quotas between signatory countries.
GATT is now supervised by the World Trade Organization (WTO), which expanded its scope from only traded goods to include services and intellectual property rights.
See antitrust laws, purchasing, tariff.
genetic algorithm – A heuristic search procedure that finds solutions to optimization problems by generating an initial solution and then permuting solutions until a stopping condition is found.
See heuristic, operations research (OR), optimization.
geometric decay – See all-time demand, geometric progression.
geometric mean – A measure of the central tendency appropriate for the product of two or more values.
The arithmetic mean (i.e., the average) is relevant for quantities that are added together and answers the question, “If all quantities had the same value, what value is needed to achieve the same total?” In contrast, the geometric mean is relevant for quantities that are multiplied together and answers the question, “If all quantities had the same value, what value is needed to achieve the same product?”
Example 1 – The area of a rectangle can be found by multiplying the length (L) and the width (W). In other words, A = LW. When L = 10 feet and H = 6 feet, the area is A = 60 square feet. What are the dimensions of a square with L = W that has the same area? The answer is the geometric mean which is equal to ![]() feet. The arithmetic mean for this problem is (10+6)/2 = 8 feet and the geometric mean is less than the arithmetic mean (i.e., 7.746 < 8 feet).
feet. The arithmetic mean for this problem is (10+6)/2 = 8 feet and the geometric mean is less than the arithmetic mean (i.e., 7.746 < 8 feet).
Example 2 – The volume of a room can be found by multiplying the length (L), depth (D), and height (H) together. In other words, V = LDH. When L = 10 feet, D = 12 feet, and H = 8 feet, then V = 960 cubic feet. What are the dimensions of a room that is a perfect cube with L = D = H that has the same volume? The answer is the geometric mean, which is equal to G = (LDH)1/3 = (10·12·8)1/3 = 9601/3 ≈ 9.87 feet. The arithmetic mean is (10+12+8)/3 = 10 feet and the geometric mean is less than the arithmetic mean (i.e., 9.87 < 10 feet).
Example 3 – The geometric mean is an appropriate measure of the central tendency when an average growth rate is required. For example, suppose that in three successive years the return on an investment was 5%, 20%, and −4%. The “average” rate of return for these three years can be found as the geometric mean G = (1.05 ·1.20 · 0.96)1/3 ≈ 1.065. Therefore, the average rate of return (Compound Annual Growth Rate or CAGR) is 6.5%. To prove this, we see that 1.0653 ≈ 1.05 · 1.20 · 0.96 = 1.2096. The arithmetic means for these three values is (1.05 + 1.2 + 0.96)/3 = 1.07, which is more than the geometric mean.
The geometric mean is closely related to the CAGR. If sales grow from si to sj over n = j − i + 1 years, the CAGR during this period is (sj/si)1/n − 1. For example, if sales grew from $10 to $16 million over a five-year period, the CAGR during this period is (16/10)1/5 − 1 = 0.10 or 10%.
The arithmetic mean is ![]() and the geometric mean is
and the geometric mean is 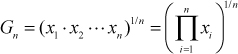 , where xi is the i-th value and n is the number of values. The geometric mean is always less than or equal to the arithmetic mean (i.e., Gn
 ![]() An). The arithmetic and geometric means are equal (i.e., Gn = An) only if x1 = x2 = ... = xn. The logarithm of the geometric mean is the arithmetic mean of the log transformed data (i.e.,
An). The arithmetic and geometric means are equal (i.e., Gn = An) only if x1 = x2 = ... = xn. The logarithm of the geometric mean is the arithmetic mean of the log transformed data (i.e., ![]() .
.
Excel – Excel uses the function GEOMEAN(number1, number2,...) for the geometric mean. The CAGR can be computed with the Excel function XIRR(values, dates).
See Compounded Annual Growth Rate (CAGR), forecast error metrics, geometric progression, Internal Rate of Return (IRR), mean, skewness.
geometric progression – A sequence of terms in which each term is a constant factor times the previous one.
The n-th term in a geometric progression is dn = βdn−1 (in recursive form) and dn = βnd0 (in closed form). The β parameter is called the common ratio and is defined as β = dn/dn−1. The example below has d0 = 100 and β = 0.8. In this example, d6 = βd5 ≈ 0.8·32.77 ≈ 26.21 and d6 = d0β6 ≈ 26.21 (values are rounded).
When |β| < 1, the sum of a geometric progression (a geometric series) has a closed-form expression. The sum of the first n terms (after term 0) is Sn = d1 + d2 + ... + dn = βd0 + β2d0 + ... + βnd0. Multiplying both sides by β yields βSn = β2d0 + β3d0 + ... + βn+1d0, and then subtracting this new equation from the first one yields Sn − βSn = βd0 − βn+1d0, which simplifies to (1 − β)Sn = d0β(1 − βn). Given that β < 1, it is clear that 1 − β ≠ 0, which means it is possible to divide both sides by 1 − β, which yields Sn = d0β(1 − βn)/(1 − β). At the limit as n → ∞, βn → 0 and the infinite sum (after term 0) is S∞ = d0β/(1 - β). In summary, the sum of an infinite geometric progression (starting at n = 1) is S∞ = d0β/(1 − β) and the finite sum of the first n terms is Sn = d0β(1 − βn)/(1 − β). The finite sum from terms m to n is then Sm,n = d0(βn+1 − βm)/(β − 1).
For the above example, the infinite sum is S∞ = d0β/(1 − β) = 100·0.8/(1−0.2) = 400 and the sum of the first six terms (after term 0) is S6 = d0β(1 − β6)/(1 − β) = 100·0.8·(1−0.86)/(1−0.8) ≈ 295.14.
The initial value (d0) is called the scale factor and the constant factor (β) is called the common ratio. The sequence of values (d0, d1, ... , dn) is called a geometric progression and the sum of a geometric progression (d0 + d1 + ... + dn) is called a geometric series. The product of a geometric progression is ![]() if β > 0 and d0 > 0.
if β > 0 and d0 > 0.
See all-time demand, exponential smoothing, geometric mean.
geometric series – See geometric progression.
Getting Things Done (GTD) – A philosophy for managing a personal task list, filing system, and e-mails in a disciplined way; the name of a popular book on personal time management by David Allen (2001).
See the entry for the two-minute rule for what is probably Allen’s most famous principle.
See personal operations management, two-minute rule, two-second rule, tyranny of the urgent.
Global Data Synchronization Network (GDSN) – An initiative designed to overcome product data inaccuracies and increase efficiencies among trading partners and their supply chains.
GDSN is a network of certified data pools that enable product information to be captured and exchanged in a secure environment conforming to global standards. Different versions of product information in the supply chain can cause serious business issues. Global Data Synchronization (GDS) ensures that trading partners always use the same version of the data. This empowers the supplier to manage the information flow in the supply chain and not rely on the trading partner or other third parties to manipulate their data. The foundational principles of GDS include:
• Product data is updated consistently between trading partners.
• Data is validated against standards and business rules.
• Trading partners classify their products in a common, standardized way.
• Trading partners have a single point of entry through their chosen data pool, reducing the cost of using multiple vendors.
• The uniqueness of items is guaranteed through the GS1 Global Registry.
The standards body that governs the GDSN is GS1, an organization dedicated to the design and implementation of global standards and solutions to improve the efficiency and visibility of supply and demand chains globally and across sectors. The GS1 system of standards is the most widely used supply chain standards system in the world and has been used for more than 30 years in multiple sectors and industries.
Global Positioning System (GPS) – A satellite-based technology that can be used to determine the current latitude and longitude for a device.
GPS technology can be a very helpful tool for collecting information in a transportation system.
See logistics, telematics.
global sourcing – See sourcing.
goal tree – See Y-tree.
gold parts – A phrase used in the Theory of Constraints for parts that have passed through the bottleneck.
These parts are much more valuable because the organization has invested time in them from its most valuable resource (the bottleneck).
See inspection, Theory of Constraints (TOC).
golden zone – See forward stocking area.
Goldratt – See Theory of Constraints (TOC).
Gompertz Curve – See logistic curve.
Good Manufacturing Practices (GMP) – Quality guidelines and general principles for producing and testing products developed by the U.S. Food and Drug Administration (the FDA) covering pharmaceuticals, diagnostics, foods, and medical devices; also called Current Good Manufacturing Practices (CGMP).
All guidelines follow the following basic principles:
• Manufacturing processes are clearly defined and controlled. All critical processes are validated to ensure consistency and compliance with specifications.
• Manufacturing processes are controlled and any changes to the process are evaluated. Changes that have an impact on the quality of the drug are validated as necessary.
• Instructions and procedures are written in clear and unambiguous language.
• Operators are trained to carry out and document procedures.
• Records are made manually or with instruments that demonstrate that all the steps required by the defined procedures and instructions were, in fact, taken and that the quantity and quality of the drug was as expected. Deviations are investigated and documented.
• Records of manufacture (including distribution) that enable the complete history of a batch to be traced are retained in a comprehensible and accessible form.
• The distribution of the drugs minimizes any risk to their quality.
• A system is available for recalling any batch of drug from sale or supply.
• Complaints about marketed drugs are examined, the causes of quality defects are investigated, and appropriate measures are taken with respect to the defective drugs and to prevent recurrence.
Adapted from http://en.wikipedia.org/wiki/Good_manufacturing_practice (March 19, 2011).
See process validation, quality management.
goodness-of-fit tests – See chi-square goodness of fit test, Kolmogorov-Smirnov test (KS test).
goodwill – (1) In any business context: The value of a good relationship between a business and its customers. (2) In a business acquisitions context: An intangible asset equal to the cost to acquire a business over the fair market value of all other assets. (3) In an interpersonal context: A cheerful, friendly, kind attitude toward others.
In any business context, goodwill is the reputational capital of the firm. Goodwill is lost when the company cannot fulfill its service promises, runs out of inventory, or has poor product or service quality. Lost goodwill can lead to lost sales, lower margins, and loss of brand equity. Goodwill is very difficult to measure.
In a business acquisition context, goodwill is the difference between the fair market value of a company’s assets (less its liabilities) and the market price or asking price for the overall company. In other words, goodwill is the amount in excess of the firm’s book value that a purchaser would be willing to pay to acquire it. If a sale is realized, the new owner of the company lists the difference between book value and the price paid as goodwill in financial statements.
See Economic Value Added (EVA), financial performance metrics, quality management, safety stock, service level, stockout.
GPS – See Global Positioning System (GPS).
gravity flow rack – See flow rack.
gravity model for competitive retail store location – A mathematical model for locating one or more new retail stores relative to the competing stores in a region.
The basic concept of the gravity model is that the “gravitational pull” for a store on customers is directly proportional to the size of the store and inversely proportional to the travel time squared. In other words, customers will be attracted to larger close-by stores much more than they will be to smaller far-away stores. This model is an application of Newton’s Law, which states that the gravitational pull between two planets is directly proportional to their mass and inversely proportional to the square of the distance between them.
The goal is to find the best location for one or more new stores from a set of potential locations, assuming that the new stores will have to compete for customers with the other stores in the region. The model allocates the revenue in the market to each of the stores based on the “pull,” which is a function of store size (bigger is better) and travel time (closer is much better). The model can be used to evaluate all reasonable alternatives and select the store locations that maximize the total expected revenue.
The algorithm allocates all revenue in a region to the m stores. Store j is characterized by its size Sj and by a competitive index cj, which is used to adjust for weak and strong competitors in the market. The region has n population areas (census blocks). The travel time from census block i to store j is tij. The “pull” for store j with competitive index cj on census block i is directly proportional to the size of the store and inversely proportional to the travel time to the ρ power. Pull, therefore, is defined as ![]() . The ρ parameter can be determined empirically, but is usually close to ρ = 2.
. The ρ parameter can be determined empirically, but is usually close to ρ = 2.
The probability that a resident of census block i will shop at store j is the normalized pull, which is given by  . Census block i has mj customers with average revenue per customer of ri. The expected revenue for store j, therefore, is
 ![]() . The best location for a store (or set of stores) can be found by using the model to evaluate all reasonable alternative configurations and selecting the one that has the largest expected revenue.
. The best location for a store (or set of stores) can be found by using the model to evaluate all reasonable alternative configurations and selecting the one that has the largest expected revenue.
See center-of-gravity model for facility location, facility location, great circle distance, numeric-analytic location model.
gray market – See gray market reseller.
gray market reseller – A broker that sells products through distribution channels other than those authorized or intended by the manufacturer; spelled “grey” outside the United States22.
Gray market resellers typically buy used equipment or clearance products on the open market and resell them to end-user customers at prices lower than those desired by the manufacturer. These resellers sell outside the normal distribution channels, typically have no relationship with the manufacturer, and typically provide no aftersales service. In some cases, the warranty is no longer valid.
Gray market products are usually (but not always) legal and are usually (but not always) bought and sold at prices lower than the prices set by the manufacturer or regulatory agency. These are often products that were sold in one national market and then exported and sold in another national market at a lower price. For example, a dealer might buy a car at a reduced price in one country and then sell it in another country at a lower price.
See the diversion entry for more information on the problems with this practice.
great circle distance – The shortest distance between any two points on a sphere.
Given that the earth is approximately spherical, the great circle distance can be used to estimate the travel distance between any two points defined by their latitude and longitude coordinates. Now that Global Positioning Systems (GPS) and geographical databases are widely available, the great circle distance is a practical means to estimate distances for a wide variety of logistics and transportation planning problems.
The Spherical Law of Cosines computes the great circle angle (aij) between the points i and j on the earth using aij = acos(sin(xi) sin(xj) + cos(xi) cos(xj) cos(yj − yi)), where (xi, yi) and (xj, yj) are the latitude and longitude coordinates for the two points expressed in radians. Convert the great circle angle into a great circle distance using dij = r · aij, where r is the average radius of the earth, which is r ≈ 3958.76 miles or r ≈ 6371.01 km. If latitude and longitude are expressed in hours, minutes, and seconds (h: m: s), convert them to decimal degrees using decimal_degrees = h + m/60 + s/60/60, and then convert to radians using radians = π · decimal_degrees/180.
The Excel formula for the Spherical Law of Cosines is r*ACOS(SIN(x1)*SIN(x2)+ COS(x1)*COS(x2)*COS(y2-y1)) for earth radius r and coordinates (x1,y1) and (x2,y2) expressed in radians. When using the arc cosine function (ACOS), the absolute value of the argument must be less than one. It is useful, therefore, to implement this distance function in VBA to conduct this check. The following VBA code developed by this author implements the Law of Cosines great circle distance function in VBA using a derived arc cosine. It is important to use double precision for all variables in this code.
The above VBA code finds that the distance between Seattle (47:36:00,122:20:00) and Miami (25:45:00, 80:11:00) is 2732.473 miles and the distance between the Nashville International Airport (N 36°7.2’, W 86°40.2’) and the Los Angeles International Airport (N 33°56.4’, W 118°24.0’) is 1793.555 miles.
Love, Morris, and Wesolowsky (1988) suggest inflating intracity travel distances by a factor of roughly 1.18 to account for the fact that travel distances between intracity points is, on average, greater than the straight-line distance due to road structures.
See facility location, gravity model for competitive retail store location, Manhattan square distance, numeric-analytic location model.
green belt – See lean sigma.
green manufacturing – Manufacturing that is environmentally conscious and ideally more profitable; closely related to “sustainability.”
The number of computers and other electronic devices on our planet appears to be increasing according to Moore’s Law and are having a negative impact on our environment. According to Greenpeace, demand for new technology creates 4,000 tons of waste an hour, which often ends up in large piles in India, Africa, and China.
With take-back programs, customers return used technology to manufacturers that recycle the parts for new products. Many European nations have legal requirements for return logistics. The U.S. has few such laws, but many firms are voluntarily implementing such programs. For example, in 2004, Dell Computer recovered 40,000 tons of unwanted equipment for recycling, up 93% from 2005.
Ideally, organizations can improve the environment and improve their profits at the same time. Here are several good examples adapted from the article www.fastcompany.com/magazine/120/50-ways-to-green-yourbusiness.html (October 25, 2007):
• General Mills – In the past two years, General Mills has turned its solid waste into profits. Take its oat hulls, a Cheerios by-product. The company used to pay to have them hauled off, but realized they could be burned as fuel. Now customers compete to buy the waste. In 2006, General Mills recycled 86% of its solid waste, earning more selling the waste than it spent on disposal. In 2006, General Mills redesigned packaging and shaved off 20% of the paperboard box without shrinking contents. The result was 500 fewer distribution trucks on the road each year.
• General Electric – Trains were already the cleanest way to move massive amounts of freight long distances, but General Electric raised the game with its Evolution locomotives, diesel engines launched in 2005 that cut fuel consumption by 5% and emissions by 40% compared to locomotives built just a year earlier. GE has plans for a GE hybrid diesel-electric locomotive that captures energy from braking (like the Toyota Prius) and improves mileage by another 10%. According to GE, the energy dissipated in braking a 207-ton locomotive during the course of a year is enough to power 160 homes for the same period.
• Walmart – Walmart is providing funding to the biggest truck manufacturers (ArvinMeritor, Eaton, International, and Peterbilt) to develop the first heavy-duty diesel-hybrid 18-wheeler. Walmart has pushed the liquid-laundry-detergent industry to cut bottle sizes by 50% or more by concentrating the liquid. Thus, Unilever’s triple-concentrated All Small & Mighty detergent has saved 1.3 million gallons of diesel fuel, 10-million pounds of plastic resin, and 80 million square feet of cardboard since 2005. This fall, Procter & Gamble is converting its entire collection of liquids to double concentration.
• C3 Presents – Austin-based concert promoter C3 Presents made news when it banned Styrofoam cups from the sixth annual Austin City Limits Music Festival. Following the model the company created for Lollapalooza, C3 took a holistic approach to greening nearly every aspect of ACL, from bamboo-based concert T-shirts to gel sanitizer in the bathrooms to bio-diesel power generators.
• Philadelphia Eagles – Starting in 2006, the team’s “Go Green” environmental campaign has its stadium cleaning crew making two full sweeps after each game, one to pick up recyclables and another for trash.
• Tesco – Some retailers have introduced product labels that encourage customers to weigh their carbon. The British grocery giant Tesco has a program to label all 70,000 of its products with carbon breakdowns.
• Unilever – Unilever has reconfigured the plastic bottles for its billion-dollar Suave shampoo brand, saving the plastic equivalent of about 15 million bottles a year.
The concept of the “green supply chain” extends green manufacturing concepts to the entire supply chain. Using green supply chain concepts, organizations find ways to reduce emissions, avoid toxic wastes, reduce total waste, improve energy efficiency, and otherwise improve their impact on the environment.
See cap and trade, carbon footprint, energy audit, Moore’s Law, remanufacturing, reverse logistics, sustainability, triple bottom line.
green supply chain – See green manufacturing.
greenfield – The concept of building a new plant (or other facility) in a new location, which is often a field with no existing buildings on it.
This is often an opportunity for the firm to start with a fresh perspective on facility layout, process technology, and organization. In contrast, older facilities and land are sometimes called brownfields. These are often abandoned, idled, or under-used industrial or commercial facilities. Some brownfield locations also have problems with industrial contamination.
See facility location.
gross profit margin – An ambiguous term that relates gross profit to sales, measured as (1) a dollar amount (i.e., revenue less cost of goods sold), or (2) a percentage (i.e., 100(gross profit margin in dollars)/revenue); also called gross margin.
The first definition is the margin in dollars, while the second definition is the margin as a percentage. The second definition is sometimes called the gross margin percentage.
See cost of goods sold.
gross requirement – The total demand for an item, including both independent and dependent demand.
Unlike the gross requirement, the net requirements consider both on-hand inventory and open orders.
See Materials Requirements Planning (MRP).
gross weight – (1) Packaging context: The total weight of a package (including packaging) and its contents. (2) Shipping/logistics context: The total weight of a vehicle and its contents.
See logistics, net weight, tare weight.
group technology – (1) A methodology for classifying parts (items) based on similar production processes and required resources. (2) A manufacturing cell (cluster of machines, equipment, and workers) dedicated to making a set of parts that share similar routings.
See Computer Aided Design (CAD), cellular manufacturing.
groupware – Software that helps groups of people work together on a common task; also called workgroup support systems, group support systems, and workflow software.
Groupware supports communication, collaboration, and coordination and therefore can help improve productivity of people working in groups. Groupware functionality can include e-mail, group calendars, address books, video conferencing, audio conferencing, shared documents, shared databases, and task scheduling. Groupware is particularly helpful when the workers are not all in the same location. Friedman (2005) emphasized the importance of groupware (workflow software) in enabling firms to outsource.
See Decision Support System (DSS), outsourcing, project management.
Growth-Share Matrix – See cash cow.
GTD – See Getting Things Done (GTD).
H
HACCP – See Hazard Analysis & Critical Point Control (HACCP).
half-life curve – A mathematical model that shows the relationship between a performance measure (such as defects) and the time required to reduce (cut) the performance measure in half. ![]()
The half-life curve was popularized by Ray Stata, founder of Analog Devices, Inc. (Stata 1989). Whereas the learning curve assumes that learning is driven by production volume, the half-life curve assumes that learning is driven by time. The half-life concept suggests that the performance measure will be cut in half every h periods, where h is a constant. For example, if the unit cost at time zero is $100 and the half-life is six months, the unit cost will be $50 at six months, $25 at 12 months, and so forth.
Any performance variable with an ideal point of zero can be used in this model. For example, the performance variable could be cost/unit, time/unit, defects, cycle time, percent on-time delivery, etc.
The basic equation for the half-life curve is y(t) = aebt, where e ≈ 2.718281. The performance variable y(t) is the performance at time t. The constants are a = y(0) and b = −ln(2)/h, where the half-life (in periods) is h = −ln(2)/b. For example, if the half-life is 6 months, and the defect rate is 10% at time zero, at month 6 the defect rate should be 5%, and at month 12 the defect rate should be 2.5%.
The graph below is an example of a half-life curve with parameters h = 2, y(0) = 100, and b = −0.347. Note that unlike the learning curve, the half-life curve is continuous and is defined for all values of t.
The easiest way to estimate b is to find the value that fits the first and last historical points b = ln(y(t)/y(0))/t. A more accurate (but more complicated) approach for estimating b is to apply linear regression on transformed historical data. To apply linear regression, take the natural log transform of both sides of the half-life equation to find ln(y(t)) = ln(a) + bt, use linear regression to estimate the ln(a) and b parameters, and then use the model to estimate the performance variable at some time t in the future. Use the equation h = −ln(2)/b to estimate the half-life from the b parameter. This regression approach will not work if any y(t) is zero and is also adversely affected by autocorrelation in the data.

See learning curve, learning organization, linear regression, Moore’s Law, operations performance metrics.
handoff – A point in a process where work or information is transferred from one individual or organization to another; also written hand-off.
From a lean manufacturing perspective, handoffs can lead to waste because each handoff has the potential to lose information and create a queue of materials waiting to be picked up. Reducing the number of handoffs will usually reduce the amount of information that is lost, reduce the number of queues, and reduce queue time, which results in better quality, service, and cycle time.
Handoffs can also present problems because the reward systems in different organizations and for different people might not be the same. For example, in a service organization, the customer-facing organization is usually rewarded based on customer satisfaction, but the back-office organization might be rewarded based on efficiency. Work enlargement seeks to combine these jobs into one job so that proper trade-offs can be made between customer service and efficiency.
See addition principle, cellular manufacturing, focused factory, job enlargement, process map, service quality, single point of contact.
hard currency – A freely convertible currency that is not expected to depreciate in value in the foreseeable future.
Hawthorne Effect – The concept that the act of showing attention to workers encourages better job performance.
The Hawthorne Studies (experiments) were conducted from 1927 to 1932 at the Western Electric Hawthorne Works in Chicago, where Harvard Business School professor Elton Mayo examined the relationships between work conditions and productivity. Mayo wanted to study the effects of fatigue and monotony on productivity and how rest breaks, work hours, temperature, and humidity affected productivity. In the process, Mayo stumbled upon the concept that the mere act of showing concern for people often spurs them on to better job performance. (Note: Several different interpretations of the Hawthorne Effect can be found in the literature.)
For example, if the leadership of an organization gives management training to a new employee, the employee will feel valued and will likely be motivated to work harder. The motivation is independent of the particular skills or knowledge gained from the training. This is the Hawthorne Effect at work.
The Hawthorne Effect has been called the “Somebody Upstairs Cares Syndrome.” To generalize the concept, when people have a sense of belonging and being part of a team, they are more productive.
See human resources, job design.
Hazard Analysis & Critical Point Control (HACCP) – Regulations issued by the U.S. Food and Drug Administration (FDA) to drive standardization in food safety.
Concepts center on building quality into food manufacturing processes rather than relying only on inspections and sampling. HACCP involves seven principles:
1. Analyze hazards – Identify potential hazards associated with a food and establish measures to control those hazards. The hazard could be biological (e.g., microbes), chemical (e.g., toxin), or physical (e.g., ground glass or metal fragments).
2. Identify critical control points – These are points in food production from the raw state through processing and shipping to consumption by the consumer at which the potential hazard can be controlled or eliminated. Examples are cooking, cooling, packaging, and metal detection.
3. Establish preventive measures with critical limits for each control point – For a cooked food, for example, this might include setting the minimum cooking temperature and time required to ensure the elimination of any harmful microbes.
4. Establish procedures to monitor the critical control points – Such procedures might include determining how and by whom cooking time and temperature should be monitored.
5. Establish corrective actions to be taken when monitoring shows that a critical limit has not been met – For example, food should be reprocessed or disposed if the minimum cooking temperature is not met.
6. Establish procedures to verify that the system is working properly – For example, testing time and temperature recording devices should be used to verify that a cooking unit is working properly.
7. Establish effective recordkeeping to document the HACCP system – This includes records of hazards and their control methods, the monitoring of safety requirements, and actions taken to correct potential problems.
See error proofing, Failure Mode and Effects Analysis (FMEA), hazmat, sustainability.
hazmat – A hazardous material; also called HAZMAT and dangerous goods.
Hazmat or HAZMAT is any solid, liquid, or gas that can harm people, other living organisms, property, or the environment. The term “hazardous material” is used in this context almost exclusively in the U.S. The equivalent term in the rest of the English-speaking world is dangerous goods. A hazardous material may be radioactive, flammable, explosive, toxic, corrosive, biohazardous, oxidizing, asphyxiating, or allergenic, or it may have other characteristics that make it hazardous in specific circumstances (source: http://en.wikipedia.org/wiki/HAZMAT, October 1, 2006).
See Hazard Analysis & Critical Point Control (HACCP), sustainability.
headhaul – A carrier’s primary trip, bringing a shipment to its destination.
See logistics.
hedging – Any transaction designed to reduce financial risk.
Hedging usually deals with reducing the risk of loss from price fluctuations. Hedging is usually done for defensive purposes. It is often a combination of “bets” (transactions) such that if one bet loses, another wins (i.e., taking two positions that will offset each other if prices change). In operations, hedging is commonly used to reduce the risk of a price increase for raw materials. For example, Southwest Airlines, the only major airline to remain consistently profitable shortly after the 9/11 tragedy in 2001, used a hedging strategy that allowed it to buy jet fuel for 38% less than the market price (Schlangenstein 2005). Unlike arbitrage, a hedge does not carry the implication of having an edge. Note that the word “hedge” can be used as a noun or a verb.
See arbitrage.
heijunka – A Japanese technique used to smooth production over time; also called load leveling, linearity, and stabilizing the schedule.

Dennis (2002) defined heijunka as “distribution of volume and mix evenly over time.” The Japanese word heijunka (pronounced “hey-june-kah”) literally means to “make flat and level.” Taiichi Ohno (1978) at Toyota defined heijunka as production leveling. Heijunka is considered one of the main pillars of the Toyota Production System (TPS) and is closely related to lean production. It is very similar to the concepts of production smoothing and load leveling. The following is a simple example of production smoothing.

One of the main concepts for smoothing production is frequent changes of the model mix to be run on a given line. Instead of running large batches of one model after another, TPS advocates small batches of many models over short periods of time. This is called mixed model assembly. This requires quick changeovers, but results in smaller lots of finished goods that are shipped frequently.
The main tool for heijunka is a visual scheduling board known as a heijunka box, which is generally a wall schedule with rows dedicated to each product (or product family) and columns for each time period (e.g., 20-minute periods). Colored production control kanban cards representing individual jobs are placed in the slots in proportion to the number of items to be built of a given product type during a time interval. The heijunka box makes it easy to see what types of jobs are queued for production. Workers remove the kanban cards from the front of the schedule as they process the jobs.
The heijunka box consistently levels demand by short time increments (20 minutes in this example). This is in contrast to the mass-production practice of releasing work for one shift, one day, or even a week to the production floor. Similarly, the heijunka box consistently levels demand by mix. For example, it ensures that Product C and Product D are produced in a steady ratio in small batch sizes.
Production process stability introduced by leveling makes it considerably easier to introduce lean techniques ranging from standard work to continuous flow cells. Muda (waste) declines as mura (unevenness in productivity and quality) and muri (overburden of machines, managers, and production associates) decline. When processes are leveled in volume and mix, employees are no longer overburdened, customers get better ontime delivery, and manufacturers reduce cost when muda, mura, and muri are reduced.
Although production leveling tools can be used to level the load (hours of work for the factory), demand management tools can be used to level the demand, which makes it easier to level the load.
See chase strategy, demand management, dispatching rules, job shop scheduling, kanban, lean thinking, level strategy, load, load leveling, mixed model assembly, takt time.
heijunka box – See heijunka.
help desk – A resource that provides problem-solving advice for internal or external customers.
Corporations often provide help desk support to their customers via toll-free phone numbers, faxes, websites, and e-mail. The help desk is often the part of a call center that handles support for technical products. Help desk workers sometimes use decision support software and knowledge bases to answer questions.
See call center, fulfillment, knowledge management, service management.
Herbie – The bottleneck in a process.
The question, “Where’s your Herbie?” is asking, “Where is your bottleneck?” This is based on the popular Goldratt Institute film and book entitled The Goal (Goldratt 1992), where one boy (Herbie) in the Boy Scout troop slowed down the entire troop on a long march through the woods. The teaching point here was that organizations need to “go find their Herbie and help him with his load.”
See bottleneck, Theory of Constraints (TOC).
heuristic – A simple rule of thumb (procedure) used to solve a problem.
For example, when a vehicle schedule is created, the next location selected for the vehicle might be the one closest to the last one selected. This is called the “closest customer” heuristic. Heuristics often produce very good and sometimes even the mathematically best (optimal) solutions. However, the problem with heuristics is that users seldom know how far the heuristic solution is from the optimal solution. In other words, a heuristic procedure might produce a good solution, but the solution is not guaranteed to be the optimal (best) solution. All heuristic procedures are said to be algorithms; however, not all algorithms are heuristics, because some algorithms always guarantee an optimal (mathematically best) solution. For some heuristics, it is possible to mathematically derive the “worst case” performance, the average case performance, or both.
See algorithm, genetic algorithm, operations research (OR), optimization, simulated annealing, Traveling Salesperson Problem (TSP).
hidden factory – A term for either rework or non-value-adding transactions in a system.
Rework – Armand Feigenbaum, a well-known quality expert, coined the term “hidden factory” to describe the vast amount of work needed to correct the mistakes made by others. He estimated that the hidden factory might be as much as 40% of the total cost (Feigenbaum 2004).
Non-value-added transactions – Miller and Vollmann (1985) identified a different type of “hidden factory” that processed vast numbers of internal transactions that added little or no value to customers. This is often true when a firm reduces lotsizes to move toward lean production without using visual control systems.
Eliminating both types of hidden factories (waste) is a key part of lean thinking.
See Activity Based Costing (ABC), lean thinking, rework, yield.
High Performance Work Systems (HPWS) – A form of workgroup that typically emphasizes high employee involvement, empowerment, and self-management.
HPWS generally incorporate the following features:
• More job complexity, multi-tasking, and multi-skilling.
• Increased employee qualifications.
• Ongoing skill formation through enterprise training.
• A minimum of hierarchy.
• Greater horizontal communication and distribution of responsibility (often through teams).
• Compensation incentives for performance and skill acquisition.
• Increased focus on “core activities.”
Firms that use HPWS often seek to improve organization performance through six synergistic strategies:
• Leadership that empowers others.
• Relentless focus on strategy and results.
• Open sharing of relevant information.
• Borderless sharing of power.
• Team-based design.
• Teamwork reinforced through rewards.
Unfortunately, the definition of HPWS is ambiguous, and practices vary widely between firms. HPWS is closely related to employee involvement, employee empowerment, high involvement, people involvement, high commitment systems, mutual gains enterprises, socio-technical systems, participative management, self-management, boss-less systems, self-directed work teams, and empowered work teams.
Adapted from a contribution by Aleksandar Kolekeski, ISPPI Institute, Skopje, Macedonia, [email protected], September 19, 2005.
See empowerment, human resources, job design, New Product Development (NPD), organizational design, productivity, self-directed work team.
histogram – A graphical approach for displaying frequency data as a bar chart.
Histograms can be shown vertically or horizontally. The histogram is one of the seven tools of quality. See the Pareto Chart entry to see an example of a vertical histogram.
See bar chart, Pareto Chart, seven tools of quality.
hockey stick effect – A pattern of sales or shipments that increase dramatically at the end of the week, month, or quarter.
This pattern looks like a hockey stick because it is low at the beginning of the period and high at the end. The hockey stick effect is nearly always a logical result of reward systems based on sales or shipments. The large changes cause variance in the system, which often results in increased inventories, stockouts, overtime, idle capacity, frustrated workers, and other significant problems. Clearly, the best solution is to change the reward system to motivate workers to produce and sell at the market demand rate.
One creative potential solution is to have different sales regions with offset quarters so one region has a quarter ending in January, another ending in February, etc. Another creative solution is to shorten the reporting reward period from quarters to months or even weeks. This gives the organization less time to change between the extreme priorities, and therefore provides motivation to avoid the hockey stick.
See carrying charge, carrying cost, production planning, seasonality.
holding cost – See carrying charge, carrying cost.
hoshin planning – A systematic planning methodology developed in Japan for setting goals and aligning the organization to meet those goals; also called hoshin kanri and policy deployment.
Hoshin is short for “hoshin kanri.” The word “hoshin” is from “ho,” which means direction, and “shin,” which means needle. Therefore, the word “hoshin” could translate into direction needle or compass. The word “kanri” is from “kan,” which means control, and “ri,” which means reason or logic. Taken altogether, hoshin kanri means management and control of the organization’s direction needle or focus. Hoshin planning is like a management compass that points everyone in the organization toward a common goal.
Hoshin kanri planning passes (deploys) policies and targets down the management hierarchy. At each level, the policy is translated into policies, targets, and actions for the next level down. “Catchball” is played between each level to ensure that the plans are well-understood and can be executed (see the entry catchball).
Hoshin operates at two levels: (1) the strategic planning level to define long-range objectives and (2) the daily management level to address routine aspects of business operations.
Hoshin plans should be regularly reviewed against actual performance. This review can be organized in a “hoshin review table,” which should show the owner, time frame, performance metrics, target, and results. Any difference between the target and actual results should be explained. The review tables should cascade upward.
The X-Matrix, the main tool of hoshin planning, works backward from desired results, to strategies, to tactics, to processes. See the simple example below. The planning process begins with the results, which are driven by strategies, which are driven by tactics, which are achieved by process improvements. The “correlation” cells identify causal relationships using the symbols: ![]() = strong relationship,
= strong relationship, ![]() = important relationship, and Δ = weak relationship. The accountability columns indicate roles and responsibilities for individuals, teams, departments, and suppliers. See Jackson (2006) for more details.
= important relationship, and Δ = weak relationship. The accountability columns indicate roles and responsibilities for individuals, teams, departments, and suppliers. See Jackson (2006) for more details.
Simple X-Matrix example
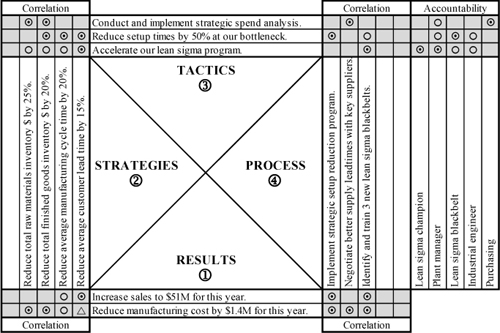
Source: Professor Arthur V. Hill
The X-Matrix is similar to Management by Objectives (MBO), developed by Drucker (1954), except that it focuses more on organizational rather than individual goals. The X-Matrix is also similar to the strategy mapping concepts developed by Kaplan and Norton (1990), the Y-tree concept used at 3M, and the causal mapping tools as presented by Hill (2011c). A strategy map requires the causal linkages: learning & growth → internal → customer → financial. In contrast, the X-Matrix requires the causal linkages: process → tactics → strategies → results. In this author’s view, an X-Matrix is more general than a strategy map, a Y-tree is more general than an X-Matrix, and a causal map is more general than a Y-tree. However, some industry experts argue that hoshin planning is unlike other strategic planning methods because it has more accountability and more “catchball” interaction between levels in the organization.
See alignment, balanced scorecard, catchball, causal map, lean thinking, Management by Objectives (MBO), mission statement, PDCA (Plan-Do-Check-Act), strategy map, Y-tree.
house of quality – See Quality Function Deployment (QFD).
hub-and-spoke system – A distribution system used by railroads, motor carriers, and airlines to consolidate passengers or shipments to maximize equipment efficiency.
Many passenger airlines in North America, such as Delta and United, have hub-and-spoke networks, where the hub is a central airport and the spokes are the routes that bring passengers to and from the hub. In contrast, the direct route (or point-to-point) system does not use a central hub airport. In North America, Southwest Airlines is an example of a direct route system. The hub-and-spoke system is an important distribution strategy. For example, FedEx, a delivery service, has a hub in Memphis, with all FedEx shipments going through this hub.
See consolidation, logistics.
human resources – (1) The employees in an organization. (2) The organizational unit (department) charged with the responsibility of managing employee-related processes such as hiring, orientation, training, payroll, benefits, compliance with government regulations, performance management (performance management, performance reviews), employee relations, employee communications, and resource planning; sometimes called the personnel organization; often abbreviated HR.
See absorptive capacity, addition principle, back office, business process outsourcing, cost center, cross-training, delegation, division of labor, empowerment, Enterprise Resources Planning (ERP), ergonomics, gainsharing, Hawthorne Effect, High Performance Work Systems (HPWS), job design, job enlargement, job rotation, labor grade, lean sigma, learning curve, learning organization, multiplication principle, on-the-job training (OJT), operations management (OM), organizational design, outsourcing, pay for skill, productivity, RACI Matrix, Results-Only Work Environment (ROWE), scientific management, self-directed work team, Service Profit Chain, service quality, standardized work, subtraction principle, unfair labor practice, value chain, work measurement, work simplification, workforce agility.
hypergeometric distribution – A discrete probability distribution widely used in quality control and auditing.
The hypergeometric distribution is useful for determining the probability of exactly x defective units found in a random sample of n units drawn from a population of size N that actually contains m defective units. It is a particularly useful distribution for acceptance sampling and auditing. The normal, Poisson, and binomial distributions are often used as approximations for the hypergeometric distribution.
The hypergeometric distribution can be used to create confidence limits on the number of errors in a population based on a sample. For example, an auditor can take a sample and then conclude with a 95% confidence level that the true percentage of errors in the population is no more than p percent. The auditor can also use this distribution to estimate the sample size required to achieve a desired confidence limit. Most statistics textbooks recommend using the normal distribution for the proportion defective; however, this is an approximation for the hypergeometric distribution and will be inaccurate when the error rate is small.
Parameters: Population size N and sample size n.
Probability mass function: ![]() , where x is the number of successes in the sample, n is the sample size, m is the number of successes in the population, and N is the size of the population. The distribution function is simply the summation of the mass function.
, where x is the number of successes in the sample, n is the sample size, m is the number of successes in the population, and N is the size of the population. The distribution function is simply the summation of the mass function.
Statistics: Range [a, b] where a = max(0, n − (N − m)) and b = min(m,n), mean πn, variance π(1 − π)n(N − n)/(N − 1), where π = m/N. The mode has no closed form.
Graph: A jar has a population of N = 100 balls, with m = 20 red balls and (N – m) = 80 white balls. Samples of n = 5 balls are drawn randomly from the jar. The graph below is the hypergeometric probability mass function for x, which is the number of red balls found in a sample.
Excel: In Excel, the probability mass function is HYPGEOMDIST(x, n, m, N), where x is the number of successes in the sample, n is the size of the sample, m is the number of successes in the population, and N is the size of the population. Excel does not have distribution or inverse functions for the hypergeometric distribution. The natural log of the gamma function (GAMMALN(x)) is useful for software implementation of this distribution. In Excel 2010, HYPGEOMDIST has been replaced by HYPGEOM.DIST, but still uses the same arguments.

Relationships with other distributions: The standard deviation for the hypergeometric distribution is equal to that of the binomial distribution times the finite population correction factor ![]() . Therefore, when the population size N is large compared to the sample size (i.e., N >> n), the correction factor is close to 1
. Therefore, when the population size N is large compared to the sample size (i.e., N >> n), the correction factor is close to 1 ![]() and the hypergeometric distribution can be approximated reasonably well with a binomial distribution with parameters n (number of trials) and p = m/N. A reasonable rule of thumb is that the hypergeometric distribution may be approximated by the binomial when N/n
and the hypergeometric distribution can be approximated reasonably well with a binomial distribution with parameters n (number of trials) and p = m/N. A reasonable rule of thumb is that the hypergeometric distribution may be approximated by the binomial when N/n ![]() 20. (The binomial differs from the hypergeometric distribution in that sampling is done with replacement.) The Poisson distribution is often used as an approximation for the hypergeometric in the auditing profession. The normal distribution can be used as an approximation for the hypergeometric when N/n
20. (The binomial differs from the hypergeometric distribution in that sampling is done with replacement.) The Poisson distribution is often used as an approximation for the hypergeometric in the auditing profession. The normal distribution can be used as an approximation for the hypergeometric when N/n ![]() 50 and np(1 − p)
50 and np(1 − p) ![]() 10.
10.
See binomial distribution, gamma function, Poisson distribution, probability distribution, probability mass function, sampling, Statistical Quality Control (SQC).
hypothesis – In the operations management context, a suggested explanation for a problem; a statement of what could be true; a proposition for how a problem might be solved.
A hypothesis consists of a statement of what could be true, often with some accompanied explanation and justification. A hypothesis requires more work by the investigator to attempt to disprove it. When attempting to address an operations problem, the best consultants work with their clients to quickly generate a large number of hypotheses about how the problem might be solved. Much of the remainder of the consulting engagement is then dedicated to testing if the hypotheses are true.
Most scientists require that a hypothesis be falsifiable, which means that it is possible to test if the statement is false. Failing to falsify a hypothesis does not prove that the hypothesis is true. A hypothesis cannot ever be accepted or confirmed because no human will ever have infinite knowledge. However, after a hypothesis has been rigorously tested and not falsified, it may form the basis for theory and for reasonable action.
See issue tree, Minto Pyramid Principle, strategy map.
I
I2 – A software vendor of Advanced Planning and Scheduling (APS) systems.
See Advanced Planning and Scheduling (APS).
ideation – A group brainstorming process that seeks to generate innovative thinking for new product development from of a group of people.
According to Graham and Bachmann (2004), ideation is done in the conceptual phase (the fuzzy front end) of the design process. Ideation has strict disciplines but allows for free-wheeling imagination. The process identifies the specific issue in need of rethinking, rethinks it in a fresh way, and evaluates the practical advisability of the resulting ideas.
See brainstorming, causal map, Kano Analysis, New Product Development (NPD), Nominal Group Technique (NGT), TRIZ.
IDOV – See Design for Six Sigma (DFSS), lean sigma.
IIE – See Institute of Industrial Engineers.
impact wheel – A graphical brainstorming tool that can be used to help a group identify and address the effects of a decision, action, or potential event.
An impact wheel exercise is a causal mapping exercise that seeks to identify the impact of an event. In some sense, the impact wheel is the opposite of a Root Cause Analysis (RCA) because a RCA seeks to identify factors that caused an event, whereas the impact wheel seeks to identify the effects that will be caused by an event.
The impact wheel is a simple structured brainstorming approach designed to help managers fully explore the potential consequences of specific events and decisions. The impact wheel can help managers uncover and manage unexpected and unintended consequences of a decision. It is a powerful tool for exploring the future that will be created by decisions made today.
The impact wheel process begins with the facilitator writing down the name for a change (event or decision) on a Post-it Note and placing it on the wall. The facilitator then engages the participants in a discussion of (1) the “impacts” extending out from the change (drawn like the spokes of a wheel), (2) the likelihood for each impact, and (3) implications of each impact (costs, benefits). The group then focuses on each of the critical impacts and repeats the process around each one. This approach can be supported by environmental scanning (to consider external issues), scenario development (to consider best-case, worst-case, status-quo, and wild-card scenarios), and expert interviews (to gain insights from subject matter experts). More detailed risk analysis might follow with a formal Failure Mode and Effects Analysis (FMEA) for each impact.
Impact wheel example
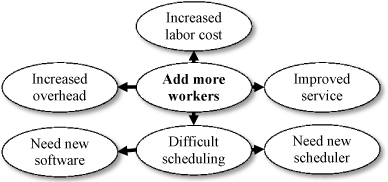
Source: Professor Arthur V. Hill
The figure on the right is a simple example of an impact wheel in a bank that is considering adding more workers. The first round identified “more difficult scheduling” as one impact of hiring more workers. The second round further identified the need to buy new software and hire a new scheduler.
See 5 Whys, brainstorming, causal map, Failure Mode and Effects Analysis (FMEA), issue tree, lean sigma, Nominal Group Technique (NGT), Root Cause Analysis (RCA).
implementation – The process of turning a plan into reality.
The term “implementation” is often used in the context of setting up a new computer-based information system (e.g., an ERP system), implementation of a new program or policy in an organization (e.g., a process improvement program), or converting the conceptual design for a computer code into the actual computer code. Implementions that require major changes often require strong leadership and cross-disciplinary project teams. In the systems context, a number of implementation approaches are discussed in practice:
• Full cutover – The old system is turned off and the new system is turned on at the same time. As a joke, this is sometimes called “cold turkey.”
• Phased cutover – Functions are tested and turned on sequentially.
• Parallel – The organization runs both the old and new systems at the same time to compare performance. This approach is not practical when the systems require decisions to be made or when a significant amount of manual data entry is required.
• Conference room pilot – The organization creates a realistic test database and then uses it to test the system and train users before the system is implemented. A pilot can be used with any of the above approaches.
The best approach (or combination of approaches) depends on the specific situation.
See Enterprise Resources Planning (ERP), lean sigma, pilot test, post-project review, project charter, RACI Matrix, Software as a Service (SaaS), stakeholder analysis, turnkey.
implied shortage cost – See shortage cost.
inbound logistics – See logistics.
See logistics, Over/Short/Damaged Report, Third Party Logistics (3PL) provider, Transportation Management System (TMS), value chain.
income statement – A standard financial statement during a certain accounting period (usually quarterly or annually) that summarizes how much money came in to a firm (income or revenue), how much money was paid out (expenses), and the difference (net income or profit) after taxes.
See balance sheet, EBITDA, financial performance metrics.
incoming inspection – The process of checking the quality and quantity of an order received from a supplier.
Incoming inspection can be done for both internal and external sources of supply. Incoming inspection samples items based on inspection policies and determines if the incoming order (batch) is acceptable or not. If it is not acceptable, the materials are reworked, returned to the vendor, or scrapped. Well-managed firms charge their suppliers for the time and materials cost of handling defective materials and use supplier scorecards to communicate assessments of their supplier’s performance.
A chargeback is a customer-assessed penalty on the supplier when the shipment is late, has poor quality, or has improper packaging. One company visited by this author received a batch of cartons that were defective. They did not know that they were defective until they started to fill the cartons with ice cream. They stopped production immediately when the problem was found, but still had significant product loss. As a result, they did not pay for the defective cartons and charged the supplier a fee for the ice cream lost due to the defective cartons.
See Acceptable Quality Level (AQL), acceptance sampling, Advanced Shipping Notification (ASN), dock-to-stock, inspection, Lot Tolerance Percent Defective (LTPD), quality management, receiving, Statistical Process Control (SPC), Statistical Quality Control (SQC), supplier scorecard.
Incoterms – Rules for trade contracts published by the International Chamber of Commerce (ICC) and widely used in international and domestic commercial transactions; also known as International Commercial terms.
Incoterms are accepted by governments and firms around the world for use in international trade, transportation, and distribution. These terms support trade by reducing ambiguity in trading relationships. Free on Board (FOB) is an example. The Incoterms in effect on January 1, 2011 can be found at www.iccwbo.org/incoterms.
incremental cost – See marginal cost.
indented bill of material – See bill of material (BOM).
independent demand – (1) The demand from external customers rather than a higher-level assembly or company-run stocking location. (2) Demand that must be forecasted rather than planned because it cannot be planned based on the plans for other items under the organization’s control.
Examples of independent demand include consumer demand for a retailer, customer orders arriving at a distributor warehouse, and demand for an end item for a manufacturing firm. Internal demand for a component that goes into an end item is considered dependent demand because this demand is planned based on the production plan for the end item.
In the 1980s, this term clearly meant demand from external customers and therefore had to be forecasted. Today, however, the term is less clear because many firms now receive detailed demand information from their customers via electronic communications, such as EDI.
See demand, dependent demand, inventory management.
indirect cost – See overhead.
indirect labor – See overhead.
indirect materials – See overhead.
inductive reasoning – Inductive reasoning is making inferences about a larger subject based on specific examples.
In contrast, deductive reasoning begins with a general “theory” or concept that makes inferences about specific applications or situations. Arguments based on experience or observation are best expressed inductively, while arguments based on laws, rules, or other widely accepted principles are best expressed deductively.
Consider the following pair of examples. John: “I’ve seen that when I throw a ball up in the air, it comes back down. So I guess that the next time I throw the ball up, it will come back down.” Mary: “I know from Newton’s Law that everything that goes up must come down. And so, if you throw the ball up, it must come down.” John is using inductive reasoning, arguing from observation, while Mary is using deductive reasoning, arguing from the Law of Gravity. John’s argument is from the specific (he observed balls being thrown up and coming back down) to the general (the prediction that similar events will result in similar outcomes in the future). Mary’s argument is from the general (the Law of Gravity) to the specific (this throw).
The difference between inductive and deductive reasoning is mostly in the way the arguments are expressed. Any inductive argument can also be expressed deductively, and any deductive argument can also be expressed inductively. John’s inductive argument was supported by his previous observations, while Mary’s deductive argument was supported by her reference to the Law of Gravity. John could provide additional support by detailing his observations, without any recourse to books or theories of physics, while Mary could provide additional support by discussing Newton’s law.
Both inductive and deductive reasoning are used in business. However, lean sigma programs often emphasize data-based decision making, which is inductive (based on hard data) rather than deductive.
See lean sigma, Minto Pyramid Principle, paradigm.
industrial engineering – The branch of engineering that deals with the design, implementation, and evaluation of integrated systems of people, knowledge, equipment, energy, and material to produce products and services in the most efficient way. ![]()
Industrial engineers draw upon the principles and methods of engineering analysis and synthesis, operations research, and the physical and social sciences to design efficient methods and systems. Industrial engineers work to eliminate wastes of time, money, materials, energy, and other resources. Typical industrial engineering issues include plant layout, analysis and planning of workers’ jobs, economical handling of raw materials, flow of materials through the production process, and efficient control of the inventory. Industrial engineers work not only in manufacturing, but also in service organizations, such as hospitals and banks. The field of industrial engineering has expanded in recent years to consider many issues across the supply chain.
See Institute of Industrial Engineers (IIE), standard time, systems engineering.
industry analysis – A methodology used to study and evaluate economic trends in an industry.
Industry analysis involves a study of the economic, socio-political, and market factors that determine the future of a sector of an economy. Major factors include relative buyer and supplier power and the likelihood of new entrants to the market. Whereas industry analysis focuses on the underlying economic factors of an entire industry, competitive analysis focuses on specific competitors and their competitive positions in the market. Porter’s Five Forces are often used as the basis for an industry analysis.
See competitive analysis, five forces analysis, operations strategy, SWOT analysis.
infinite capacity planning – See infinite loading.
infinite loading – Creating a production plan based on planned manufacturing leadtimes without regard to available production capacity; also called infinite capacity planning and infinite scheduling.
Most Materials Requirement Planning (MRP) systems use fixed planned leadtimes that are independent of the amount of work-in-process (WIP) inventory in the system. This approach implicitly assumes that all resources have “infinite” capacity and that capacity constraints will not affect the schedule. However, most MRP systems provide load reports that managers can use to see when load exceeds the capacity.
See Advanced Planning and Scheduling (APS), finite scheduling, load, Materials Requirements Planning (MRP), project management.
INFORMS – See Institute for Operations Research and the Management Sciences (INFORMS).
infrastructure – See operations strategy.
input/output control – A production planning and control method that monitors planned and actual inputs and planned and actual outputs for a resource, such as a workcenter.
If the planned input is greater than the planned output, the planned queue of work-in-process (WIP) inventory will increase. The same is true for actual input, output, and WIP. If actual WIP grows, actual throughput time will increase. Therefore, it is important to keep the planned input and output at about the same level so that WIP and throughput time do not change.
The example input/output report on the right shows the queue (backlog) starting at 3 units, shrinking when the actual input is less than the actual output, and growing when the actual output is greater than the actual input. When the planned and actual values are not the same, management should identify the cause of the differences and take action when needed.
Input/output control example

See capacity, Capacity Requirements Planning (CRP), load.
in-sourcing – See outsourcing.
inspection – The process of checking units to ensure that they are free from defects. ![]()
Inspection can be done for batch control (i.e., accept or reject a batch of parts (batch control) or process control (i.e., check if a process is in control). Inspection can use source inspection (i.e., the operator checks his or her own work), successive check (the next person in the process, or final inspection (the final produce is inspected), or some combination of the above.
Ideally, inspection is done at the source so the process has immediate feedback and has a sense of ownership of quality. Common slogans for this concept include quality at the source and early detection of defects. Most firms also conduct final inspection before products are put into finished goods inventory or delivered to customers. Inspection should also be done just before a bottleneck so valuable bottleneck time is not wasted on defective parts. More attention should be given to the gold parts that have gone through the bottleneck because valuable bottleneck capacity has been invested in these parts.
Successive check is a quality inspection system where each person checks the work done by the previous process (Shingo 1986). Theoretically, successive checks can accomplish 100% inspection by a “disinterested” person and provide almost immediate feedback and action. If successive checks are done throughout a process, the probability of a failure getting through is low, but the opportunity for repeated low-value work is high. Successive inspection requires time, which usually means that these inspections can only be done on a few potential defects. Also, successive checks may not be able to provide immediate feedback to those who made the error. The management of Andersen Corporation’s Menomonie, Wisconsin, plant measured escapes as well as defects, where an escape is defined as passing a bad part to the next workcenter and is measured by successive step inspections. Management measured escapes to identify opportunities to reduce defects.
Self check is a quality inspection system where each person checks his or her own work (Shingo 1986). In some sense, this is the ideal inspection because it means that no waste is generated for the next step in the process, and errors are found and fixed immediately. Self check can be 100%, especially when it is assisted by a poke-yoke (error-proof) device. Self check is a good example of quality at the source.
Many firms are able to eliminate incoming inspection by having suppliers certify that materials meet certain quality standards. This saves money and time for both parties. An ideal process has no inspection because products and processes are so carefully designed that inspection, a non-value-adding activity, is not needed.
See acceptance sampling, attribute, Computer Aided Inspection (CAI), cost of quality, Deming’s 14 points, error proofing, first article inspection, gold parts, incoming inspection, quality at the source, quality management, Statistical Process Control (SPC), Statistical Quality Control (SQC), supplier qualification and certification, Total Quality Management (TQM).
Installation Qualification (IQ) – See process validation.
instantaneous replenishment – Instantaneous replenishment is a materials management term that describes situations in which the entire lotsize is received all at one time.
Instantaneous replenishment is common when ordering from an outside supplier that ships the entire order quantity at one time. This is also the situation when a distribution center places an order to an internal plant because the entire order is shipped to the distribution center at one time.
Graph for non-instantous replenishment

In contrast, with non-instantaneous replenishment, the production batch (lot) does not arrive all at the same time. This is a common situation when ordering from an internal plant. As shown in the graph on the right, inventory grows when the product is being produced and declines when not being produced. When being produced, inventory grows at rate p – d, where p is the production rate and d is the demand rate. When not being produced, the inventory declines at the demand rate d. The average lotsize inventory for non-instantaneous replenishment is the (1 − d/p)Q/2 and the optimal lotsize is ![]() . As expected, as production rate p approaches infinity, d/p approaches zero, the average lotsize inventory approaches Q/2, and the optimal lotsize approaches the instantaneous EOQ.
. As expected, as production rate p approaches infinity, d/p approaches zero, the average lotsize inventory approaches Q/2, and the optimal lotsize approaches the instantaneous EOQ.
See cycle stock, Economic Order Quantity (EOQ), lotsizing methods.
Institute for Operations Research and the Management Sciences (INFORMS) – The largest professional society in the world for professionals in the field of operations research (O.R.).
INFORMS was established in 1995 with the merger of the Operations Research Society of America (ORSA) and The Institute for Management Sciences (TIMS). The society serves the scientific and professional needs of educators, investigators, scientists, students, managers, and consultants, as well as the organizations they serve, by such services as publishing 12 scholarly journals that describe the latest O.R. methods and applications and a membership magazine with news from across the profession. The society organizes national and international conferences for academics and professionals as well as members of the society’s special interest groups.
INFORMS publishes many scholarly journals, including Management Science, Operations Research, Manufacturing & Service Operations Management (MSOM), Decision Analysis, Information Systems Research, INFORMS Journal of Computing, Interfaces, Marketing Science, Mathematics of OR, Organizational Science, and Transportation Science. The INFORMS website is www.informs.org.
See Manufacturing and Service Operations Management Society (MSOM), operations management (OM), operations research (OR).
Institute for Supply Management (ISM) – A professional society for supply management professionals.
Founded in 1915, the Institute for Supply Management (ISM) claims to be the largest supply management association in the world. ISM’s mission is to lead the supply management profession through its standards of excellence, research, promotional activities, and education. ISM’s membership base includes more than 40,000 supply management professionals with a network of domestic and international affiliated associations.
Formerly known as the National Association of Purchasing Management, the organization changed its name to Institute for Supply Management in May 2001 to reflect the increasing strategic and global significance of supply management. ISM has a certification process for the Certified Purchasing Manager (C.P.M.) designation. The process requires a passing grade on the CPM exam. ISM provides many publications to its members, including the Journal of Supply Chain Management, a publication for purchasing professionals and educators.
The ISM website is www.ism.ws.
See operations management (OM), purchasing, supply chain management.
Institute of Industrial Engineers (IIE) – The world’s largest professional society dedicated solely to the support of the industrial engineering profession and individuals involved with improving quality and productivity.
Founded in 1948, IIE is an international, non-profit association that provides leadership for the application, education, training, research, and development of industrial engineering.
IIE publishes two academic journals (IIE Transactions and The Engineering Economist), a monthly news magazine (IE Magazine), and a practitioner management journal (Industrial Management).
The IIE website is www.iienet2.org.
See industrial engineering, operations management (OM).
in-stock – See service level.
integer programming (IP) – A type of linear programming where the decision variables are restricted to integer values.
The term “integer programming” is short for integer linear programming. Mixed integer programming (MIP) has some decision variables that are continuous and some that are integer.
See assignment problem, knapsack problem, linear programming (LP), mixed integer programming (MIP).
Integrated Product Development (IPD) – The practice of systematically forming teams of functional disciplines to integrate and concurrently apply all necessary processes to produce an effective and efficient product that satisfies the customer’s needs.
IPD is nearly synonymous with simultaneous engineering and concurrent engineering. Benefits claimed for IPD include less development time, fewer engineering changes, less time to market, higher quality, and higher white collar productivity.
See concurrent engineering, Engineering Change Order (ECO), New Product Development (NPD), simultaneous engineering.
intellectual capital – The sum of an organization’s collective knowledge, experience, skills, competences, and ability to acquire more; also called knowledge capital.
At least one source defined intellectual capital as the difference between book value and market value. Although this might be too strong, most management experts agree that the balance sheet and other financial statements do not reflect intellectual capital and that intellectual capital is the most valuable asset for many firms.
See intellectual property (IP), knowledge management, learning organization.
intellectual property (IP) – An intangible asset based on knowledge work.
Commercial forms of IP include software, product designs, databases, chemical compounds, drugs, and inventions. Artistic forms of IP include books, music, plays, photography, images, and movies. Organizations and individuals often use patents, trademarks, and copyrights to try to protect IP, but often the best protection for IP is avoiding unauthorized access.
See contract manufacturer, intellectual capital, knowledge management, learning organization, offshoring, outsourcing, sourcing, technology transfer.
interchangeability – See interchangeable parts.
interchangeable parts – Identical components that can be selected at random for an assembly; interchangeability is a closely related term.
Before the 18th century, highly skilled workers made parts for products, such as guns, using imprecise equipment and methods, which resulted in each product being different. The principle of interchangeable parts was developed throughout the 18th and 19th centuries. Interchangeable parts were used as early as 1814 for clocks in Switzerland.
Firms with interchangeable parts can make high volumes of identical parts and easily assemble them into products. Interchangeable parts are made to conform to standard specifications, which were made possible by the development of machine tools, templates, jigs, fixtures, gauges, measuring tools (e.g., calipers and micrometers), and industry standards (e.g., screw threads). Interchangeable parts enabled the assembly line and mass production, which were developed in the early 20th century.
Interchangeability has many benefits compared to the old craft approach to manufacturing, including (1) reduced assembly labor time and cost by allowing easy assembly and repair without custom fitting, (2) reduced repair time and cost, (3) reduced labor rates and training costs because the assembly process requires less skill, (4) easier field repair due to interchangeable parts, and (5) reduced materials cost because parts are more likely to work in the assembly.
See commonality, standard parts, standard products.
intermittent demand – See lumpy demand.
intermodal shipments – A transportation term used to describe the movement of goods by more than one mode of transportation (e.g., rail, truck, air, and ocean).
Intermodal shipments usually involve movement of goods by railroad (in a trailer or container) that originate and terminate with either a motor carrier or ocean shipping line. For example, an ocean container might be picked up by a truck, delivered to a port, transported by a ship, and then picked up by another truck in another country. In the trucking industry, intermodal often refers to the combination of trucking and rail transportation.
See logistics, mode, multi-modal shipments, trailer, Transportation Management System (TMS).
Internal Rate of Return (IRR) – The discount rate at which the net present value of the future cash flows of an investment equals the cost of the investment.
The IRR has to be found by trial and error (numerical) methods. It is the discount rate at which the net present value is zero. Given cash flows (C1, C2, ... , CN) in periods 1, 2, ... , N, the IRR is the rate of return r such that ![]() . The Compounded Annual Growth Rate (CAGR) entry provides much more detail.
. The Compounded Annual Growth Rate (CAGR) entry provides much more detail.
See Compounded Annual Growth Rate (CAGR), financial performance metrics, geometric mean, investment center.
internal setup – Work done to prepare a machine for production while the machine is down.
One of the first and most important setup reduction activities is to reduce or eliminate internal setup tasks. This is done by performing external setups, which is doing the setup work while the machine is still working.
See external setup, setup, setup time reduction methods.
interoperability – The ability of two or more diverse systems to work together.
Interoperability is the ability of two or more systems to communicate, exchange information, and use the information that has been exchanged without modification or development of custom interfaces and tools. Interoperability is often a challenge when systems are made by different manufacturers. One key to interoperability is compliance with technical specifications and standards.
See commonality, modular design (modularity), network effect.
interplant orders – Transfer of materials from one manufacturing or distribution location to another inside the same organization.
See manufacturing order, purchase order (PO).
interpolated median – A measure of the central tendency used for low resolution data (such as surveys, student grades, and frequency data) where several values fall at the median; the interpolated median is equal to the median plus or minus a correction factor that adjusts for a non-symmetrical (skewed) distribution when many observations are equal to the median.
Many experts consider the median to be a better measure of central tendency than the mean because the median, unlike the mean, is not influenced by extremely low or high values. Some people consider the interpolated median to be a better measure of central tendency than the median when many values are equal to the median (computed in the standard way) and the distribution is non-symmetrical (skewed). However, some statistical experts assert that the interpolated median does not have a good theoretical basis and was just “made up by someone who could not decide between the mean and the median.”23
When the distribution is skewed, the interpolated median adjusts the median upward or downward according to the number of responses above or below the median. A right-skewed distribution will have a positive correction factor and a left-skewed distribution will have a negative correction factor.
Define the following parameters for a data set: N is the number of observed values, im is the interpolated median, m is the median computed in the standard way, nb is the number of values below (less than) m, ne is the number of values equal to m, and na is the number of values above (greater than) m. The equation for the interpolated median is then im = m for ne = 0; otherwise im = m + (na – nb)/(2ne). If nb = na, the distribution is not skewed, the correction factor is zero, and the interpolated median will be equal to the median (i.e., im = m). (Note: nb = na will always be true when ne ![]() 1.) If nb < na, the distribution is right-skewed, the correction factor is positive, and the interpolated median is greater than the median; conversely, if nb > na, the distribution is left-skewed, the correction factor is negative, and the interpolated median is less than the median. If the number of values equal to the median (ne) is equal to zero or one, the number of values above and below the median will always be equal and the correction factor will be zero.
1.) If nb < na, the distribution is right-skewed, the correction factor is positive, and the interpolated median is greater than the median; conversely, if nb > na, the distribution is left-skewed, the correction factor is negative, and the interpolated median is less than the median. If the number of values equal to the median (ne) is equal to zero or one, the number of values above and below the median will always be equal and the correction factor will be zero.
For example, a sample of N = 7 responses for a five-point Likert survey was xi = {1,3,3,3,5,5,5} with a median of m = 3. (See the histogram below.) The number of observations below the median is nb = 1, the number above the median is na = 3, and the number equal to the median is ne = 3. The interpolated median is then im = 3.33, which is higher than the median of 3 because na > nb. The right-skewed distribution “pulls” the interpolated median above the median, but only slightly.
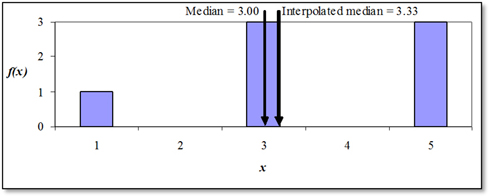
Gretchen Donahue and Corrie Fiedler, instructors at the University of Minnesota, noted that the above equation is for a five-point Likert scale and recommend using the following equations for student grades on a four-point scale: im = m, for ne = 0; im = m − 1/6 + (N/6 − nb/3)/ne, for ne> 0. With this equation the interpolated median for the above example is 3.11, which is less than the 3.33 found above, but still greater than the median.
See mean, median, skewness, trimmed mean.
interquartile range – A statistics term for the 50% of the observations included from the top of the lowest quartile to the bottom of the highest quartile of a distribution.
The interquartile range (IQR) is defined by the points at the 75th and 25th percentile of the data, and therefore, is the range that includes the middle 50% of the observations. Because the IQR uses the middle 50%, it is not affected by outliers or extreme values in the top or bottom quartiles.
See box plot, fractile, outlier, range.
interval notation – A mathematical convention for writing the range for a variable.
The interval notation uses brackets [ or ] when endpoints are included and parentheses ( or ) when end points are not included. The symbols ∞ and –∞ are used for positive and negative infinity and the union sign ∪ is used to combine sets. For example, the range [5, ∞) includes the number 5 and all values greater than 5. The range (5,7) includes all values between 5 and 7, but not the endpoints (i.e., 5 < x < 7). The range (–∞, –2] ∪ (1,∞) includes all negative values less than or equal to –2 and all positive values strictly greater than 1 with 1 not included in the range. Infinity never has an endpoint, which means that the infinity symbol is always accompanied by a parenthesis and never by a bracket. Random number generators, such as the Excel function RAND(), create a stream of values in the range [0,1), which means that it is possible (though unlikely) to get a value of 0, but never a value of one. In Excel, the random number 1 – RAND() will be in the range (0,1].
See random number, range.
interval scale – See scales of measurement.
intranet – An application of Internet technology, software, and applications within for use within an enterprise.
An intranet is a private network as opposed to the Internet, which is the public network. An intranet may be entirely disconnected from the public Internet, but is usually linked to it and protected from unauthorized access by security firewall systems. More loosely, the term may also include extranets. An intranet involves Web-based technologies and is typically used within an organization’s internal network to centralize applications or data. It is usually segmented into data or applications that all employees have access to and data or applications that are restricted to only authorized users.
See corporate portal, e-business, extranet.
in-transit inventory – The quantity of goods shipped but not yet received.
In-transit inventory may belong to either the shipper or the customer, depending on the terms of the contract.
See inventory management, logistics.
intrinsic forecasting model – See forecasting.
Inventory Dollar Days (IDD) – A Theory of Constraints (TOC) measure of investment in inventory.
The Theory of Constraints (TOC) promotes Inventory Dollar Days (IDD) as a measure of things done ahead of schedule and Throughput Dollar Days (TDD) as a measure of things done behind schedule. A dollar day is one dollar held in inventory for one day. When an individual borrows money from a bank, the interest payment is based on how many dollars are borrowed and for how long, which means that interest is based on dollar days. When a firm is holds inventory, the cost to the firm is based on the dollar days of inventory. The IDD can be calculated as IDD = (unit cost) × (quantity on hand) × (days in the system). For example, if a manufacturing order for 100 units has been waiting at a workcenter for five days and the unit cost is $2, the workcenter has 100 × 5 × 2 = $1000 dollar days for that order.
Similarly, when a firm is late, the time value of money is lost during the delay. The cost to the firm, therefore, is based on the dollar days late. TDD measures the value of each late shipment multiplied by the number of days it was late (i.e., a $1-million order five days late becomes five-million TDD).
Phillip Brooks, president and owner of H. Brooks and Company, a St. Paul, Minnesota distributor of fresh fruits and vegetables, shared the following quote with the author: “We began measuring dollar days of inventory last winter, with an item ranking and overall totals by buyer and vendor. You will find that this number will be surprisingly large and will create an insight followed by instant action – and focus on inventory items that are unneeded. In the last eight months, we have cut this measure by about 50%.”
The IDD for a set of items during a planning period is the sum of the unit cost for each item times the number of days in inventory for each item. Therefore, IDD is a time-integrated sum. Any time-integrated sum can be turned into a time-integrated average by dividing by the number of periods. Therefore, IDD divided by the number of days in the planning period is the average inventory investment. For example, if a set of items has an IDD of 30,000 dollar days during a 30-day month, the average inventory investment for the month is $1000. With a monthly carrying charge of 1%, the carrying cost for these items is $10.
See carrying cost, inventory turnover, operations performance metrics, periods supply, Theory of Constraints (TOC), throughput accounting, Throughput Dollar Days (TDD).
inventory management – Inventory management involves planning and control of all types of inventories. ![]()
Inventory management involves forecasting demand, placing purchase and manufacturing orders, and filling sales orders. Inventory management requires two decisions that must be made frequently: when to order, and how much to order. A less frequent inventory management decision is deciding if an item should be stocked. If an item is not stocked, the firm must make, assemble, or buy the item in response to customer demand.
Inventory managers may be responsible for all types of inventory:
• Raw materials/purchased components inventory – Purchased materials from outside suppliers.
• In-transit inventory – Inventory shipped, but not yet received.
• Work-in-process inventory (WIP) – Products started in manufacturing, but not yet complete.
• Manufactured components/subassemblies – Parts and subassemblies built and then stored in inventory until needed for higher-level products or assemblies.
• Finished goods inventory – Products that are complete, but not yet shipped to a customer.
• Supplies/consumables inventory – Supplies needed for the manufacturing process, but do not become a part of any product (e.g., cleaning supplies for a machine). These are often called Maintenance, Repair, & Operating Supplies (MRO) items. (Note: MRO has many similar names, including “Maintenance, Repair, and Operations” and “Maintenance, Repair, and Overhaul.”)
• Scrap inventory – Defective products that will be reworked, recycled, or scrapped.
• Consignment inventory – Products owned by one party, but held by another party until sale.
Inventory control systems must determine when to order (order timing) and how much to order (order quantity). Order timing can be based on a reorder point (R) or a fixed schedule (every P time periods). Order quantity can be a fixed quantity Q (possibly the EOQ) or a variable quantity based on an order-up-to level (T). With an order-up-to (base stock) policy, the order quantity is set to T – I, where I is the inventory position.
The table below summarizes the main inventory management approaches with respect to order timing and order quantity policies. The variable names include: P the periodic review period, Q the order quantity, T the order-up-to level, R the reorder point, S the order cost, i carrying charge, c unit cost, A annual demand in units, I current inventory position, s safety stock in units, μX mean demand during leadtime, μD mean demand per period, and μL mean leadtime.
Summary of the inventory control models
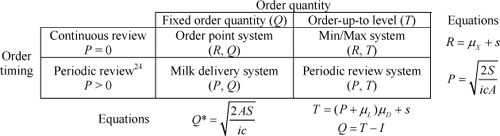
See ABC classification, active item, aggregate inventory management, carrying cost, consignment inventory, continuous replenishment planning, continuous review system, dependent demand, distribution, distributor, Economic Order Quantity (EOQ), forecasting, independent demand, in-transit inventory, inventory position, inventory turnover, joint replenishment, logistics, lotsizing methods, materials handling, materials management, Materials Requirements Planning (MRP), min-max inventory system, on-hand inventory, on-order inventory, order cost, order-up-to level, periodic review system, periods supply, pull system, purchasing, random storage location, raw materials, reorder point, safety stock, service level, square root law for safety stock, square root law for warehouses, supply chain management, vendor managed inventory (VMI), Warehouse Management System (WMS), zero inventory.
inventory position – The amount of inventory available to fill future orders; defined as on-hand plus on-order minus allocated and minus backordered inventory quantities; also called stock position. ![]()
On-hand inventory is the material that is physically located in the plant or warehouse. On-order inventory includes the materials that have been ordered but not yet received. Allocated inventory and backorders have been promised to customers or other orders and therefore are not available for use. Many textbooks and training programs simplify the definition to just on-hand plus on-order.
See allocated inventory, backorder, continuous review system, inventory management, on-hand inventory, on-order inventory, open order, order-up-to level, reorder point, supply chain management.
inventory shrink – See shrinkage.
inventory turnover – The number of times that the inventory is replaced during a time period (usually a year). ![]()
The standard accounting measure for inventory turnover is the cost of goods sold divided by the average inventory investment. For example, if a firm has an annual cost of goods sold of $10 million and an average inventory investment of $5 million, the firm has two turns per year. Inventory turnover (T) can also be defined as 52d/I, where d is the average demand in units per week and I is the average inventory in units.
If the current inventory investment is close to the average and the historical rate of consumption is close to the current rate of consumption, the inverse of the inventory turnover ratio for any inventory is approximately the periods supply. The inverse of the inventory turnover ratio for work-in-process inventory (WIP) is an estimate of the dollar-weighted cycle time for a product.
Some students confuse inventory turnover with other turnover measures. Employee turnover is the number of times that employees are replaced during a period (usually a year). Outside of the U.S., turnover usually means sales or revenue.
Hill and Zhang (2010) identified six “fallacies” regarding inventory turnover: the ratio fallacy, the end-of-period inventory fallacy, the different numerator/denominator units fallacy, the different demand fallacy, the industry average fallacy, and the common turnover (days supply) fallacy.
It is good management to have a target turnover or periods supply for a group of items. However, this well-intended policy can easily cascade down the organization and become the target for each plant, product, and raw material. Good managers should not allow this to happen.
See aggregate inventory management, asset turnover, balanced scorecard, carrying charge, carrying cost, cost of goods sold, cycle time, DuPont Analysis, employee turnover, Inventory Dollar Days (IDD), inventory management, inventory valuation, operations performance metrics, periods supply, turnover.
inventory turns – See inventory turnover.
inventory valuation – The process of assigning a financial value to on-hand inventory.
Inventory valuation is based on the standard cost and the selected accounting convention, which may be First-In-First-Out (FIFO), Last-In-First-Out (LIFO), average list price, or some other method.
See First-In-First-Out (FIFO), inventory turnover, Last-In-First-Out (LIFO).
inventory/order interface – See push-pull boundary.
inverse transform method – A simulation procedure for generating random variates from a particular theoretical or empirical cumulative probability distribution.
The distribution function F(x) for a random variable x is defined such that F(x0) = P(x < x0). The inverse distribution function is defined such that x = F−1(p) is the x value associated with the probability p for this distribution function. In other words, if p = F(x), then x = F−1 (p). The inverse transform method generates random variates using x = F−1 (r), where r is a uniformly distributed random variable in the interval (0, 1].
In Excel, the inverse transform method should use r = 1-RAND(), where r is uniformly distributed in the interval (0,1]. This is because RAND() is in the interval [0,1), which means it can generate a value of zero, which causes problems with most cumulative distribution functions.
See Erlang distribution, exponential distribution, gamma distribution, interval notation, lognormal distribution, normal distribution, random number, simulation, uniform distribution, Weibull distribution.
investment center – An accounting term for an area of responsibility that is held accountable for revenues, expenses, and invested capital.
See cost center, Internal Rate of Return (IRR), profit center, revenue center.
invoice – (Noun) An itemized statement issued by the seller to the buyer that indicates the products, quantities, prices, taxes, and payment terms for products or services the seller has provided to the buyer; also called a bill or statement. (Verb) To prepare and send such an invoice; also called billing.
Invoices are often delivered to the buyer at the time of delivery of the goods or services.
See Accounts Receivable (A/R), Electronic Data Interchange (EDI), purchase order (PO), purchasing, supplier, terms.
IPD – See Integrated Product Development.
Ishikawa Diagram – See causal map. ![]()
islands of automation – Robotic or other automated systems that function independently of other systems.
This phrase is often used in arguments to justify more integrated systems.
See automation.
ISO – International Organization for Standardization.
ISO 14001 – Certification standards created by the International Organization for Standardization related to environmental impact.
The ISO 14001 standards specify the requirements for an environmental management system to enable an organization to formulate a policy and objectives, taking into account legislative requirements and information about significant environmental impacts. It applies to those environmental aspects that the organization can control and over which it can be expected to have influence.
See quality management.
ISO 16949 quality standard – See TS 16949 quality standard.
ISO 9000 – See ISO 9001:2008.
ISO 26000 – A systematic approach developed by the International Organization for Standardization (ISO) that organizations can use to address social responsibility issues; also known as the SR standard.
Unlike ISO 9001 and ISO 14000, ISO 26000 is a guidance standard rather than a certifiable management system. It covers seven SR subjects: governance, human rights, labor practices, environment, operating practices, consumer rights, and community rights (Bowers and West 2011).
See ISO 9001:2008.
ISO 9001:2008 – A family of standards for quality management systems published by the International Organization for Standardization (ISO) that is designed to help organizations better meet the needs of their customers and other stakeholders; also called ISO 9001:2008.
According to the ISO website25, “The ISO 9000 family of standards represents an international consensus on good quality management practices. It consists of standards and guidelines relating to quality management systems and related supporting standards. ISO 9001:2008 is the standard that provides a set of standardized requirements for a quality management system, regardless of what the user organization does, its size, or whether it is in the private or public sector. It is the only standard in the family against which organizations can be certified – although certification is not a compulsory requirement of the standard. The other standards in the family cover specific aspects, such as fundamentals and vocabulary, performance improvements, documentation, training, and financial and economic aspects.”
The ISO standards can be used in three ways: (1) The standard requires the organization to audit its own quality system to verify that it is managing its processes effectively, (2) the organization may invite its clients to audit its quality system, and (3) the organization may engage the services of an independent quality system certification body to obtain an ISO 9001:2008 certificate of conformity. Note that certification is done by certification bodies and not ISO itself. An ISO certificate must be renewed at regular intervals, usually around three years. More than one-million organizations worldwide are certified.
ISO standards are based on eight principles:
1. Customer focus – Organizations should understand current and future customer needs, should meet customer requirements, and should strive to exceed customer expectations.
2. Leadership – Leaders establish unity of purpose and direction of the organization. They should create and maintain an internal environment in which people can become fully involved in achieving the organization’s objectives.
3. Involvement of people – People at all levels are the essence of the organization and their full involvement enables their abilities to be used for the organization’s benefit.
4. Process approach – A desired result is achieved more efficiently when activities and related resources are managed as a process.
5. System approach to management – Identifying, understanding, and managing interrelated processes as a system contributes to the organization’s effectiveness and efficiency in achieving its objectives.
6. Continual improvement – Continual improvement of the organization’s overall performance should be a permanent objective of the organization.
7. Factual approach to decision making – Effective decisions are based on the analysis of data and information.
8. Mutually beneficial supplier relationships – An organization and its suppliers are interdependent and a mutually beneficial relationship enhances the ability of both to create value.
Many firms using ISO can claim significant financial benefits (Naveh and Marcus 2005) and significant operational benefits (Hendricks and Singhal 2001). Some of the benefits claimed for ISO include efficiency, increased productivity, improved employee motivation, improved customer satisfaction, and increased profit.
Some critics suggest that ISO can be summarized as “document what you do and do what you document.” If that is true, a firm could be carefully following a well-documented process that is consistently producing poor quality products. Other criticisms focus on the bureaucratic overhead and the fact that many firms pursue certification purely for marketing and sales reasons without regard to actual quality.
See ISO 26000, lean sigma, lean thinking, Malcolm Baldrige National Quality Award (MBNQA), quality management, standardized work, TS 16949 quality standard.
issue – (1) In an inventory context: To physically move material from a stocking location and make the transaction for this move. (2) In a problem-solving context: A topic that deserves further attention.
See allocated inventory, backflushing.
issue log – A project management tool that records problems identified during a project and then monitors them to make sure that they are resolved.
Issue logs are usually created and maintained in an Excel file, using the following columns:
• Issue ID (optional number or code)
• Issue name (very short description)
• Description (longer description)
• Priority (A = top priority, D = low priority)
• Author (optional)
• Date created
• Due date
• Date resolved (blank until the issue is closed)
• Owner (once it has been assigned)
• Notes/actions (optional)
The issue log should be “owned” by one person, often the project manager (or admin), and should be brought to each meeting. Project team meetings should prioritize outstanding issues and make sure someone owns each of the high-priority issues. Project team meetings should also hold people accountable to complete the issues they own. Resolved issues are usually also kept in the issue log, but sorted at the bottom of the list or moved to another worksheet in the Excel workbook.
See Nominal Group Technique (NGT), project management.
issue tree – A mapping tool used to break a problem into its component issues.
In their book The McKinsey Mind, Rasiel and Friga (2001) defined an issue tree as “the series of questions or issues that must be addressed to prove or disprove a hypothesis.” Issue trees are used by many consulting firms to structure their approach to a client’s problem. Like detective work, the process starts with a set of potential solutions (hypotheses) expressed as questions. For each of the main questions (hypotheses), the issue tree starts with the question on the far left and moves to the right to identify additional questions that need to be answered to address that question. The process continues with more detailed questions on the right. Each question should guide the project team’s data collection, inquiry, and research. Ideally, the issues at any one level in the tree are “mutually exclusive and collectively exhaustive” (MECE) so that all possibilities are explored. (See the MECE entry.) If the answer is “no” to any question, further inquiry along that branch is usually not needed.
The figure below is an example of a simple issue tree that “explodes” the problem into a set of sub-issues (questions) that the consulting project needs to answer. A much larger example can be found at http://interactive.cabinetoffice.gov.uk/strategy/survivalguide/skills/s_issue.htm (March 25, 2011).
Issue tree example

Adapted from The McKinsey Mind by Rasiel & Friga (2001).
Issue trees are closely related to the Minto Pyramid Principle (Minto 1996) used by many consulting firms to structure arguments in a consulting presentation. Issue trees are similar to mindmaps and are a special case of a logic tree.
It is more important that issues be independent than MECE. For example, an outgoing shipment could be late because of mechanical problems with a truck or because the products were not ready to ship. These two events are not mutually exclusive (because they both could be true), but they can be studied independently.
Issue trees are usually drawn from left to right and are often created in Microsoft Excel or Visio. Phil Miller, Professional Director of the Carlson Consulting Enterprise at the University of Minnesota, uses an Excel workbook with these column headings from left to right: Governing question, sub-questions, sub-questions (for the sub-questions), and analysis.
See causal map, decision tree, hypothesis, impact wheel, MECE, mindmap, Minto Pyramid Principle, Root Cause Analysis (RCA), Y-tree.
item master – See bill of material (BOM).
item number – See Stock Keeping Unit (SKU).