
S
S&OP – See Sales & Operations Planning (S&OP).
SaaS – See Software as a Service (SaaS).
safety – Freedom from the occurrence or risk of injury, danger, or loss.
See DuPont STOP, error proofing, Occupational Safety and Health Administration (OSHA), risk management, risk mitigation.
safety capacity – Capacity that is available in case of an emergency; sometimes called a capacity cushion.
Safety capacity is planned “extra” capacity and can be measured as the difference between the planned capacity and planned demand. Examples include a medical doctor “on call,” a supervisor who can help in time of need, or capacity for overtime. Safety capacity is not just having too much capacity; it is capacity that is not actually working but can be called to work in case of emergency. Although safety capacity, safety stock, and safety leadtime can both be used to protect a firm from uncertain demand and supply, they are not identical concepts.
See capacity, safety leadtime, safety stock.
safety factor – See safety stock.
safety leadtime – The difference between the planned and average time required for a task or manufacturing order; called safety time by Wallace and Stahl (2003).
Safety leadtime is the “extra” planned leadtime used in production planning and purchasing to protect against fluctuations in leadtime. The same concept can be used in project scheduling. Safety leadtime should absorb the variability in the leadtimes. Whereas safety stock should be used to absorb variability in the demand and yield, safety leadtime should be used to protect against uncertainty in leadtimes or task times. Critical chain scheduling uses a buffer time to protect tasks assigned to constrained resources so they are almost never starved for work.
For example, if it takes a student an average of 30 minutes to get to school, and the student plans to leave 35 minutes before a class begins, the student will arrive 5 minutes early on average. This means that the student will have a safety leadtime of 5 minutes.
See critical chain, Master Production Schedule (MPS), purchasing leadtime, safety capacity, safety stock, sequence-dependent setup time, slack time.
safety stock – The planned or actual amount of “extra” inventory used to protect against fluctuations in demand or supply; the planned or actual inventory position just before a replenishment order is received in inventory; sometimes called buffer stock, reserve stock, or inventory buffer. ![]()
The business case for safety stock: Safety stock is management’s primary control variable for balancing carrying cost and service levels. If the safety stock is set too high, the inventory carrying cost will be too high. If safety stock is set too low, the shortage cost will be too high. Safety stock is needed in nearly all systems to protect against uncertain demand, leadtime, and yield that affect demand, supply, or both demand and supply.
Definition of safety stock: Managers often confuse safety stock with related concepts, such as an order-up-to level (for determining the lotsize), a reorder point (a “minimum” inventory for triggering a new order), or the average inventory. Safety stock is the average inventory when a new order is received. It is not the minimum, maximum, or average inventory. The figure below shows the safety stock as the lowest point on each of the three order cycles. The actual safety stock over this time period is the average of these three values.
Cycle inventory and safety stock inventory
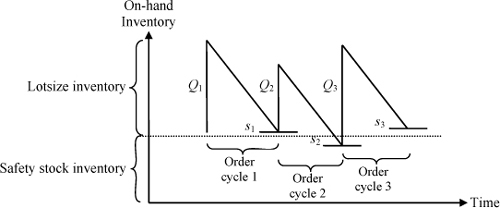
For stationary demand, the average inventory is the safety stock plus the average lotsize inventory. Given that the average lotsize inventory is half the average lotsize, the average inventory is ![]() units, where SS is the safety stock and
units, where SS is the safety stock and ![]() is the average lotsize. Therefore, safety stock can be estimated as
is the average lotsize. Therefore, safety stock can be estimated as ![]() .
.
Safety stock in different types of systems: The reorder point system, the order-up-to (target) inventory system, the Time Phased Order Point (TPOP) system, and MRP systems manage inventory with a planned (or forecasted) demand during the replenishment leadtime. Safety stock protects the organization from demand during the leadtime that is greater than planned. Therefore, safety stock should be based on the standard deviation of demand during leadtime and not just the average demand during leadtime.
Safety stock and days supply: It is a common practice to define safety stock in terms of a constant days supply. Although it is fine to communicate safety stocks in terms of days supply, it is a bad idea to use a constant days supply to set safety stock, unless all items have the same leadtime, average demand, standard deviation of demand, yield, and stockout cost.
The equation for safety stock: Define X as the demand during the replenishment leadtime. Safety stock is then SS = zσX, where z is the safety factor, which is usually between 1 and 4, and σX is the estimated standard deviation of demand during replenishment leadtime. Assuming that demand is serially independent, the standard deviation of demand during the leadtime is ![]() , where L is the fixed planned replenishment leadtime and σD is the standard deviation of demand per period. Safety stock is then
, where L is the fixed planned replenishment leadtime and σD is the standard deviation of demand per period. Safety stock is then ![]() .
.
Safety stock and the leadtime parameter L: The basic safety stock model assumes that leadtime (L) is constant. More complicated models treat leadtime as a random variable and use the average leadtime and the standard deviation of the leadtime. Therefore, leadtime can be handled in the safety stock model in three ways: (1) use a constant leadtime at the average, (2) use a constant leadtime at a value well above the average, or (3) use the safety stock based on the standard deviation of the leadtime, e.g., ![]() . When the review period P is greater than zero, the equation is
. When the review period P is greater than zero, the equation is ![]() (Silver, Pyke, and Peterson 1998).
(Silver, Pyke, and Peterson 1998).
Safety stock versus safety leadtime: As a general rule, safety stock should be used to absorb the variability in the demand (or yield), and safety leadtime should be used to protect against uncertainty in leadtimes. Whereas safety stock requires more inventory, safety leadtime requires that inventory arrive earlier.
The safety factor parameter z: The safety factor (z) determines the service level, where the service level increases as z increases. Many academic textbooks are imprecise on this subject. At least three approaches can be used to calculate the safety factor: (1) the order cycle service level approach, (2) the unit fill rate approach, and (3) the economic approach. Each of these approaches is described briefly below.
The order cycle service level approach is commonly taught in texts and implemented in major software systems (including SAP). This approach defines the service level as the probability of a shortage event on one order cycle. An order cycle is defined as the time between placing orders, and the average number of order cycles per year is A/Q, where A is the annual demand in units, and Q is the average order quantity. The safety factor for this approach is based on the standard normal distribution (i.e., z = F-1(SL). This z value can be easily calculated in Excel using NORMSINV(SL). The order cycle service level approach does not consider how many order cycles are expected per year or how many units might be short in a stockout event and is therefore not recommended.
The unit fill rate service level approach for setting the safety factor defines the service level as the expected percentage of units demanded that are immediately available from stock. This approach defines safety stock closer to the actual economics; however, this approach is much more complicated than the order cycle service level approach. No matter which service level approach is used, it is not clear how to set the best service level.
The economic approach for setting the safety factor z requires an estimate of the shortage or stockout cost per unit short (stocked out). If management is able to estimate this cost, the newsvendor model can be used to determine the safety factor that will minimize the expected total incremental cost (carrying cost plus shortage cost). This model balances the cost of having to carry a unit in safety stock inventory and the cost of having a unit shortage. Unfortunately, it is difficult to estimate the cost of a shortage (or a stockout) for one unit at the retail level. It is even more difficult to translate a shortage (or a stockout) into a cost at a distribution center, factory warehouse, or finished goods inventory.
The periodic review system: For a periodic review system with a time between reviews of P time periods, L should be replaced with L + P in all equations. In other words, when ordering only every P time periods, the safety stock is ![]() . Note that P = 0 for a continuous review system.
. Note that P = 0 for a continuous review system.
The Time Phased Order Point (TPOP) system: If a firm places replenishment orders based on a TPOP system (based on forecasts), the safety stock should be defined in terms of the standard deviation of the forecast error rather than the standard deviation of demand. Unfortunately, many managers, systems designers, professors, students, and textbooks do not understand this important concept.
See aggregate inventory management, autocorrelation, cycle stock, demand during leadtime, Economic Order Quantity (EOQ), Everyday Low Pricing (EDLP), goodwill, inventory management, lotsizing methods, marginal cost, newsvendor model, order cycle, partial expectation, periodic review system, purchasing leadtime, reorder point, replenishment order, safety capacity, safety leadtime, service level, square root law for safety stock, stockout, Time Phased Order Point (TPOP), warehouse.
Sales & Operations Planning (S&OP) – A business process used to create the Sales & Operations Plan, which is a consensus plan involving Marketing/Sales, Operations/Logistics, and Finance that balances market demand and resource capability; also called Sales, Inventory & Operations Planning (SI&OP). ![]()

S&OP is an important process in virtually all firms, but it is particularly critical in manufacturing firms. Fundamentally, S&OP is about finding the right balance between demand and supply. If demand is greater than supply, customers will be disappointed, customer satisfaction will decline, and sales will be lost. If supply is greater than demand, cost will be high.
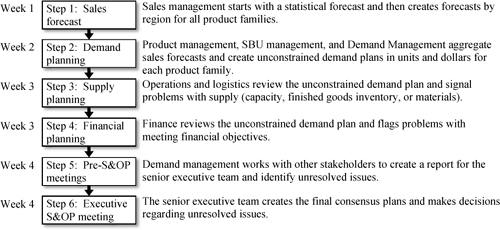
The diagram below presents an example of an S&OP process. This diagram is based on concepts found in Wallace (2004) and Ling and Goddard (1995). However, it should be noted that each firm will implement S&OP in a different way. Most experts recommend that the S&OP process be repeated each month. Step 1 usually begins with statistical forecasts at either a product or product family level. These forecasts are then modified with market intelligence from sales management, usually for each region. However, some experts argue that providing statistical forecasts to sales management gives them an easy way out of doing the hard work of creating the forecasts. Statistical forecasts are useful for the majority of products, and most experts consider it a waste of time to not use the statistical forecasts as a starting point.
In step 2, the product management and the management of the Strategic Business Unit (SBU) work with the demand management organization to convert the sales forecasts into an unconstrained demand plan, which factors in higher-level issues, such as industry trends, pricing, and promotion strategy. The demand plan is expressed in both units and dollars. In step 3, operations and logistics have the opportunity to check that the supply (either new production or inventory) is sufficient to meet the proposed demand plan. If major changes need to be made, they can be made in steps 4 or 5. In step 4 (parallel to step 3), finance reviews the demand plan to ensure that it meets the firm’s financial objectives (revenues, margins, profits) and creates a financial plan in dollars. In step 5, the demand management organization coordinates with the other organizations to put together a proposed Sales & Operations Plan that is a consensus plan from the demand plan, supply plan, and financial plan. Finally, in step 6, the executive team meets to finalize the S&OP plan. At every step in the process, assumptions and issues are identified, prioritized, and passed along to the next step. These assumptions and issues play important roles in steps 5 and 6.
An example S&OP process
Source: Professor Arthur V. Hill
See aggregate inventory management, Business Requirements Planning (BRP), Capacity Requirements Planning (CRP), chase strategy, closed-loop MRP, demand management, forecasting, level strategy, Master Production Schedule (MPS), product family, production planning, Resource Requirements Planning (RRP), Rough Cut Capacity Planning (RCCP), time fence.
Sales Inventory & Operations Planning (SI&OP) – See Sales & Operations Planning (S&OP).
salvage value – The value of an item when it is scrapped instead of sold; also known as scrap value.
Retailers and manufacturers can usually find salvage firms or discounters to buy obsolete inventory. Some companies use salvage firms to buy unsold electronic parts. The salvage firm pays a low price (e.g., $0.01 per pound) and keeps the parts in inventory for years. In the rare case of a demand, the salvage firm sells the parts back at the original book value. Large retailers often discount older products in their stores, but if that strategy does not work, they often turn to branded and unbranded Internet sales channels.
See scrap.
sample size calculation – A statistical method for estimating the number of observations that need to be collected to create a confidence interval that meets the user’s requirements.
Managers and analysts often need to estimate the value of a parameter, such as an average time or cost. However, with only a few observations, the estimates might not be very accurate. Therefore, it is necessary to know both the estimated mean and a measure of the accuracy of that estimate.
Confidence intervals can help with this problem. A confidence interval is a statement about the reliability of an estimate. For example, a confidence interval on the time required for a task might be expressed as “25 hours plus or minus 2 hours with a 95% confidence level,” or more concisely “25 ± 2 hours.” The first number (25) is called the “sample mean.” The second number (2) is called the “half-width” of the confidence interval. The “95% confidence” suggests that if we were to make this estimate many times, the true mean would be included (“covered”) in the confidence interval about 95% of the time. It is sometimes stated as, “We are 95% sure that the confidence interval contains the mean.”
Sometimes some observations have already been collected, and the goal is to develop a confidence interval from these observations. At other times, the required half-width is known, and it is necessary to find the number of observations needed to compute this half-width with a certain degree of confidence. It is also possible to express the half-width as a percentage. The five most common problems related to confidence intervals are:
• Problem 1: Create a confidence interval given that n observations are available.
• Problem 2: Find the sample size needed to create the desired confidence interval with a prespecified halfwidth.
• Problem 3: Find the sample size needed to create the desired confidence interval with a prespecified halfwidth expressed as a decimal percentage.
• Problem 4: Find the sample size needed to create the desired confidence interval on a proportion with a prespecified half-width percentage.
• Problem 5: Develop a confidence interval for a stratified random sample.
The entry in this encyclopedia on confidence intervals addresses Problem 1. For Problem 2, the goal is to find the smallest sample size n that is necessary to achieve a two-tailed 100(1 − α)% confidence interval with a prespecified half-width of h units.
Step 0. Define parameters – Specify the desired half-width h (in units), the estimated size of the population N, and the confidence level parameter α. If the size of N is large but unknown, use an extremely large number (e.g., N = 1010). Compute zα/2 = NORMSINV(1 - α/2).
Step 1. Take a preliminary sample to estimate the sample mean and standard deviation – Take a preliminary sample of n0 observations, where n0 ![]() 9 observations, and estimate the sample mean and standard deviation (
9 observations, and estimate the sample mean and standard deviation (![]() and s) from this sample.
and s) from this sample.
Step 2. Estimate the required sample size – Compute n* (zα/2 s/h)2. Round up to be conservative. If the sample size n is large relative to the total population N (i.e., n*/N > 0.05), use n* = (zα/2 s)2/(h2 + (zα/2s)2 / N instead. (This assumes that n* ![]() 30, so it is appropriate to use a z value; otherwise use the t value.)
30, so it is appropriate to use a z value; otherwise use the t value.)
Step 3. Take additional observations – If n* > n0, take n* -n0 additional observations.
Step 4. Recompute the sample mean and sample standard deviation – Recompute ![]() and s from the entire n observations.
and s from the entire n observations.
Step 5. Compute the half-width and create the confidence interval – Compute the half-width ![]() . If the sample size n is large relative to the total population N (i.e., n/N > 0.05), use
. If the sample size n is large relative to the total population N (i.e., n/N > 0.05), use ![]() instead. The confidence interval is then
instead. The confidence interval is then ![]() .
.
Step 6. Check results – Make sure that h ![]() h′; if not, repeat steps 2 to 6.
h′; if not, repeat steps 2 to 6.
The larger the number of observations (n), the smaller the confidence interval. The goal is to find the lowest value of n that will create the desired confidence interval. If n observations are selected randomly many times from the population, the confidence interval (![]() ) will contain the true mean about 100(1 - α)% of the time.
) will contain the true mean about 100(1 - α)% of the time.
See central limit theorem, confidence interval, dollar unit sampling, sampling, standard deviation.
sampling – The selection of items from a population to help a decision maker make inferences about the population.
Sampling is frequently used when it is impossible, impractical, or too costly to evaluate every unit in the population. Sampling allows decision makers to make inferences (statements) about the population from which the sample is drawn. A random sample provides characteristics nearly identical to those of the population.
One major issue in developing a sampling plan is the determination of the number of observations in the sample (the sample size) needed to achieve a desired confidence level and maximum allowable error. See the sample size calculation entry for more details.
Probability sampling includes simple random sampling, systematic sampling, stratified sampling, probability proportional to size sampling, and cluster or multistage sampling. Stratified sampling (also known as stratification) defines groups or strata as independent subpopulations, conducts random samples in each of these strata, and then uses information about the population to make statistical inferences about the overall population. Stratified sampling has several advantages over simple random sampling. First, stratified sampling makes it possible for researchers to draw inferences about groups that are particularly important. Second, stratified sampling can significantly tighten the confidence interval on the mean and reduce the sample size to achieve a predefined confidence interval. Finally, different sampling approaches can be applied to each stratum.
See acceptance sampling, Analysis of Variance (ANOVA), central limit theorem, confidence interval, consumer’s risk, dollar unit sampling, hypergeometric distribution, Lot Tolerance Percent Defective (LTPD), normal distribution, operating characteristic curve, producer’s risk, sample size calculation, sampling distribution, standard deviation, t-test, work sampling.
sampling distribution – The probability distribution for a statistic, such as the sample mean, based on a set of randomly selected units from a larger population; also called the finite-sample distribution.
A sampling distribution can be thought of as a relative frequency distribution from a number of samples taken from a larger population. This relative frequency distribution approaches the sampling distribution as the number of samples approaches infinity. For discrete (integer) variables, the heights of the distribution are probabilities (also called the probability mass). For continuous variables, the intervals have a zero width, and the height of the distribution at any point is called the probability density.
The standard deviation of the sampling distribution of the statistic is called the standard error. According to the central limit theorem, the standard error for the sample mean is always ![]() , where s is the standard deviation for the sample. Other statistics, such as the sample median, sample maximum, sample minimum, and the sample standard deviation, have different sampling distributions.
, where s is the standard deviation for the sample. Other statistics, such as the sample median, sample maximum, sample minimum, and the sample standard deviation, have different sampling distributions.
For example, an analyst is trying to develop a confidence internal on the average waiting time for a call center where the waiting time follows an exponential distribution. The analyst collects n = 101 sample waiting times and finds the sample mean and standard deviation are ![]() minutes. According to the central limit theorem, the sampling distribution for the sample mean is the normal distribution regardless of the underlying distribution. The sampling distribution for the sample mean, therefore, is normal with mean and standard deviation
minutes. According to the central limit theorem, the sampling distribution for the sample mean is the normal distribution regardless of the underlying distribution. The sampling distribution for the sample mean, therefore, is normal with mean and standard deviation ![]() minutes with a 95% confidence interval of (5.26, 5.74) minutes.
minutes with a 95% confidence interval of (5.26, 5.74) minutes.
See central limit theorem, confidence interval, probability density function, probability distribution, probability mass function, sampling.
sand cone model – An operations strategy model that suggests a hierarchy for the operations capabilities of quality, reliability, speed, and cost, where the quality is the base of the sand cone, followed by reliability, speed, and cost.
In the short-term, organizations often have to make trade-offs between cost, speed, reliability, and quality. For example, speed can sometimes be increased by using premium freight, which adds cost. However, Ferdows and De Meyer (1990) argue that in the longer run, firms can avoid trade-offs and build cumulative capabilities in all four areas. They argue that management attention and resources should first go toward enhancing quality, then dependability (reliability), then speed (flexibility), and finally cost (efficiency). They argue further that capabilities are built one on top of the other like a sand cone, where each lower layer of sand must be extended to support any increase for a higher layer. The drawing above depicts this relationship.
The sand cone model

Adapted from Ferdows, K. & A. De Meyer (1990).
Pine (1993) makes a similar argument in his book on mass customization but changes the order to cost → quality → flexibility. He argues that in the life cycle of a product, such as 3M’s Post-it Notes, the first priority was to figure out a way to make it profitable. The first small batch of Post-it Notes probably cost 3M about $50,000; but during the first year, 3M was able to find ways to automate production and bring the cost down substantially. The second priority was then to increase conformance quality to ensure the process was reliable. Some could argue that this was essentially a continuation of the effort to reduce cost. The third and last priority was to increase variety from canary yellow53 in three sizes to many colors and sizes.
See mass customization, operations strategy, premium freight.
SAP – A leading Enterprise Resources Planning (ERP) software vendor; the full name is SAP AG; SAP is the German acronym for Systeme, Andwendungen, Produkte in der Datenverarbeitung, which translated to English means Systems, Applications, Products in Data Processing.
SAP was founded in Germany in 1972 by five ex-IBM engineers. SAP is headquartered in Walldorf, Germany, and has subsidiaries in more than 50 countries. SAP America, which has responsibility for North America, South America, and Australia, is headquartered just outside Philadelphia.
See ABAP (Advanced Business Application Programming), Advanced Planning and Scheduling (APS), Enterprise Resources Planning (ERP).
satisfaction – See service quality.
satisficing – The effort needed to obtain an outcome that is good enough but is not exceptional.
In contrast to satisficing action, maximizing action seeks the biggest and optimizing action seeks the best. In recent decades, doubts have been expressed about the view that in all rational decision making the agent seeks the best result. Instead, some argue it is often rational to seek to satisfice (i.e., to get a good result that is good enough although not necessarily the best). The term was introduced by Simon (1957). (Adapted from The Penguin Dictionary of Philosophy, ed. Thomas Mautner, found at www.utilitarianism.com/satisfice.htm, April 1, 2011.)
See bounded rationality, learning curve, learning organization.
SBU – See Strategic Business Unit (SBU).
scalability – The ability to increase capacity without adding significant cost, or the ability to grow with the organization.
For example, software is said to be “scalable” if it can handle a significant increase in transaction volume.
See agile manufacturing, flexibility, resilience.
scale count – An item count based on the weight determined by a scale.
A scale count is often more economical than performing an actual physical count. This is particularly true for small inexpensive parts where slight inaccuracy is not important. Counting accuracy depends on the scale accuracy, the variance of the unit weight, and the variance of the container tare weight. Of course, the container tare weight should be subtracted from the total weight.
See cycle counting, tare weight.
scales of measurement – The theory of scale types.
According to Wikipedia, psychologist Stanley Smith Stevens developed what he called levels of measurement that include:
• Nominal scale – Categorical, labels (however, some critics claim that this is not a scale).
• Ordinal scale – Rank order.
• Interval scale – Any quantitative scale, such as temperature, that has an arbitrary zero point; although differences between values are meaningful, ratios are not.
• Ratio scale – Any quantitative scale, such as a weight, that does not have an arbitrary zero point; ratios are meaningful.
See operations performance metrics.
scatter diagram – A graphical display of data showing the relationship between two variables; also called scatterdiagram and scatterplot.
The scatter diagram is usually drawn as a set of points on a graph. When the points appear to fall along a line (e.g., from bottom left to top right), the user might hypothesize a linear relationship.
See linear regression, Root Cause Analysis (RCA), run chart, seven tools of quality.
scheduled receipt – See open order.
scientific management – An approach to management and industrial organization developed by Frederick Winslow Taylor (1856-1915) in his monograph The Principles of Scientific Management (Taylor 1911).
Taylor believed that every process had “one best way” and developed important industrial engineering and operations management approaches, such as the time and motion studies, to find that best way. For example, in one of Taylor’s most famous studies, he noticed that workers used the same shovel for all materials. His research found that the most effective load was 21.5 pounds, which led him to design different shovels for each material for that weight.
Taylor made many important contributions to the field of operations management, emphasizing time and motion studies, division of labor, standardized work, planning, incentives, management of knowledge work, and selection and training. Taylor also influenced many important thought leaders, including Carl Barth, H. L. Gantt, Harrington Emerson, Morris Cooke, Hugo Münsterberg (who created industrial psychology), Frank and Lillian Gilbreth, Harlow S. Person, and James O. McKinsey and many important organizations, such as Harvard University’s Business School, Dartmouth’s Amos Tuck School, University of Chicago, Purdue University, McKinsey (an international consulting firm), and the American Society of Mechanical Engineers. His work also influenced industrial development in many other nations, including France, Switzerland, and the Soviet Union.
One criticism of scientific management is that it separated managerial work (e.g., planning) and direct labor. This led to jobs where workers were not expected to think. In contrast, many successful Japanese firms stress the need to gather suggestions from workers and require managers begin their careers on the shop floor.
See best practices, division of labor, human resources, job design, standardized work, time study, work measurement.
scope – See project management, scope creep.
scope creep – The tendency for project boundaries and requirements to expand over time, often resulting in large, unmanageable, and never-finished projects.
Scope creep is reflected in subtle changes in project requirements over time. For example, a software project might start out as a simple table that needs to be accessed by just a single type of user. However, as the user group becomes engaged in the project, the “scope” increases to include a larger and more complicated database with multiple tables and multiple types of users.
One of the main keys to successful project management is avoiding scope creep. If the users want to increase the scope of a project, they should be required to either go back and change the charter (and get the appropriate signed approvals) or defer the changes to a new project. If management does not manage scope creep, the project will likely not be completed on time or within budget.
In a consulting context, scope creep is additional work outside the project charter that the client wants for no additional charge. If the client is willing to change the charter and pay for the work, it is an “add-on sale” and is not considered scope creep.
See focused factory, project charter, project management, project management triangle, scoping.
scoping – The process of defining the limits (boundaries) for a project.
Defining the project scope is a critical determinant of the success of a project. When scoping a project, it is just as important to define what is not in scope as it is to define what is in scope.
See project charter, project management, scope creep.
SCOR Model – A process reference model that has been developed and endorsed by the Supply-Chain Council as the cross-industry, standard, diagnostic tool for supply-chain management, spanning from the supplier’s supplier to the customer’s customer; acronym for Supply-Chain Operations Reference. ![]()
The SCOR Model

The SCOR Model allows users to address, improve, and communicate supply chain management practices within and between all interested parties. The SCOR framework attempts to combine elements of business process design, best practices, and benchmarking. The basic SCOR model is shown above.
The SCOR Model was developed to describe the business activities associated with all phases of satisfying a customer’s demand. It can be used to describe and improve both simple and complex supply chains using a common set of definitions. An overview of the SCOR Model can be found on the Supply Chain Council webpage http://supply-chain.org. Some of the benefits claimed for the SCOR Model include (1) standardized terminology and process descriptions, (2) predefined performance measures, (3) best practices, and (4) basis for benchmarking a wide variety of supply chain practices.
See benchmarking, bullwhip effect, Supply Chain Council, supply chain management, value chain.
scrap – Material judged to be defective and of little economic value.
Scrap is any material that is obsolete or outside specifications and cannot be reworked into a sellable product. Scrap should be recycled or disposed of properly according to environmental laws. A scrap factor (or yield rate) can be used to inflate the “quantity per” to allow for yield loss during a manufacturing process. The scrap value (or salvage value) is credited to factory overhead or the job that produced the scrap.
See conformance quality, cost of quality, red tag, rework, salvage value, yield.
scree plot – See cluster analysis.
scrum – A method of implementing agile software development, where teams meet on a daily basis, and computer code is delivered in two to four week “sprints.”
Scrum is similar to lean thinking in many ways. The fundamental concept of scrum is that the organization produces computer code in small “chunks” (like small lotsizes) that can be quickly evaluated and used by others. This allows for early detection of defects, a key operations management concept. This is consistent with the lean concept of reducing lotsizes and “one-piece flow.” Scrum is also similar to lean in that it requires short stand-up meetings and clear accountabilities for work. Scum defines three roles and three meetings:
The three roles:
1. Product owner – This person manages the product’s requirements and divides the work among team members and among sprints.
2. Scrum master – This person runs the daily scrum meeting.
3. Team members – These are the software developers responsible for delivering code that meets the requirements.
1. Sprint Planning Meeting – The product owner and team members meet at the start of a sprint to plan this period’s work and identify any issues that may impact the program.
2. Daily Scrum Meeting – This 15-minute meeting is led by the scrum master, and each team member is expected to answer three questions: “What did you accomplish since yesterday’s scrum meeting?”, “What will you accomplish before tomorrow’s scrum meeting?”, and “What roadblocks may impede your progress?” The sprint burndown chart, a measure of the team’s progress, is updated during this meeting. Attendees at scrum meetings are expected to stand, rather than sit, during the 15 minutes. This is to keep the meeting concise and on time.
3. Sprint Review Meeting – The product owner holds this meeting at the conclusion of a sprint, to review the state of the deliverables, and cross-check them against the stated requirements for that sprint.
See agile software development, deliverables, early detection, Fagan Defect-Free Process, lean thinking, New Product Development (NPD), prototype, sprint burndown chart, waterfall scheduling.
search cost – The cost of finding a supplier that can provide a satisfactory product at an acceptable price.
See switching cost, total cost of ownership, transaction cost.
seasonal factor – See seasonality.
seasonality – A recurring pattern in a time series that is based on the calendar or a clock.
The demand for a product is said to have seasonality if it has a recurring pattern on an annual, monthly, weekly, daily, or hourly cycle. For example, retail demand for toys in North America is significantly higher during the Christmas season. The demand for access to major highways is much higher during the “rush hours” at the beginning and end of a workday. For some firms, sales tend to increase at the end of the quarter due to sales incentives. This is known as the “hockey stick effect.”
Most forecasting models apply a multiplicative seasonal factor to adjust the forecast for the seasonal pattern. The forecast, therefore, is equal to the underlying average times the seasonal factor. For example, a toy retailer might have a seasonal factor for the month of December (i.e., the Christmas season) of 4, whereas a low demand month such as January, might have a seasonal factor of 0.6. Demand data can be “deseasonalized” by dividing by the seasonal factor. Although it is not recommended, it is also possible to use an additive seasonal factor.
See anticipation inventory, Box-Jenkins forecasting, chase strategy, exponential smoothing, forecasting, hockey stick effect, level strategy, newsvendor model, production planning, time series forecasting, trend.
self check – See inspection.
self-directed work team – Work groups that have significant decision rights and autonomy.
See High Performance Work Systems (HPWS), human resources, job design, organizational design.
sensei – A reverent Japanese term for a teacher or master.
In the lean manufacturing context, a sensei is a master of lean knowledge with many years of experience. In traditional lean environments, it is important for the sensei to be a respected and inspirational figure. Toyota uses a Japanese-trained sensei to provide technical assistance and management advice when it is trying something for the first time or to help facilitate transformational activities.
See lean thinking.
sensitivity analysis – The process of estimating how much the results of a model will change if one or more of the inputs to the model are changed slightly.
Although the concept of sensitivity analysis can be used with any model, it is a particularly powerful part of linear programming analysis. For example, in linear programming, the analyst can determine the additional profit for each unit of change in a constraint. The economic benefit of changing the constraint by one unit is called the “shadow price” of the constraint.
See linear programming (LP), operations research (OR).
sentinel event – A healthcare term used to describe any unintended and undesirable occurrence that results in death or serious injury not related to the natural course of a patient’s illness; sometimes called a “never event.”
A sentinel is a guard or a lookout. Serious adverse healthcare events are called sentinel events because they signal the need for a “sentinel” or “guard” to avoid them in the future. Examples of sentinel healthcare events include death resulting from a medication error, suicide of a patient in a setting with around-the-clock care, surgery on the wrong patient or body part, infection-related death or permanent disability, assault or rape, transfusion death, and infant abduction.
Following a sentinel event (or potential sentinel event), nearly all healthcare organizations conduct a root cause analysis to identify the causes of the event and then develop an action plan to mitigate the risk of the event reoccurring. The Joint Commission (formerly called JCAHO) tracks statistics on sentinel events.
See adverse event, causal map, error proofing, Joint Commission, prevention, Root Cause Analysis (RCA).
sequence-dependent setup cost – See sequence-dependent setup time.
sequence-dependent setup time – A changeover time that changes with the order in which jobs are started.
A sequence-dependent setup time (or cost) is a changeover time (or cost) that is dependent on the order in which jobs are run. For example, it might be easy to change a paint-making process from white to gray, but difficult to change it from black to white. Sometimes, setups are not sequence-dependent between items within a product family, but are sequence-dependent between families of products. In this case, setups between families are sometimes called major setups, and setups within a family are called minor setups.
When setup times (or costs) are sequence-dependent, it is necessary to have a “from-to” table of times (or costs), much like a “from-to” travel time table on the back of a map. Creating a schedule for sequence-dependent setup times is a particular type of combinatorial optimization problem that is nearly identical to the traveling salesperson problem.
See batch process, major setup cost, product family, safety leadtime, setup, setup cost, setup time, Traveling Salesperson Problem (TSP).
serial correlation – See autocorrelation.
serial number traceability – See traceability.
service blueprinting – A process map for a service that includes moments of truth, line of visibility, fail points, and additional information needed to create the right customer experience.
The main idea of service blueprinting is to get customers’ perspectives into the service design and improvement process. During the process design stage, business process managers, architects, interior designers, marketing managers, operations managers, and IT professionals use the service blueprint to guide the design process. After the design is completed and implemented, the blueprint defines the required features and quality of the service for the service managers. Some recommended steps for service blueprinting include:
1. Clearly identify the target customer segment.
2. Develop a process map from the customer’s point of view – This should include the choices the customers need to make when they buy and use the service. It should also include all activities, flows, materials, information, failure points, customer waiting points (queues), risk points, pain points, and handoffs.
3. Map employee actions both onstage and backstage – This involves drawing the lines of interaction and visibility and then identifying the interactions between the customer and employee and all visible and invisible employee actions.
4. Link customer and contact person activities to needed support functions – This involves drawing the line of internal interaction and linking the employee actions to the support processes.
5. Add evidence of service at each customer action step – This involves showing evidence of the service that the customer sees and receives at each point of the service experience.
The service blueprint should show all points of interaction between the customer and service providers (known as “moments of truth”), identify “fail points” and the “line of visibility,” and include fairly precise estimates of the times required for each step, including the queue times. The line of visibility separates a service operation into back office operations that take place without the customer’s presence and front office operations in direct contact with the customer. Some people argue that the only difference between a process map and a service blueprint is the identification of the fail points and the demarcation of the line of visibility.
A service blueprint is better than a verbal description because it is more formal, structured, and detailed and shows the interactions between processes. The blueprint provides a conceptual model that facilitates studying the service experience prior to implementing it and also makes the implementation easier.
See experience engineering, line of visibility, moment of truth, process design, process map, service failure, service guarantee, service management.
service failure – A situation when a service provider does not provide satisfactory service. ![]()
The best service organizations pay a great deal of attention to these situations and try to recover dissatisfied customers before they become “terrorists” and give a bad report to a large number of potential customers. (Note: The word “terrorists” has been used in this context by service quality experts for decades; however, in light of recent events, many experts are now shying away from using such a strong and emotionally charged word.)
For example, when this author was traveling through Logan Airport in Boston on the way to Europe, an airport restaurant served some bad clam chowder that caused him to get very sick (along with at least one other traveler on the same flight). As a form of service recovery, the restaurant offered a free coupon for more food. This form of service recovery was not adequate and he became a “terrorist” who reported this service failure to thousands of people. (Note: This restaurant is no longer in business in the Logan Airport.)
See service blueprinting, service guarantee, service management, service quality, service recovery.
service guarantee – A set of two promises offered to customers before they buy a service. The first promise is the level of service provided and the second promise is what the provider will do if the first promise is not kept. ![]()
Hays and Hill (2001) found empirically that a service guarantee often has more value for operations improvement than it does for advertising. A carefully defined service guarantee can have the following benefits:
• Defines the value proposition for both customers and employees.
• Supports marketing communications in attracting new customers, particularly those who are risk-adverse.
• Helps the service firm retain “at-risk” customers.
• Lowers the probability that dissatisfied customers will share negative word-of-mouth reports with others.
• Motivates customers to provide useful process improvement ideas.
• Motivates service firm employees to learn from mistakes and improve the service process over time.
• Clearly predefines the service recovery process for both customers and employees.
• Ensures that the service recovery process does not surprise customers.
A service guarantee is usually applied to organizations serving external customers, but it can also be applied to internal customers. Service guarantees are not without risk (Hill 1995). Offering a service guarantee before the organization is ready can lead to serious problems. Announcing the withdrawal of a service guarantee is tantamount to announcing that the organization is no longer committed to quality.
A service guarantee is a promise related to the intangible attributes of the service (e.g., timeliness, results, satisfaction, etc.), whereas a product warranty is a promise related to the physical attributes of the product (durability, physical performance, etc.). Product warranties are similar to service guarantees from a legal perspective and have many of the same benefits and risks.
Hill (1995) developed the figure below to show the relationship between a service guarantee and customer satisfaction. The numbers in the figure are for illustrative purposes only. The three arrows show that a service guarantee can increase the percent of customers who complain (by rewarding them to complain), the percent recovered (by having a predefined service recovery process and payout), and the percent satisfied (by motivating learning from service failures). Organizations never want to increase the percent of dissatisfied customers, but they should want to increase the percent of dissatisfied customers who complain so they hear all customer complaints. Service guarantees inflict “pain” on the organization, which motivates the organization to learn faster.
Service guarantees, service failures, and customer satisfaction

Source: Professor Arthur V. Hill (1995)
From 1973-1980, Domino’s Pizza offered a “30-minutes or it’s free” guarantee. Unfortunately, Domino’s settled major lawsuits for dangerous driving in 1992 and 1993, which led the firm to abandon its on-time delivery guarantee and replace it with an unconditional satisfaction guarantee (source: Wikipedia, March 28, 2011).
A Service Level Agreement (SLA) is essentially a service guarantee for commercial customers. See the Service Level Agreement (SLA) entry for a comparison of service guarantees, SLAs, and product warranties.
See brand, caveat emptor, durability, performance-based contracting, response time, risk sharing contract, service blueprinting, service failure, Service Level Agreement (SLA), service management, service quality, service recovery, SERVQUAL, value proposition, warranty.
service level – A measure of the degree to which a firm meets customer requirements. ![]()
Service level is often measured differently for make to stock (MTS) and respond to order (RTO) products. It is possible, however, to define a general service level metric for both MTS and RTO. The following three sections describe these three types of service level metrics.
Service level metrics for make to stock (MTS) products – Retailers, distributors, and manufacturers that make and or sell products from inventory (from stock) need a service level measure that reflects the availability of inventory for customers. For make to stock (MTS) products, the service level is usually measured as a fill rate metric. The unit fill rate is the percentage of units filled immediately from stock; the line fill rate is the percentage of lines filled immediately from stock; and the order fill rate is the percentage of orders filled immediately from stock. The terms “fill rate” and “service level” are often used synonymously in many make to stock firms.
Many textbooks, such as Schroeder et al. (2011) and most major ERP systems (e.g., SAP) define the service level for MTS products as the order cycle service level, which is the probability of not having a stockout event during an order cycle. However, this is a poor service metric because it does not take into account the number of order cycles per year or the severity of a stockout event. See the safety stock entry for more detail.
Best Buy and other retail chains measure service level with the in-stock position, which is the percentage of stores in the chain (or the percentage of items in a store) that have the presentation quantity54. The presentation quantity is the minimum number of units needed to create an attractive offering for customers. The calculation of in-stock for an item is (Number of stores that have the presentation minimum on-hand)/(Total number of stores stocking that item).
Service level metrics for respond to order (RTO) products – Respond to order products are assembled, built, fabricated, cut, mixed, configured, packaged, picked, customized, printed, or engineered in response to a customer’s request (order). The service level for these products is usually measured as the percent of orders that are filled on time, otherwise known as on-time delivery (OTD), which is the percent of orders shipped (or received) complete within the promise date (or request date).
Ideally, firms should compute OTD based on the customer request date, because the promise date may or may not satisfy the customer’s requirements. However, most firms find it difficult to use the request date because customers can “game” the request date to get a higher priority. Measuring OTD is further complicated by the fact that the supplier can update the promise date as the situation changes so orders are rarely late. Firms should compute OTD from the customer’s perspective. Therefore, firms should measure OTD based on the customer receipt date rather than the manufacturer’s ship date. However, most firms do not have access to the customer receipt date, and therefore measure OTD against their shipping dates, and then hold their distribution/transportation partners responsible for their portion of the customer leadtime.
OTD can be improved by either (1) making safer promises (e.g., promise three weeks instead of two weeks) or (2) reducing the mean or variance of the manufacturing leadtime. The first alternative can have a negative impact on demand. The second alternative requires lean sigma thinking to reduce the mean and variability of the customer leadtime. Hill and Khosla (1992) and Hill, Hays, and Naveh (2000) develop models for the leadtime elasticity of demand and for finding the “optimal” customer leadtime to offer to the market.
The customer leadtime for an RTO product is the actual time between the order receipt and the delivery to the customer. Customer leadtime, therefore, is a random variable that has a mean, mode, standard deviation, etc. The planned leadtime (or planned customer leadtime) is usually a fixed quantity, which may be conditioned on some attribute of the order (quantity, complexity, routing, materials, size, etc.). For example, a firm might offer a two-week leadtime for standard products and a three-week leadtime for non-standard products.
Some academics define additional performance metrics for RTO products, such as the mean and standard deviation of lateness, earliness, and tardiness. Define A as the actual delivery date (or time) and D as the due date (or time) for a customer order. Lateness is then defined as D - A, earliness is defined as max(D-A, 0), and tardiness is defined as max(A-D, 0). Lateness can be either positive or negative. Negative lateness means that the delivery was early. Neither earliness nor tardiness can be negative. Earliness is zero when an order is on time or late and tardiness is zero when an order is on time or early. Average earliness is commonly calculated only for early orders and average tardiness is commonly calculated only for tardy orders. Using more sophisticated mathematical notation, earliness is (D - A)+ and tardiness is (A - D)+, where (x)+ = max(x, 0). Some systems prioritize orders based on lateness.
General service level metrics for both MTS and RTO products – It is possible to use a service level metric for both MTS and RTO products by defining the fill rate as the percent of units, lines, or orders shipped by the due date. Some firms call this on-time and complete. Some members of the Grocery Manufacturing Association in North America use a fill rate metric called the perfect order fill rate, which is the percent of orders shipped on time, to the correct customer, to the correct place, complete (right quantity), free of damage, in the right packaging, with the correct documentation, and with an accurate invoice. However, some firms have backed away from the perfect order fill rate because it may be more demanding than customers expect, which means that it is more expensive than customers need. This suggests that firms should customize their perfect order metric to the needs of their market.
See aggregate inventory management, carrying cost, commonality, customer service, delivery time, dispatching rules, goodwill, inventory management, job shop scheduling, make to stock (MTS), materials management, mixed model assembly, on-time delivery (OTD), operations performance metrics, order cycle, purchase order (PO), purchasing, reorder point, respond to order (RTO), safety stock, Service Level Agreement (SLA), service management, slow moving inventory, stockout.
Service Level Agreement (SLA) – An arrangement between a service provider and a customer that specifies the type and quality of services that will be provided.
A Service Level Agreement (SLA) is usually a legally binding contract, but it can also be an informal agreement between two parties. The SLA is an effective means for the customer and supplier to engage in a serious discussion at the beginning of a relationship to determine what is important to the customer and clearly specify expectations. The service provider is usually obliged to pay the customer a penalty if any condition in the SLA is not satisfied. SLA conditions often include a definition of services, performance measurement, problem management, customer duties, warranties, disaster recovery, and termination of agreement. SLAs are also used to monitor a supplier’s performance and force the supplier to take corrective action when the conditions of the agreement are not met.
An SLA is essentially a service guarantee for a commercial (B2B) market. Service guarantees are usually designed for consumers (B2C) and are very short (e.g., as short as one sentence). In contrast, SLAs are usually designed for commercial customers (B2B) and usually require several pages of legal terminology. An Operating Level Agreement (OLA) is essentially an SLA within a firm. OLAs are often the key tool for achieving SLAs. A warranty is essentially a legally binding SLA for product performance rather than service performance.
Examples of an SLA: (1) A number of capital equipment firms offer a range of options (a menu) of field service SLAs to their customers that allow customers to make trade-offs between the price and service quality as measured by equipment downtime, technician response time, etc. (2) The best-known SLAs are in the telecommunications markets where the service provider might provide SLAs that specify uptime requirements. (3) Many firms use SLAs in an outsourcing relationship to clarify the business requirements for both parties.
See business process outsourcing, downtime, field service, outsourcing, performance-based contracting, service guarantee, service level, service management, service quality, warranty.
service management – A product that is simultaneously produced and consumed. ![]()
Services are said to be intangible, which means that the service is not a physical “thing.” However, many (if not most) services have facilitating goods. For example, a dinner at a nice restaurant will have comfortable chairs, nice plates, and good food. However, the chairs, plates, and food are not the service; they are only the facilitating goods for the service. Services cannot be inventoried, which means that they cannot be stored. For example, a flight from London to Paris at noon on July 4, cannot be “stored” in inventory until July 5. Once the aircraft has taken off, that capacity is gone forever.
Although most services are labor intensive (e.g., haircuts, surgery, and classroom instruction), some are capital intensive (e.g., power generation). Many services require that the customer have intensive customer contact in the process throughout the production of the service (e.g., surgery), others require limited contact with the customer at the beginning and end of the process (e.g., car repair), and some require no customer involvement at all (e.g., police protection). Using McDonald’s as an example, Levitt (1972) argue that both labor intensive and capital intensive services should be managed more like factories with respect to standardization, technology, systems, and metrics.
See Application Service Provider (ASP), back office, business process outsourcing, call center, Customer Effort Score (CES), experience engineering, help desk, labor intensive, line of visibility, Net Promoter Score (NPS), operations performance metrics, production line, service blueprinting, service failure, service guarantee, service level, Service Level Agreement (SLA), Service Profit Chain, service quality, service recovery, SERVQUAL, Software as a Service (SaaS), transactional process improvement.
service marketing – See service management.
service operations – See service management.
service parts – Components, parts, or supplies used to maintain or repair machinery or equipment; spare parts.
Service parts are sometimes called spare parts, but the term “spare” implies that they are not needed, which is often not the case (Hill 1992). Service parts are usually considered to be Maintenance-Repair-Operations (MRO) items. The slow moving inventory entry presents an inventory model based on the Poisson distribution for managing service parts.
See aftermarket, bathtub curve, field service, Maintenance-Repair-Operations (MRO), slow moving inventory.
Service Profit Chain – A conceptual model for service management that relates employee satisfaction to customer satisfaction, revenue and profit.
The Service Profit Chain, developed by Heskett, Jones, Loveman, Sasser, and Schlesinger (1994) and Heskett, Sasser, and Schlesinger (1997), begins with “internal service quality,” which involves workplace design and job design for employees. The central concept is that if employees are satisfied, they will have lower labor turnover (higher employee retention) and better productivity. Higher employee satisfaction, retention, and productivity then translate into better “external service value” and satisfaction for the customer. This higher customer satisfaction then translates into higher customer loyalty, revenue, and ultimately into sales growth and profitability for the firm. This model is promoted by several consulting firms, including Heskett’s firm, the Service Profit Chain Institute (www.serviceprofitchain.com). The figure below shows the Service Profit Chain.
The Service Profit Chain
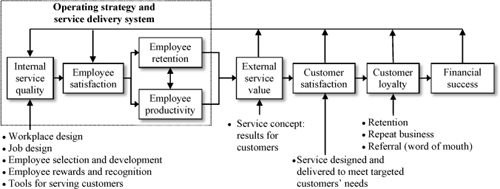
Adapted from Heskett, Jones, Loveman, Sasser, & Schlesinger (1994)
See human resources, job design, operations strategy, service management, service quality.
service quality – A customer’s long-term overall evaluation of a service provider. ![]()
Hays and Hill (2001) defined service quality as a customer’s long-term overall evaluation of a service provider and customer satisfaction as the customer’s evaluation of a specific service episode (a service event). However, some authors reverse these definitions. Service quality is perceived differently based on three types of product attributes: search qualities, experience qualities, and credence qualities.
Search qualities – Product attributes that can be fully evaluated prior to purchase. For example, the color of a dress purchased in a store can easily be evaluated before purchase. Color, style, price, fit, and smell are generally considered to be search qualities.
Experience qualities – Product attributes that cannot be evaluated without the product being purchased and consumed (experienced) by the customer. For example, the flavor of a food product cannot be evaluated until it is consumed. Given that the customer cannot fully evaluate the quality of the product until it is purchased, customers often have to rely more on personal recommendations for products that have experience qualities.
Credence qualities – Product attributes that cannot easily be evaluated even after purchase and consumption. For example, the quality of the advice from lawyers, doctors, and consultants is often hard to evaluate even after the advice has been given, because it is often quite subjective.
Zeithaml, Parasuraman, and Berry (1988) and many others define the service quality “gap” as the difference between the expectations and the delivery for a particular service episode. However, this model suggests that service quality (or customer satisfaction) is high when customers expect and receive mediocre service. In response to this problem, this author created the simple FED-up model, which states that F equals E minus D, where F = Frustration, E = Expectation, and D = Delivery. When F = 0, the customer is not necessarily satisfied; the customer is just not frustrated. In other words, no gap between expectation and delivery is not satisfaction, but rather the absence of dissatisfaction.
The critical incidents method is a good approach for identifying potential service quality dimensions. (See the critical incidents method entry.) The gap model is a good structure for measuring these dimensions on a survey, because it measures both importance and performance for each dimension of service quality. The gap model defines the gap as importance minus performance. Thus, if a service quality dimension has high importance but has low performance, it has a large gap and should be given high-priority.
Many hotels use three questions to measure customer satisfaction and service quality:
• Willingness to return – Do you intend to return to our hotel in the next year?
• Willingness to recommend – Would you recommend our hotel to your friends and family?
• Overall satisfaction – Overall, were you satisfied with your experience at our hotel?
More recently, many hotels have simplified the measurement process and now use the Net Promoter Scale developed by Reichheld (2003), which is a modification of the “willingness to recommend” question above. Dixon, Freeman, and Toman (2010) claim that the Customer Effort Score (CES) is a better predictor of customer loyalty in call centers than either the NPS or direct measures of customer satisfaction.
A common consultant’s exhortation to service leaders is to “delight our customers!” However, great care should be taken in applying this slogan. For example, when this author traveled to Europe several years ago, an airline agent allowed him the option of using a domestic upgrade coupon to upgrade from coach to business class. He was delighted to be able to sit in business class for the eight-hour flight. However, a couple of weeks later, he flew the same route and was denied the same upgrade and therefoe was quite disappointed. The principle here is that today’s delight is tomorrow’s expectation. Service providers should not delight customers unless they can do so consistently, and when they do perform a “one-off” special service, they should manage the customer’s expectations for the future.
Pine and Gillmore’s (2007) book on “Authenticity” argues that in a world increasingly filled with deliberately staged experiences and manipulative business practices (e.g., frequent flyer miles), consumers choose to buy based on how real and how honest they perceive a service provider to be. This is related to the moment of truth concept.
It is sometimes possible to improve service quality by changing customer perception of waiting time using one of Maister’s (1985) eight factors that affect customer perceptions of wait time:
• Unoccupied waits seem longer than occupied waits – An unoccupied wait is one where the customer has nothing to do or to entertain them; in other words, the customer is bored.
• Pre-process waits seem longer than in-process waits – For example, a patient might feel better waiting in the exam room (in-process wait) than in the waiting room (pre-process wait).
• Anxiety makes waits seem longer.
• Uncertain waits seem longer than waits of a known duration – Therefore, manage customer expectations.
• Unexplained waits seem longer than explained waits.
• Unfair waits seem longer than equitable waits.
• The more valuable the service, the longer people will be willing to wait.
• Waiting alone seems longer than waiting with a group – This is an application of the first factor.
ASQ has a Service Quality Division that has developed The Service Quality Book of Knowledge. More information on this book can be found on ASQ’s website http://asq.org.
See critical incidents method, Customer Effort Score (CES), customer service, empathy, empowerment, experience engineering, human resources, Kano Analysis, line of visibility, moment of truth, Net Promoter Score (NPS), primacy effect, quality management, service failure, service guarantee, Service Level Agreement (SLA), service management, Service Profit Chain, SERVQUAL, single point of contact, triage.
service recovery – Restoring customers to a strong positive relationship with the firm after they have experienced a service failure. ![]()
The service recovery principle (slogan) is, “It is much easier to keep an existing customer than it is to find a new one.” Many consultants make unsubstantiated claims about this by stating that “It costs about ten times more to win a new customer than it does to keep an existing customer.” The customer acquisition cost is the cost of finding a new customer and the service recovery cost is the cost of keeping a customer. Customer acquisition cost includes costs related to sales calls, advertising, direct mail, and other marketing communications, all of which can be quite expensive. Some firms measure the annual customer acquisition cost as the advertising budget divided by the number of new customers during a year. This analysis regularly finds good support for the claim that customer acquisition cost is high. Service recovery cost is the cost of compensating customers for a service failure plus some administrative cost, both of which are usually modest compared to the life-time value of the customer.
The six steps to service recovery are (1) listen, (2) apologize and show empathy, (3) ask the service recovery question “What can we do to completely satisfy you?” (4) fix the problem quickly (prioritize customers and escalate if needed), (5) offer symbolic atonement (something tangible the customer will appreciate), and (6) follow up to ensure that the relationship is fixed. Steps 3 and 5 of this process are particularly important, because they ensure the customer has been completely restored to a healthy relationship with the service provider.
This author developed the three fixes of service quality, which are (1) ensure the customer’s specific problem is fixed, (2) ensure the customer relationship is fixed so he or she will return, and (3) ensure the system is fixed so this problem never recurs. Step (3) here requires root cause analysis and error proofing.
See acquisition, error proofing, Root Cause Analysis (RCA), service failure, service guarantee, service management.
serviceability – The speed, courtesy, competence, and ease of repair.
Serviceability is often measured by mean response time and Mean Time to Repair (MTTR).
See Mean Time to Repair (MTTR), New Product Development (NPD).
SERVQUAL – A service quality instrument (survey) that measures the gap between customer expectations and perceptions after a service encounter.
The SERVQUAL instrument developed by Parasuraman, Zeithaml, and Berry (1988) has been used in numerous service industries. The instrument is organized around five dimensions of customer service:
Tangibles – Physical facilities, equipment, and appearance of personnel
Reliability – Ability to perform the promised service dependably and accurately
Responsiveness – Willingness to help customers and provide prompt service
Assurance – Competence, courtesy, credibility, and security
Empathy – Access, communication, and understanding
The diagram below is the SERVQUAL model (Zeithaml, Parasuraman, and Berry 1988) with several adaptations made by this author. Customers get their expectations from their own past experiences with the service provider, experiences with other service providers, their own intrinsic needs, and from communications from the service provider. The basic concept of the model is that Gap 5 (the service quality gap) exists when the perceived service does not meet the expected service. This gap is the result of one or more other gaps. Gap 1 (the product design gap) is a failure to understand the customer’s needs and expectations. Gap 2 (the process design gap) is a failure to design a process consistent with the product design. Gap 3 (the production gap) is a failure to actually deliver (produce) a service that meets the needs of a specific customer. Gap 4 (the perjury gap) is a failure to communicate to set and manage customer expectations. In summary, service providers should avoid the product design, process design, production, and perjury gaps in order to avoid the service quality gap and consistently deliver satisfying customer experience.
Teas (1994) and others challenge SERVQUAL in a number of ways. One of the main criticisms is that it defines quality as having no gap between expectation and delivery. However, some argue that service quality is not a function of the gap, but rather a function of the delivered value, which has no connection with the gap. For example, if someone hates McDonald’s hamburgers and goes to a McDonald’s restaurant and buys a hamburger, the customer gets what he or she expects. However, the customer will not perceive this as good quality. See the discussion of the FED-up model in the service quality entry for a simple model that addresses this issue.
SERVQUAL Model (Adapted)

Adapted by Professor A.V. Hill from Zeithaml, Parasuraman, & Berry (1988).
See customer service, empathy, service guarantee, service management, service quality.
setup – The activity required to prepare a process (machine) to produce a product; also called a changeover.
A setup is a common term in a factory where the tooling on a machine has to be changed to start a new order. However, setups are an important part of all human activity. For example, a surgical operation has a setup time and setup cost to prepare the operating room for a surgery. A racecar has a changeover when it goes in for a pit stop on a racetrack. Adding a new customer to a database is also a setup process.
See batch process, external setup, internal setup, sequence-dependent setup time, setup cost, setup time, setup time reduction methods.
setup cost – In a manufacturing context, the cost to prepare a process (e.g., a machine) to start a new product; in a purchasing context, the cost to place a purchase order; also known as the changeover cost or order cost. ![]()
The setup cost (or ordering cost) is an important parameter for managerial decision making for manufacturers, distributors, and retailers. This cost is particularly important when making order sizing (lotsizing, batchsize) decisions. If the ordering cost is close to zero, the firm can justify small lotsizes (order sizes) and approach the ideal of just-in-time (one-piece flow). In a purchasing context, the ordering cost is the cost of placing and receiving an order. In a manufacturing context, the setup cost is the cost of setting up (changing over) the process to begin a new batch. This cost is usually called the “setup” or “changeover” cost.
In both the purchasing and manufacturing contexts, the ordering cost should reflect only those costs that vary with the number of orders. For example, most overhead costs (such as the electricity for the building) are not relevant to lotsizing decisions and therefore should be ignored. The total annual ordering cost is dependent only on the number of orders placed during the year.
The typical standard costing approach used in many firms includes allocated overhead in the order cost. In a manufacturing context, the number of standard labor hours for the machine setup is multiplied by the “burden” (overhead) rate. For many firms, the burden rate is more than $200 per shop hour. Many accountants make the argument that “all costs are variable in the long run,” and therefore the overhead should be included in the ordering cost. Although this argument is probably true for product costing, it is not true for estimating the ordering cost for determining lotsizes. Inventory theorists argue that the ordering cost (setup cost) should be treated as a marginal cost, which means overhead costs should be ignored.
In the purchasing context, the cost components include the following:
• Order preparation component – Computer processing, clerical processing.
• Order communication component – The marginal cost of mailing, faxing, or electronic communication of the order to the supplier.
• Supply order charge – Any order processing charge from the supplier.
• Shipping cost component – The fixed portion of the shipping cost (note that the per unit shipping cost should be considered part of the unit cost and not part of the ordering cost).
• Receiving cost – Cost of handling the receipt of an order. This cost includes the accounting costs, the per order (not per unit) inspection costs, and the cost of moving the order to storage. Again, costs that vary with the number of units should not be included here.
In the manufacturing context, the cost components included in the setup cost include the following:
• Order preparation component – Computer processing and clerical processing.
• Order communication component – Sending the order paperwork or electronic information to the shop floor.
• Setup labor cost component – The incremental labor cost of setting up the machine. This cost should include the workers’ hourly wage and fringe, but should not be assigned any other factory overhead (burden).
• Opportunity cost of the machine time lost to setup – At a bottleneck machine, time lost to a setup has tremendous value. In fact, for every hour that the bottleneck is sitting idle, the entire plant is also idle. Therefore, the opportunity cost of the capacity at the bottleneck is the opportunity cost of lost capacity for the entire plant. For example, if a plant is generating $10,000 in gross margin per hour, one hour lost to a setup at the bottleneck has an opportunity cost of $10,000. The opportunity cost for time lost to a setup at a nonbottleneck machine is zero. Goldratt and Cox (1992) and Raturi and Hill (1988) expand on these ideas.
• Shop floor control cost component – The cost of handling data entry activities associated with the order. Again, this is the cost per order that is handled.
Many plants have large setups between families of parts and small setups between parts within a family. The setups between families are sometimes called major setups and the setups between parts within a family are called minor setups.
A sequence-dependent setup time (or cost) is a changeover time (or cost) that is dependent on the order in which jobs are run. For example, it might be easy to change a paint-making process from white to gray, but difficult to change from black to white. Sometimes, setups are not sequence-dependent between items within a product family, but are sequence-dependent between families of products. When setup times (or costs) are sequence-dependent, it is necessary to have a “from-to” table of times (or costs), much like a “from-to” travel time table on the back of a map. Creating a schedule for sequence-dependent setup times is a particular type of combinatorial optimization problem that is nearly identical to the traveling salesperson problem.
See batch process, burden rate, carrying charge, carrying cost, continuous process, joint replenishment, major setup cost, opportunity cost, order cost, overhead, product family, sequence-dependent setup time, setup, setup time, Single Minute Exchange of Dies (SMED), standard cost, Theory of Constraints (TOC), Traveling Salesperson Problem (TSP).
setup time – The time required to prepare a machine for the next order; also called changeover time. ![]()
See batch process, continuous process, downtime, Economic Lot Scheduling Problem (ELSP), run time, sequence-dependent setup time, setup, setup cost, setup time reduction methods, Single Minute Exchange of Dies (SMED).
setup time reduction methods – Procedures used to reduce the time and cost to change a machine from making one type of part or product to another; also called Single Minute Exchange of Die and rapid changeovers. ![]()
For many processes, the key to process improvement is to reduce the setup time and cost. Setup time does not add value to the customer and is considered “waste” from the lean manufacturing point of view. Reducing setup times often provides significant benefits, such as less direct labor time, less direct labor cost, more available capacity, better customer service, better visibility, less complexity, and easier scheduling. Setup reduction also enables small lotsizes, which in turn reduces the variability of the processing time, reduces queue time, reduces cycle time, and ultimately improves quality through early detection of defects. In addition, setup reduction helps an organization strategically, because fast setups allow for quick response to customer demands.
Many firms have setups simply because they do not have enough volume to justify dedicating a machine to a particular part or product. In some cases, if a firm can reduce setup costs, it can function as though it has the same economies of scale as a much larger firm.
One of the best methods for reducing setup time is to move setup activities off-line, which is setup time done while the machine is still running. Another name for this is an external setup. This author uses the more descriptive term running setup, because the next job is being set up while the machine is still running. The figure below is a timeline that shows that external (off-line) setup is done while the machine is working, both before and after the internal (on-line) setup time.
Timeline showing external and internal setup time
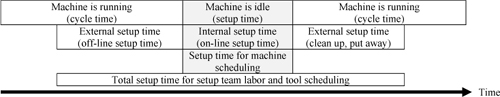
Source: Professors Arthur V. Hill and John P. Leschke
For example, at the Indianapolis 500 race, the crew will prepare the tires, fuel, and water for the race car while the car is still going around the track. When the racecar arrives in the pit area, the crew changes all four tires, adds fuel, and gives the driver water. All of this is done in about 18 seconds. Another example is a surgical procedure in a hospital where the nurses prepare a patient while another patient is still in surgery.
Setup teams can also reduce setup times. When a setup is needed, a signal (e.g., a light) indicates that all members of the setup team should converge on the machine. The setup team then quickly does its job. Some people who do not understand managerial accounting might challenge the economics of using a team. However, for a bottleneck process, the labor cost for the setup team is often far less than the cost of the capacity lost to a long setup. In other words, the increased capacity for the bottleneck and the plant is often worth more than the cost of the setup team.

Source: Bertvan Dijk /Wikimedia Commons
Tooling, fixtures, and jigs also need to be managed well to reduce setup time. Buying dedicated tools can often be justified with an analysis of the economic benefits of setup reduction. Using a setup cart that is carefully managed with 5S principles can also help reduce setup time.
Managers and engineers have only a limited time available for setup reduction. Therefore, it is important that setup reduction efforts be prioritized. Goldratt (1992) emphasizes that the priority should be on the bottleneck capacity. Leschke (1997a, 1997b) and Leschke and Weiss (1997) emphasize that some setups are shared by many items and therefore deserve higher priority in a setup reduction program.
See agile manufacturing, cycle stock, early detection, external setup, internal setup, mixed model assembly, multiplication principle, one-piece flow, process, running setup, setup, setup time, Single Minute Exchange of Dies (SMED), staging, Theory of Constraints (TOC).
seven tools of quality – A set of seven fundamental tools used to gather and analyze data for process improvement: histogram, Pareto Chart, checksheet, control chart, fishbone (Ishikawa) diagram, process map (flowchart), and scatter diagram (scatterplot). ![]()
Many sources use the above seven tools, but some sources, such as the ASQ and Wikipedia websites replace process map with stratification, while others, such as Schroeder (2007), replace the checksheet with the run chart. This author argues that a process map is far more important than stratification, and a checksheet is more practical than a run chart. This author argues further that a causal map is better than a fishbone diagram and that other tools, such as FMEA, error proofing, and the Nominal Group Technique, should be added to the list.
Other technical quality tools include design of experiments (DOE), multiple regression (and other multivariate statistical techniques), statistical hypothesis testing, sampling, and survey data collection. Nontechnical quality tools include project management, stakeholder analysis, brainstorming, and mindmapping. All of the above tools are described in this book.
See C&E diagram, causal map, checksheet, control chart, flowchart, histogram, Nominal Group Technique (NGT), Pareto Chart, process map, quality management, run chart, scatter diagram, Statistical Process Control (SPC), Statistical Quality Control (SQC).
seven wastes – See 8 wastes.
shadow board – A visual indicator of where tools should be stored on a wall or in a drawer; usually in the form of an outline similar to a shadow.
Shadow boards are a standard practice in the set-in-order step of 5S to organize tools and materials. Shadow boards call immediate attention to a failure to follow the discipline of “a place for everything and everything in its place,” which is fundamental to 5S and lean thinking.

In work areas where several people share a set of tools, it is a good idea to require workers to “sign out” tools by putting cards with their names on the board where the tools are normally stored. In this way, everyone knows who has the tool. This simple visual approach is a good example of the application of lean thinking.
See 5S, error proofing, lean thinking, visual control.
shadow price – See sensitivity analysis.
Shingo Prize – An annual award given to a number of organizations by the Shingo Prize Board of Governors based on how well they have implemented lean thinking; an organization headquartered at and sponsored by Utah State University that manages the Shingo Prize evaluation process, conferences, and training events.
According to the Shingo Prize website, “The Shingo Prize is regarded as the premier manufacturing award recognition program for North America. As part of the Shingo Prize mission and model, the Prize highlights the value of using lean/world-class manufacturing practices to attain world-class status.” Similar to the Malcolm Baldrige Award, the Shingo Prize has developed a model (framework) that can be used prescriptively to evaluate the performance of an organization.
The prize is named after the Japanese industrial engineer Shigeo Shingo, who distinguished himself as one of the world’s leading experts in improving manufacturing processes. According to the Shingo Prize website, Dr. Shingo “has been described as an engineering genius who helped create and write about many aspects of the revolutionary manufacturing practices which comprise the renowned Toyota Production System.”
The Shingo Prize website homepage is http://bigblue.usu.edu/shingoprize.
See lean thinking, Malcolm Baldrige National Quality Award (MBNQA).
shipping container – (1) Anything designed to carry or hold materials in transit. (2) A large metal shipping box of a standard size that is used to securely and efficiently transport goods by road, ship, or rail, without having to be repacked; also called ocean container.
In 2006, 20 million shipping containers were in use. Although containers are essential for international trade and commerce, no single system governs the international movement of containers, which makes it difficult to effectively track a container through the supply chain.
The International Organization for Standardization (ISO) regulates container sizes to ensure some consistency throughout the world. The standard external dimensions for containers are a width of 8 feet (2.44 m), height of 8.5 feet (2.59 m) or 9.5 feet (2.9 m), and length of 20, 40, or 45 feet (6.1 m, 12.2 m, or 13.7 m). For inside dimensions, deduct 4 inches (10.16 cm) from the width, 9 inches (22.9 cm) from the height, and 7 to 9 inches (17.8 cm to 22.9 cm) from the length. Common types of containers include:
General purpose (dry cargo) container – This is the most commonly used shipping container and can carry the widest variety of cargo. It is fully enclosed, weatherproof, and equipped with doors either on the end wall (for end loading) or the side wall (for side loading.) The most common lengths of general purpose containers are 20 feet and 40 feet. Containers are measured in 20-foot equivalent units (TEU), meaning that a 20-foot container is 1 TEU and a 40-foot container is 2 TEU. Other general purpose container sizes include a 10-foot length (mostly used in Europe and by the military) and the high-cube container, which is for oversized freight.
Thermal container (reefer) – This is a container with insulated walls, doors, roof, and floor, which helps limit temperature variation. The thermal container is used for perishable goods, such as meat, fruits, and vegetables. This type of container often has a heating or cooling device.
Flat rack (platform) – This is not an actual container, but rather a means for securing oversize cargo that will not fit into a regular container. The flat rack is equipped with top and bottom corner fittings that hold the cargo in place on the top deck of the vessel and is generally used for machinery, lumber, and other large objects.
Tank container – This type of container is used for bulk gases and liquids.
Dry bulk container – This is a container used to ship dry solids, such as bulk grains and dry chemicals. It is similar to the general purpose container, except that it is usually loaded from the top instead of from the side or the end. Each container has its own identification code with four letters that identify which ocean carrier owns the container (such as CSCL for China Shipping Container Lines) plus several numbers. After a container is loaded and sealed, the seal is assigned a number that is valid only for that shipment.
Container vessels vary greatly in size and capacity. A small container vessel might carry as few as 20 TEU, but most modern vessels carry 1,000 TEU or more. At the time of this writing, the largest container vessel in the world has a capacity of 8,063 TEU. Typical vessels load containers in tall slots that extend from three to six containers below deck to three to six containers above deck. The containers are locked at the corners.
See cargo, cube utilization, less than container load (LCL), less than truck load (LTL), multi-modal shipments, trailer.
shipping terms – See terms.
shop calendar – A listing of the dates available for material and capacity planning.
Materials Requirements Planning (MRP) systems need the shop calendar to backschedule from the order due date to create the order start date (Hamilton 2003). MRP systems also require the shop calendar to create capacity requirements planning reports.
See Capacity Requirements Planning (CRP), job shop scheduling, Manufacturing Execution System (MES), Manufacturing Requirements Planning (MRP).
shop floor control – The system used to schedule, release, prioritize, track, and report on operations done (or to be done) on orders moving through a factory, from order release to order completion; also known as production activity control. ![]()
Major functions of a shop floor control system include:
• Assigning priorities for each shop order at each workcenter.
• Maintaining work-in-process inventory information.
• Communicating shop-order status information.
• Providing data for capacity planning and control purposes.
• Providing shop order status data for both WIP inventory and accounting purposes.
• Measuring efficiency, utilization, and productivity of labor and machines.
• Supporting scheduling and costing systems.
See backflushing, dispatching rules, job shop scheduling, Manufacturing Execution System (MES), operation, routing.
shop packet – A set of documents that move with an order through a manufacturing process; also called a traveler.
The shop packet might include bill of material, routing, pick slip, work instructions, production and labor reporting tickets, move tickets, and other support forms.
See bill of material (BOM), Manufacturing Execution System (MES), routing.
shortage – See stockout.
shortage cost – See stockout.
shortage report – A list of items not available to meet requirements for customer orders or production orders; also called a shortage list.
See Over/Short/Damaged Report.
shrinkage – (1) In an inventory context: Inventory lost due to deterioration or shoplifting (theft from “customers”), breakage, employee theft, and counting discrepancies. (2) In a call center context: The non-revenue generating time as a percentage of the total paid time; also called staff shrinkage.
In the inventory context, shrinkage is usually discovered during a cycle count. In the call center context, shrinkage is the percentage of paid working time that is unproductive. Unproductive time includes breaks, meetings, training, benefit time (sick, vacation, etc.), and other off-phone member service activities.
See call center, carrying charge, carrying cost, cycle counting, obsolete inventory.
SIOP – See Sales & Operations Planning (S&OP).
sigma level – A metric that measures the defect rate for a process in terms of the standard normal distribution with an assumed shift in the mean of 1.5 standard deviations.
The sigma level metric is often taught in lean sigma programs as a measure of effectiveness for a process. The estimation process usually assumes that the control limit is set based on a standard normal random variable with mean 0 and standard deviation 1, but that the true process has a standard deviation of 1 and mean of 1.5 (instead of 0). The sigma level metric uses this model to estimate the number of defects per million opportunities (DPMO). The table below shows the DPMO for a range of sigma level and assumed mean shift values.
The well-known “3.4 defects per million opportunities” can be found in the top right cell of the table. For a sigma level of SL = 6 and mean shift MS = 1.5, the probability of a defect in the right tail is 0.000003398, the probability of a defect in the left tail is practically 0, and the overall probability of a defect is 0.000003398. Therefore, the total expected DPMO is 3.3977 ≈ 3.4.
DPMO by sigma level and assumed mean shift
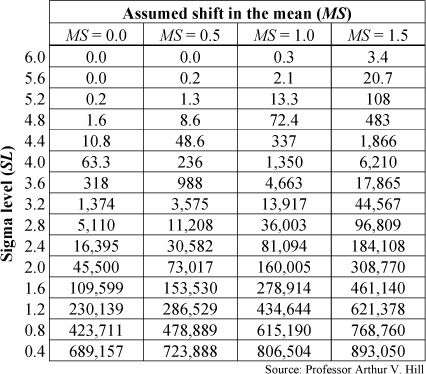
Source: Professor Arthur V. Hill
Four-sigma represents an average performance level across many industry sectors. If the entire world operated on a four-sigma standard, the world would have some serious problems:
• 20,000 lost articles of mail per hour
• Unsafe drinking water 15 minutes per day
• 5,000 surgical errors per week Two bad aircraft landings per day
• 200,000 wrong prescriptions each year
• No electricity 7 hours each month
The Excel formula for converting a “sigma level” (SL) with a mean shift (MS) into a defect rate (per million opportunities) is = (NORMDIST(- SL, MS, 1, TRUE) + 1 - NORMDIST(SL, MS, 1, TRUE))*1000000. As noted above, it is commonly assumed that the mean is shifted by MS = 1.5 sigma.
Contrary to the hyperbole found in many popular practitioner publications, six sigma may not be the optimal sigma level. The optimal sigma level may be lower or higher than six sigma and should be based on the cost of a defect relative to the cost of preventing a defect.
See defect, Defective Parts per Million (DPPM), Defects per Million Opportunities (DPMO), DMAIC, lean sigma, operations performance metrics, process capability and performance, specification limits.
simple exponential smoothing – See exponential smoothing.
simulated annealing – A heuristic search method used for combinatorial (discrete) optimization problems.
Simulated annealing is analogous to how the molecular structure of metals is disordered at high temperatures but ordered (crystalline) at low temperatures. In simulated annealing, the “temperature” starts out high, and the search for a better solution has a high probability of accepting an inferior solution. This allows the procedure to jump out of locally optimal solutions and potentially find a better solution. As the temperature is lowered, this probability decreases, and the best solution found so far becomes “frozen.”
See heuristic, operations research (OR), optimization.
simulation – A representation of reality used for experimentation purposes; some types of simulations are called
Monte Carlo simulations. ![]()
In operations management, a computer simulation is often used to study systems, such as factories or service processes. The computer simulation model allows the analyst to experiment with the model to find problems and opportunities without having to actually build or change the real system.
Simulation models can be categorized as either deterministic or stochastic. Deterministic simulations have no random components and therefore will always produce exactly the same results. Deterministic simulations, therefore, only need to be “run” once. On the other hand, stochastic simulations generate random variables and allow the user to explore the variability of the system. For example, a financial planning model might specify the mean and standard deviation of demand and the mean and standard deviation of the unit cost. The simulation model might be run for many replications to compute the net present value of a number of different strategies.
Stochastic simulations are also known as Monte Carlo simulations. Although Monte Carlo simulations can have a time dimension, most do not. For example, a Monte Carlo simulation could be used to cast two die (random integers in the range [1, 6]) several million times to get a distribution of the product of the two values.
Computer simulations can be further classified as either being discrete, continuous, or combined discrete and continuous. A discrete simulation processes distinct events, which means that the computer logic moves to a point in time (i.e., an event time), changes one or more of the system state variables, and then schedules the next event. In other words, the simulation model skips from one time point (event) to the next, and the system status changes only at these points in time. In contrast, a continuous simulation model represents the movement of continuous variables changing over time (e.g., the course of a rocket in flight).
The inverse transform method can be used to generate a random variable from any distribution with a known distribution function. More computationally efficient special-purpose generators are available for several probability distributions, such as the normal distribution. See the random number entry for more detail.
Many analysts new to simulation make several common errors in their simulation modeling efforts. Some of these errors include:
Not conducting a proper statistical analysis – Many new simulation users are tempted to let the simulation run for a few thousand observations and then compare the mean performance for the different alternatives considered in the experiment. The problem with this approach is that the means might not be statistically different due to the variability of the system.
Improper start-up conditions – Simulation models often need user-defined start-up conditions, particularly for queuing systems. Starting a system “empty and idle” will often cause serious bias in the average results.
Creating improper confidence intervals – Simulation statistics, such as the average number of customers (or units) in the system, are highly correlated over time. This is called autocorrelation or serial correlation. In other words, the number in system at time t is highly correlated with the number in system at time t + 1. As a result, many simulation analyses underestimate the variability and create confidence intervals on the mean that are far too small (narrow). The proper approach is to use batch means (the means over long time intervals) and then treat each batch mean as a single observation for computing a confidence interval. This often has significant implications for the number of observations that are needed.
Not considering all sources of variability – A research study done at the University of Michigan many years ago found that the biggest shortfall of most simulation models was the missing variables. For example, an inventory simulation might do a good job of handling the normal variability of the demand during the leadtime. However, this same simulation might ignore catastrophic events, such as fire in a supplier’s plant, which might shut down the entire firm for a month.
Not taking advantage of common random number streams – Most simulation languages, such as Arena, allow the user to run multiple simulations on the “same track” with respect to the sequence of random values. This is done by dedicating a random number seed to each random process (e.g., the demand quantity, time between arrivals, etc.). This approach allows the analyst to have far more comparable results.
Simulation modeling has come a long way in the last 20 years. Commercial simulation software, such as Arena, makes simulation modeling easy. Unfortunately, it is just as easy today as it was 20 years ago to make serious errors in modeling and analysis. As an old saying goes, “Simulation should be the method of last resort.” In other words, common sense and simple queuing models should be used before a simulation is attempted.
See confidence interval, Decision Support System (DSS), inverse transform method, operations research (OR), random number, systems thinking, Turing test, what-if analysis.
simultaneous engineering – A systematic approach to the integrated concurrent design of products and their related processes, including manufacturing and support.
Benefits of simultaneous engineering include reduced time to market, increased product quality, and lower product cost. Simultaneous engineering is closely related to Design for Manufacturing (DFM). Simultaneous engineering appears to be synonymous with concurrent engineering and Integrated Product Development (IPD).
See concurrent engineering, Integrated Product Development (IPD), New Product Development (NPD).
single exponential smoothing – See exponential smoothing.
Single Minute Exchange of Dies (SMED) – A lean manufacturing methodology for reducing setup time to less than a single digit (e.g., less than 10 minutes); also called Single Minute Exchange of Die and rapid changeover.
This term was coined by Shigeo Shingo in the 1950s and 1960s. The term is used almost synonymously with quick changeovers and setups. The changeover time is the time from the last good part for one order to the first good part of the next order. A single-digit time is not required, but is often used as a target value. The setup time reduction methods entry has more information on this subject.
See lean thinking, one-piece flow, setup cost, setup time, setup time reduction methods.
single point of contact – A service quality principle suggesting that a customer should have to talk to only one person for the delivery of a service.
The single point of contact is summarized nicely with the slogan “one customer, one call, one relationship.” This slogan emphasizes that each customer should only have to make one phone call and should only have to establish a relationship with one service provider. Unfortunately, the opposite of this occurs in many service organizations when a customer waits a long time in queue only to be told by the unfriendly service workers (or the phone system) that they will have to talk to someone else. The customer never builds a relationship with any service worker, and no service worker ever takes any “ownership” of the customer’s needs.
Advantages of the single point of contact principle include (1) the firm builds a closer relationship with the customer, (2) the customer does not have to wait in multiple queues, (3) the customer’s expectations are better managed, (4) much less information is lost in the “handoffs” between multiple service workers, (5) the job design is more satisfying for the service worker because they get to “own” the entire set of the customer’s needs, and (6) the company may benefit from a reduced cost of service delivery in a “once and done” environment.
However, the single point of contact model is not without cost. In many cases, the single point of contact increases the cost of service, because workers require more training and one worker might have a long queue while another is idle. In other words, from a queuing theory standpoint, the single point of contact dedicates each server to a particular set of customers. If not managed carefully, this can increase average waiting time and decrease overall system performance.
See handoff, job design, service quality.
single sampling plan – See acceptance sampling.
single source – The practice of using only one supplier for an item or service even though one or more other suppliers are qualified to be suppliers.
With a single source supplier, a firm still has other qualified sources of supply that it could use in case of emergency. In contrast, with a sole source supplier, the firm has one and only one source of supply that is capable of supplying the item or service. A sole source supply is in essence a monopoly situation and can be risky for the customer. However, in some situations, a sole source relationship is unavoidable. For example, a music CD is usually sold by only one “label” (the artist’s one and only distribution company). Music retailers, such as Best Buy have no choice but to have a sole source of supply if it wants to carry that artist’s music.
With a dual source (or multiple source) relationship, the buying organization has two or more suppliers qualified to supply a material or component and actually uses two or more of these suppliers. A dual source relationship is a multiple source relationship with exactly two suppliers. Dual (or multiple) sourcing makes the most sense for commodity items, such as grain, salt, metals, or chemicals. Many firms have multiple sources of supply for a group of items (a commodity group) but still use a single source for each item in that group.
See commodity, dual source, purchasing, sourcing.
single-piece flow – See one-piece flow.
SIOP – See Sales & Operations Planning (S&OP).
SIPOC Diagram – An acronym for Suppliers, Inputs, Process, Outputs, and Customers, which is a tool used to identify all relevant elements of a process for the purposes of process improvement.
All process improvement projects should consider all five of these elements. Note that this is a useful tool for all process improvement projects, not just supply chain projects.
See process map, supply chain management, systems thinking, value chain.
six sigma – See lean sigma.
skewness – A statistical measure of the asymmetry of the probability distribution of a random variable.
If a probability distribution has no skewness, it is symmetric on both sides of the mean, and the mean = median = mode. Mathematically, skewness is defined as the third standardized moment. For a sample of n observations, Wikipedia defines sample skewness as ![]() where,
where, ![]() is the sample mean. The Excel formula SKEW(range) uses
is the sample mean. The Excel formula SKEW(range) uses ![]() , the Engineering Statistics Handbook (NIST 2010) uses
, the Engineering Statistics Handbook (NIST 2010) uses ![]() , and von Hippel (2005) uses
, and von Hippel (2005) uses ![]() , where sx is the sample standard deviation. All four of these equations produce slightly different results.
, where sx is the sample standard deviation. All four of these equations produce slightly different results.
The skewness for all symmetric distributions, such as the normal is 0.
According to von Hippel (2005), many textbooks provide a simple rule stating that a distribution will be right skewed if the mean is right of the median and left skewed if the mean is left of the median. However, he shows that this rule frequently fails.
See geometric mean, interpolated median, kurtosis, mean, median, mode, standard deviation, trimmed mean.
skid – See pallet.
skill based pay – See pay for skill.
SKU – See Stock Keeping Unit (SKU).
slack time – The amount of time an activity (task) can be delayed from its early start time without delaying the project (or job) finish date; also called float. ![]()
In the project scheduling context, slack time is called float time and is defined as the time that a task can be delayed without delaying the overall project completion time. A task with zero float is on the critical path and a task that has positive float is not on the critical path. In a job shop scheduling context, the slack time is the due date less the sum of the remaining processing time. The minimum slack time rule is a good dispatching rule for both project management and job shops.
For example, a student has a report due in 14 days but believes that it will take only three days to write the report and one day to get copies printed. Therefore, the student has a slack time of 14 − 3 − 1 = 10 days.
See critical chain, critical path, Critical Path Method (CPM), dispatching rules, job shop scheduling, Project Evaluation and Review Technique (PERT), project management, project network, safety leadtime.
slotting – (1) In a warehouse context: Finding a location for an item in a warehouse, distribution center, or retail store; also called put away, inventory slotting, profiling, or warehouse optimization. (2) In a retail context: Finding a location for an item on a store shelf.
In the warehouse context, slotting attempts to find the most efficient location for each item. Factors to consider in making a slotting decision include picking velocity (picks/month), cube usage (cubic velocity), pick face dimensions, package dimensions and weight, picked package size, storage package size, material handling equipment used, layout of the facility, and labor rates. Benefits of good product slotting include:
• Picking productivity – Travel time can often account for up to 60% of a picker’s daily activity. A good product slotting and pick path strategy can reduce travel time and reduce picking labor time and cost.
• Efficient replenishment – Sizing the pick face locations based upon a standard unit of measure (case, pallet) can reduce the labor time and cost required to replenish the location.
• Work balancing – Balancing activity across multiple pick zones can reduce congestion in the zones, improve material flow, and reduce the total response time.
• Load building – To minimize product damage, heavy products are located at the beginning of the pick path ahead of crushable products. Items can also be located based on case size to facilitate pallet building.
• Accuracy – Similar products are separated to minimize the opportunity for picking errors.
• Ergonomics – High velocity products are placed in a “golden zone” to reduce bending and reaching activity. Heavy or oversize items are placed on lower levels in the pick zone or placed in a separate zone where material handling equipment can be utilized.
• Pre-consolidation – By storing and picking products by family group, it is often possible to reduce downstream sorting and consolidation activity. This is particularly important in a retail environment to facilitate efficient restocking at the stores.
Warehouse operations managers often do a good job of slotting their warehouse initially, but fail to maintain order over time as customer demand changes and products are added and deleted. Therefore, it is important to re-slot the warehouse to maintain efficiency. Some organizations re-slot fast moving items on a daily or weekly basis. Most Warehouse Management Systems (WMS) have slotting functionality.
In a retail context, a slotting fee (or slotting allowance) is paid by a manufacturer or distributor to a retailer to make room for a product on its store shelves. In the U.S., slotting fees can be very significant.
See cube utilization, forward pick area, locator system, picking, reserve storage area, slotting fee, task interleaving, trade promotion allowance, warehouse, Warehouse Management System (WMS).
slotting fee – Money paid by a manufacturer to a retailer to have a product placed on the retailer’s shelves; also called slotting allowance, pay-to-stay, and fixed trade spending.
The slotting fee is charged to make room for a product on store shelves, make room for a product in a warehouse, and enter the product data (including the barcode) into the inventory system. According to Wikipedia, in the U.S., initial slotting fees are approximately $25,000 per item, but may be as high as $250,000.
See slotting, Warehouse Management System (WMS).
slow moving inventory – A product with a low average demand, where low is usually defined to be less than five to nine units per period.
Many products have a low average demand. In fact, for many firms, most products are slow moving, with a demand less than nine units per period. Some slow moving items are high-price (or high-cost) items, such as medical devices, service parts, and capital goods (e.g., jet engines), and often have a high shortage (or stockout) cost. (A distinction between shortage and stockout cost is described in other places in this book.) Clearly, these items need to be carefully managed to find the right balance between having too much and too little inventory. Many other slow moving items are low-price (or low-cost) items and make up a small part of the firm’s total revenue (or investment). Most inventory management texts appropriately urge managers to focus on the “important few” and not worry too much about the “trivial many.” However, managers still need inventory systems to manage the “trivial many,” or they will be overwhelmed by transactions, stockouts, inventory carrying cost, and errors. These items still require significant investment and still have a major impact on customer service. See the obsolete inventory entry for a discussion of how to handle inventory that is not moving.
It is often possible to make significant improvements in both service levels and inventory levels for slow moving items by applying the following principles:
• Use a perpetual inventory system with a one-for-one replenishment policy – This approach can achieve high service levels with little inventory. This is particularly helpful when inventory is in short supply and must be “allocated” to the multiple stocking locations.
• Set the target inventory level that finds the optimal balance between the carrying and shortage costs – If the target is set too low, the system will have too many angry customers and too much shortage cost. If the target is set too high, the system will have too much inventory and too much carrying cost. Given that the order quantity is fixed at one, the target inventory is the only decision parameter for this model.
• Use a consistent policy across all stocking points and all items – This will serve customers equitably and manage the balance between customer service and inventory investment.
• Keep safety stock in the finished goods inventory or central warehouse so the company can “pool” the risk – The safety stock should be “pooled” in a central location as much as possible so it is available when and where needed.
See all-time demand, newsvendor model, obsolete inventory, periodic review system, Poisson distribution, pooling, service level, service parts, stockout.
SMART goals – An easy-to-remember acronym for a simple goal-setting method; also called SMARTS, SMARTER, and SMARTIE.
The SMART acronym is a popular and useful goal-setting tool for both organizations and individuals. Although many websites attribute this acronym to Drucker (1954), according to the website www.rapidbi.com/created/WriteSMARTobjectives.html (May 26, 2008), “there is no direct reference to SMART by Drucker ... While it is clear that Drucker was the first to write about management by objectives, the SMART acronym is harder to trace.”
Many variants of this popular acronym can be found on the Internet. In fact, only the first two letters seem to be universally accepted. The following list includes what appears to be the most popular variant for SMART goals and is this author’s recommended list:
(S) Specific – Goals should be stated in plain, simple, unambiguous, specific language and written down so they are easy to remember, easy to communicate to others, and easy to know when the goal has been accomplished. A goal of losing weight is not specific; a goal of losing 20 pounds by Christmas is specific.
(M) Measurable – Goals should be quantifiable so it is possible to measure progress toward them. The slogan “You cannot manage what you cannot measure” has been popular for many decades. For example, progress toward a weight loss goal is measurable, while progress toward being healthier is not.
(A) Achievable – Goals should be realistic and also under control of the person who defines them. According to goal theory, a goal set too high will be discouraging, and a goal set too low is not motivating. Collins and Porras (1996) suggest that organizations need a “Big Hairy Audacious Goal,” or “BHAG,” to serve as a clear and compelling vision and catalyst for improvement. It is also imperative that goals be under the control of the organization or individual who defines them. If a goal is outside a person’s control, it is just a wish or a dream. For example, a manager may want to increase a firm’s profit by 10%, but profit is affected by many actions outside the firm’s control (e.g., competitor’s pricing).
(R) Results oriented – Goals should be a statement of an outcome and should not be a task or activity. In the words of David Allen (2001), this is the “desired outcome.”
(T) Time specific – Goals should have a realistic time limit for accomplishing the outcome. Someone once defined a goal as “a wish with a time limit.” It is not enough to set a goal of losing 20 pounds; it is also important to set a time frame (e.g., lose 20 pounds by Christmas).
Steve Flagg, President of Quality Bicycle Products in Bloomington, Minnesota, wisely asserts that every goal should have a corresponding “purpose statement that precedes it – and that the purpose is just as important as the goal.” For example, this author has a goal of exercising three times per week. This goal aligns with my purposes of being healthy, honoring God in my body, loving my wife, and modeling healthy living for my four boys.
See mission statement, one-minute manager, personal operations management.
SME – See Society of Manufacturing Engineers (SME).
SME (Subject Matter Expert) – See Subject Matter Expert (SME).
SMED – See Single Minute Exchange of Dies.
smoothing – See exponential smoothing.
sniping – The practice of waiting until the last minute to place a bid in an auction.
Sniping is a common practice in on-line auctions, such as eBay, and is often an effective strategy for helping bidders avoid price wars and get what they want at a lower final price (Roth and Ockenfels 2002). Some on-line auctions allow the deadlines to be extended to foil the sniping strategy. For example, Amazon auctions have a scheduled end time, but the auction is extended if bids are received near the scheduled end. The rule at Amazon is that the auction cannot end until at least ten minutes have passed without a bid.
See Dutch auction, e-auction, e-business, reverse auction.
Society of Manufacturing Engineers (SME) – A professional society dedicated to bringing people and information together to advance manufacturing knowledge.
For more than 75 years, SME has served manufacturing practitioners, companies, and other organizations as their source for information, education, and networking. SME supports manufacturers from all industries and job functions through events and technical and professional development resources.
SME produces several publications, including the practitioner-oriented Manufacturing Engineering Magazine and two scholarly journals, the Journal of Manufacturing Systems (JMS) and the Journal of Manufacturing Processes (JMP). The JMS focuses on applying new manufacturing knowledge to design and integration problems, speeding up systems development, improving operations and containing product and processing costs. The JMP presents the essential aspects of fundamental and emerging manufacturing processes, such as material removal, deformation, injection molding, precision engineering, surface treatment, and rapid prototyping. SME’s website is www.sme.org.
See operations management (OM).
socio-technical design – See job design.
Software as a Service (SaaS) – A software application available on the Internet; also called software on demand and on-demand software; closely related to cloud computing.
With SaaS, customers do not own the software itself but rather pay for the right to use it. Some SaaS applications are free to the user, with revenue derived from alternate sources, such as advertising or upgrade fees. Examples of free SaaS applications include Gmail and Google Docs. Some of the benefits of SaaS over the traditional software license model include:
• Lower cost – Saves money by not having to purchase servers or other software to support use. In addition, cash flow for SaaS is better, because it has a monthly fee rather than an up-front cost.
• Faster implementation – Customers can deploy SaaS services much faster, because they do not have to install the software on their computers.
• Greater focus – Allows customers to focus on their businesses rather than the software implementation.
• Flexibility and scalability – Reduced need to predict scale of demand and infrastructure investment up front, because available capacity can always be matched to demand.
• Reliability – The SaaS provider often can afford to invest significant resources to ensure the software platform is stable and reliable.
This list of benefits was adapted from http://en.wikipedia.org/wiki/Software_as_a_service (October 1, 2010).
See Application Service Provider (ASP), cloud computing, implementation, service management.
sole source – See single source, sourcing.
SOP – Standard operating procedures. See standardized work.
sourcing – Identifying, qualifying, and negotiating agreements with suppliers of goods and services; also known as purchasing; sometimes called strategic sourcing. ![]()
Sourcing is the process that purchasing organizations use to find, evaluate, and select suppliers for direct and indirect materials. The term can also be used for the process of acquiring technology, labor, intellectual property, and capital. In-sourcing is the practice of vertical integration so the organization provides its own source of supply. Outsourcing is the practice of having another legal entity serve as the source of supply. Although outsourcing is often on another continent, it can be on the same continent. In other words, outsourcing and offshoring are not synonyms. Global sourcing is the practice of searching the entire world for the best source of supply. Regional sourcing (also called nearshoring) is the practice of finding local suppliers to assure low replenishment leadtimes and low freight costs. Regional sourcing often also has political benefits, because some countries have local content laws that require a percentage of the product cost to come from local suppliers.
The decision to sole source, single source, or multiple source a commodity (a category of items) is an important strategic decision. The spend analysis entry discusses these issues in more detail.
See business process outsourcing, commodity, intellectual property (IP), nearshoring, outsourcing, purchasing, single source, spend analysis, supply chain management.
spaghetti chart – A diagram that shows the travel paths for one or more products (or people) that travel through a facility.
The numerous colored lines make it look like a plate of spaghetti. This tool helps identify opportunities for reducing the travel and move times in a process.
See facility layout.
spare parts – See service parts.
Spearman’s Rank Correlation – See correlation.
SPC – See Statistical Process Control (SPC).
special cause variation – Deviations from common values in a process that have an identifiable source and can eventually be eliminated; also known as assignable cause.
Causes of variation that are not inherent in the process itself but originate from out of the ordinary circumstances. Special causes are often indicated by points that fall outside the limits of a control chart.
See common cause variation, control chart, outlier, quality management, Statistical Process Control (SPC), Statistical Quality Control (SQC), tampering.
specification – See specification limits.
specification limits – The required features and performance characteristics of a product, as defined at different levels of detail.
Specifications are defined in terms of an upper, a lower specification limit, or both. Specification limits may be two-sided, with upper and lower limits, or one-sided, with either an upper or a lower limit. Unlike control limits, specification limits are not dependent on the process in any way. Specification limits are the boundary points that define the acceptable values for an output variable of a particular product characteristic. Specification limits are determined by customers, product designers, and management.
See control chart, process capability and performance, sigma level, Statistical Process Control (SPC), Statistical Quality Control (SQC).
speed to market – See time to market.
spend analysis – A careful examination and evaluation of where a purchasing organization is currently spending its purchasing dollars with the purpose of finding opportunities to reduce cost or improve value.
Spend analysis answers questions such as:
• How much are we spending in total?
• How much are we spending in each category?
• Who are our suppliers?
• How much is our spend with each supplier?
• How much is our spend in each category with each supplier?
• What parts, materials, and other tools are we getting from each supplier?
• How can we “leverage” our spend to reduce our direct and indirect materials cost?
• How can we reduce our usage?
• Where are we at risk with our spend?
Spend analysis is often motivated by the fact that a $1 reduction in spend is roughly equivalent to a $3 to $5 increase in sales (in some cases). In other words, the contribution to profit of a $1 reduction in purchase cost is about the same as the contribution to profit of increasing sales by $3 to $5. Spend analysis typically achieves savings by identifying opportunities to leverage the spend. This means that the organization requires that all business units use the same suppliers, which enables the organization to negotiate a lower price. Other spend analysis tools include reducing demand (e.g., make it harder for workers to make photocopies), substituting cheaper products (e.g., requiring reused toner cartridges), and segmenting suppliers so more important commodities are managed more carefully.
Kraljic (1983) developed a purchasing portfolio model (shown below) that can be used to segment items and suppliers, prioritize and mitigate risks, and leverage buying power. Each of the four categories requires a different sourcing strategy. Non-critical items require efficient processing, product standardization, and inventory optimization. Leverage items allow the buyer to exploit its purchasing power. Bottleneck items have high risk but low profit impact and therefore require risk mitigation strategies. Strategic items require careful and constant attention and often require strategic partnerships.
Geldermana and Van Weeleb (2003) question the dimensions used in the Kraljic model and note that it is difficult to measure these dimensions. They also suggest that the model should allow for movement between quadrants. Other dimensions that might be used to segment suppliers or items include total spend, number of buyers in the market, number of suppliers in the market, buyer/supplier power, and generic items (commodity) versus customized (engineered) items. The sourcing entry addresses similar issues.
Kraljic’s purchasing portfolio model
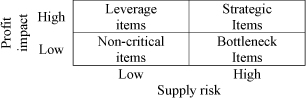
Adapted from Karljic (1983)
See leverage the spend, Maintenance-Repair-Operations (MRO), purchasing, sourcing, supplier, supply chain management.
sponsor – A project management term for an individual (individuals) who is (are) the main customer and primary supporter for a project.
The project sponsor is the main customer for the project. The project is initiated by the sponsor and is not complete until the sponsor has signed off on it. However, the sponsor is also responsible for holding the project team accountable for staying on schedule, in budget, in scope, and focused on meeting the requirements as defined in the project charter. Lastly, the project sponsor is responsible for ensuring that the project team has the resources (people, money, equipment, space, etc.) and the organizational authority that it needs to succeed.
See champion, cross-functional team, deliverables, DMAIC, post-project review, project charter, project management, project management triangle, steering committee.
sprint burndown chart – An agile or scrum software development project management tool that provides a graphical representation of the work remaining in any given sprint.
A sprint burndown chart shows the number of days in the sprint on the x-axis and features (or hours) remaining on the y-axis. The sprint burndown chart is reviewed daily in the scrum meeting to help the team review its progress and to give early warning if corrective actions are needed. The chart is updated daily by the scrum master and is visible to team members at all times.
See agile software development, prototype, scrum, waterfall scheduling.
SQC – See statistical quality control.
square root law for safety stock – When the replenishment leadtime increases by a factor of f, the safety stock will increase approximately by the factor ![]() .
.
This relationship is based on the safety stock equation and is often helpful when considering offshoring production. This model can be used to estimate the increase in safety stock due to an increase in the leadtime.
See inventory management, safety stock.
square root law for warehouses – A simple mathematical model stating that the total inventory in a system is proportional to the square root of the number of stocking locations.
The practical application of this “law” is that the inventory in stocking locations (such as warehouses) will increase (or decrease) with the square root of the number of stocking locations that serve the market. For example, doubling the number of stocking locations will increase inventory by a factor of the square root of two (i.e., ~ 1.414 or about 41% increase). This law warns managers against the naïve assumption that adding stocking locations will require no additional inventory.
Mathematically, the law can be stated as ![]() , where I is the total inventory, n is the number of stocking locations (typically warehouses), and a is a constant. A more useful version of this model is
, where I is the total inventory, n is the number of stocking locations (typically warehouses), and a is a constant. A more useful version of this model is ![]() , where Iold and Inew are the old and new inventory levels and nold and nnew are the old and new number of stocking locations.
, where Iold and Inew are the old and new inventory levels and nold and nnew are the old and new number of stocking locations.
As mentioned above, this law states that if a firm doubles the number of warehouses, it should expect to increase inventory by a factor of ![]() . In other words, doubling the number of stocking locations should increase inventory by about 41%. Similarly, if the firm cuts the number of stocking locations in half, it should expect to see inventory go down by a factor of
. In other words, doubling the number of stocking locations should increase inventory by about 41%. Similarly, if the firm cuts the number of stocking locations in half, it should expect to see inventory go down by a factor of ![]() . In other words, cutting the number of stocking locations in half should reduce inventory by about 30%. The table below shows the multiplicative percentage increase or decrease in inventory as the number of stocking points changes.
. In other words, cutting the number of stocking locations in half should reduce inventory by about 30%. The table below shows the multiplicative percentage increase or decrease in inventory as the number of stocking points changes.
Multiplicative change in inventory investment with a change in the number of stocking points

The square root law can be found in the literature as far back as Starr and Miller (1962) and was proven mathematically by Maister (1976) based on a reasonable set of assumptions. Evers (1995) found that the square root law can be applied to both safety stock and cycle stock and therefore can be applied to total inventory. Coyle, Bardi, and Langley (2002) provide empirical support for this model. Zinn, Levi, and Bowersox (1989) found that (1) the square root law is most accurate when market demands are negatively correlated, (2) accuracy increases with the demand uncertainty at each location as measured by the coefficient of variation, and (3) little or no benefit from consolidating stock when demands at stocking points are positively correlated.
See consolidation, inventory management, supply chain management, warehouse.
stabilizing the schedule – See heijunka.
stage-gate process – A project management and control practice commonly used for New Product Development (NPD) that uses formal reviews at predetermined steps in the project to decide if the project will be allowed to proceed; also called phase review, toll gate, tollgate, or gated process.
Cooper (1993, 2001) developed the stage-gate process to help firms improve their NPD processes. Many have argued that compared to a traditional process, the stage-gate process brings products to market in less time, with higher quality, greater discipline, and better overall performance (Cooper 1993).
A gate is a decision point (milestone or step) where the project status is reviewed and a decision is made to go forward, redirect, hold, or terminate the project. A formal stage-gate process will have a standardized set of deliverables for each gate. This standardization allows the management team to compare the relative value of NPD projects in the new product portfolio and to make trade-off decisions. A gate scorecard can be used to evaluate the deliverables against the standard. For example, demonstrating robust design may be a requirement in an early stage. The scorecard status may be yellow (caution) if the Cpk of a critical quality parameter is only 1.
Cooper (2001) outlines the following typical stage-gate phases:
1. Discovery: Pre-work designed to discover opportunities and generate ideas. (Gate = Idea screen)
2. Scoping: A quick, preliminary investigation of the project. (Gate = Second screen)
3. Building the business case: A detailed investigation involving primary research, both technical and marketing, leading to a business case. This business case includes the product definition, project justification, and a project plan.
4. Development: The detailed design and development of the product and the production process to make it.
5. Testing and validation: Trials in the marketplace, lab, and plant to verify and validate the proposed new product and its marketing and production.
6. Launch: Commercialization (beginning of full production, marketing, and selling).
The stages from the Advanced Product Quality Planning (APQP) process of the Automotive Industry Action Group (AIAG) are Concept approval, Program approval, Prototype, Pilot, and Launch.
A typical stage-gate process is as follows:
1. Market analysis: Various product concepts that address a market need are identified.
2. Commitment: The technical feasibility of a particular product concept is determined and design requirements are defined.
3. Development: All activities necessary to design, document, build, and qualify the product and its associated manufacturing processes are included.
Stage-gate processes for new product development
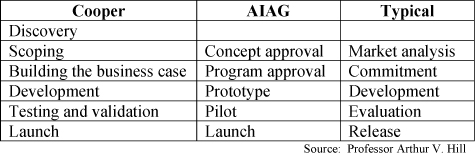
4. Evaluation: Final design validation of the product is conducted during this phase. Clinical and field studies are conducted, and regulatory approval to market and distribute the product is also obtained.
5. Release: The product is commercially distributed in markets where regulatory approval has been obtained. The table above summarizes these three frameworks.
Many lean sigma programs use a similar “gated” process at the end of each of the steps in the DMAIC framework to provide accountability and keep the project on track. However, some experts argue that stagegates create too much overhead and slow a project down and therefore should only be used for large projects. Some project management experts argue that stage-gates should be based on the nature of the specific project rather than on the DMAIC framework.
See deliverables, Design for Six Sigma (DFSS), DMAIC, lean sigma, milestone, New Product Development (NPD), phase review, project charter, project management, waterfall scheduling.
staging – The manufacturing practice of gathering materials and tools in preparation for the initiation of a production or assembly process.
In the manufacturing order context, staging involves picking materials for a production or sales order and gathering them together to identify shortages. This is sometimes called kitting. Staged material is normally handled as a location transfer and not as an issue to the production or sales order. In the machine setup context, staging involves gathering tools and materials while the machine is still running.
See kitting, setup time reduction methods.
stakeholder – People, groups of people, and organizations involved in or affected by a decision, change, or activity.
The following is a long list of potential stakeholders for a process improvement project:
• Shareholders
• Senior executives
• Managers
• Administrators
• Process owner(s)
• Doctors/nurses/LPNs
• Project team members
• Operators
• Coworkers
• Previous manager
• Customers/consumers
• Students
• Patients/clients
• Prospective customers
• Network members
• Payers
• Insurers
• Partners
• Suppliers
• Distributors/Sales force
• Other departments
• Support organizations
• Technology providers
• Trade associations
• Unions
• Professional societies
• The press
• Lenders
• Analysts
• Neighbors
• Community
• Future recruits
• Regulators
• Government
• Spouse/children/family
• God55
See agile software development, Business Continuity Management (BCM), product life cycle management, project charter, project management, RACI Matrix, stakeholder analysis.
stakeholder analysis – A technique for identifying, evaluating, and mitigating political risks that might affect the outcomes of an initiative, such as a process improvement project.
The goal of stakeholder analysis is to win the most effective support possible for the initiative and to minimize potential obstacles to successful implementation. Stakeholder analysis is particularly important in major quality management, process improvement, and Business Process Re-engineering (BPR) programs.
The three steps in stakeholder analysis are:
• Identify the stakeholders – Identify people, groups, and institutions that might influence the activity (either positively or negatively). The RACI Matrix is a good tool for helping with this process. See RACI Matrix.
• Evaluate “what is in it for me” – Anticipate the kind of influence these groups will have on your initiative.
• Develop communication and involvement strategies – Decide how each stakeholder group should be involved in the initiative and how the team will communicate with them.
The following example illustrates a formal stakeholder analysis using a new quality control information system as an example. This table can be easily implemented in Excel or Word. The process starts by defining each stakeholder’s goals and identifying how the project might help or hinder those goals (the positives and negatives). The involvement strategy seeks to define the right level of involvement for each key stakeholder group and get them involved early in the project. The communication strategy should define the frequency of communication, mode of communication, and audience for each stakeholder group.
Stakeholder analysis example
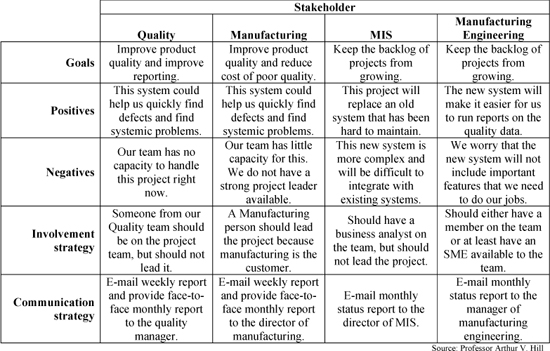
The following is a general list of potential benefits for employees: remove frustration, remove bottlenecks, reduce bureaucracy, make things simpler, improve morale, improve teamwork, improve communication, accelerate learning, help them serve customers better, and free up time for more important work.
Some experts suggest “co-opting” a potential opponent by inviting them to join the project team as a member or Subject Matter Expert (SME). The idea is to get your potential opponents on your side early in the process and use their energy to move the project forward rather than get in the way. See the co-opt entry.
See Business Process Re-engineering (BPR), change management, co-opt, force field analysis, implementation, lean sigma, lean thinking, project charter, project management, quality management, RACI Matrix, stakeholder, Total Quality Management (TQM).
stamping – (1) A manufacturing process that forms materials. (2) A part made by a stamping process.
Stamping is usually done on sheet-metal, but can also be done on other materials. Stamping is usually done with a press that applies pressure to form the metal with a mold or die. For safety purposes, presses often have controls that require the operator to have both hands out of the press. This is a good example of error proofing.
See die cutting, error proofing, manufacturing processes.
standard cost – A system of estimating product costs based on direct labor, direct materials, and allocated overhead. ![]()
The standard costing system in most manufacturing firms defines the standard cost as (standard time for direct labor) × (standard labor rate) + direct materials + overhead. Overhead is typically allocated based on the direct labor cost. More sophisticated firms allocate overhead using Activity Based Costing (ABC) methods.
When firms allocate overhead to products based on direct labor as the only cost driver, they are often allocating the largest component of cost (i.e., overhead) based on the smallest component (i.e., direct labor). Because of product variety and complexity, a constant burden rate (overhead rate) based on direct labor is no longer appropriate for many firms. This approach has several problems, including:
• Too much focus on direct labor – Because overhead is allocated on the basis of direct labor, many managers assume that they can reduce overhead by reducing direct labor, which is clearly misguided.
• Poorly informed outsourcing decisions – When managers assume that the overhead will go away when direct labor goes away, they sometimes make poorly informed outsourcing decisions and only later discover that the overhead does not disappear.
• Death spiral overhead costs – When decisions are made to outsource a product and the overhead does not go away, overhead then has to be reallocated to other products, and the firm enters into a “death spiral” with the same overhead being allocated to fewer and fewer products. (See the make versus buy decision entry).
• Poor understanding of product costs – Allocation of overhead on direct labor hides the true product costs, especially when direct labor is a small portion of the total cost.
See absorption costing, Activity Based Costing (ABC), burden rate, make versus buy decision, overhead, setup cost, standard time, variable costing.
standard deviation – A measure of the dispersion (variability) of a random variable; the square root of the variance. ![]()
The variance entry has much more information on this subject.
See coefficient of variation, confidence interval, forecast error metrics, Mean Absolute Deviation (MAD), mean squared error (MSE), range, sample size calculation, sampling, skewness, variance.
standard hours – See standard time.
Standard Operating Procedure (SOP) – See standardized work.
standard parts – Components that an organization has decided will be used whenever possible.
Most firms define a set of standard parts to be purchased in commodity categories, such as fasteners (bolts, nuts, clips, etc.), which leads to purchasing economies and also simplifies design and manufacturing. This concept can also be applied to commonly used parts that are designed and manufactured by the firm. The concept can be broadened to include standard containers, standard labels, standard procedures, etc.
See commodity, commonality, interchangeable parts, pull system, standard products, VAT analysis.
standard products – A good made repetitively to a fixed product specification.
Many manufacturing firms make standard products and store them in inventory. This make to stock strategy makes sense for many consumer goods products that have fairly predictable demand. In contrast, customized products must be built (made, assembled, or configured) to a customer’s specifications.
Note, however, that it is possible to make standard products to customer order when the manufacturing cycle time is shorter than the customer leadtime. This customer interface strategy is particularly helpful for lowdemand, high-cost standard products.
See assembly line, commonality, focused factory, interchangeable parts, make to order (MTO), make to stock (MTS), postponement, product proliferation, respond to order (RTO), standard parts.
standard time – The planned processing time per part; also called standard hours. ![]()
Standard times are used for planning machine and labor load and machine and labor capacity and also for assigning direct labor costs to products as they pass through a process. Standard times are also frequently used as a basis for incentive pay systems and as a basis for allocating manufacturing overhead.
Standard time is calculated as the normal time adjusted for allowances for personal needs, fatigue, and unavoidable delays. See the normal time entry for more detail. The allowance should depend on work environment issues, such as temperature, dust, dirt, fumes, noise, and vibration, and can be as high as 15%. Standard times can be set for both setup time and for run time.
Some firms update standard times and costs on an annual basis. Creating standard times is one of the traditional roles for the industrial engineering function.
See efficiency, industrial engineering, load, normal time, operations performance metrics, performance rating, standard cost, time study, work measurement, work sampling.
standard work – See standardized work.
standardization – See standardized work.
standardized loss function – See safety stock.
standardized work – The discipline of creating and following a single set of formal, written work instructions for each process; also called standard work. ![]()
Frederick Taylor (1911), the father of scientific management, emphasized standardized work and the “one best way” for a job design. Traditionally, organizations in North America have called these work instructions “Standard Operating Procedures” or SOPs. More recently, the Lean Enterprise Institute and other leaders of the lean manufacturing movement have called these Standardized Work Instructions (SWIs). Standardized work is a key element of the Toyota Production System (TPS).
Standardized work is particularly important when a process is performed by different people, in different workcenters, in different locations, or on different shifts. Although it is normally applied to repetitive factory and service work, it can also be applied to less repetitive knowledge work done by professionals and salaried workers. For example, supervisors and managers should also have some standardized work. Doctors should have an SOP for a surgical procedure. Exam rooms should have a standard design so each room has the same layout, equipment, and supplies, which makes it easy for doctors to share several exam rooms.
In lean manufacturing, the term “standard work” emphasizes having standards for the most effective combination of labor, materials, equipment, and methods. For repetitive operations, standard work defines the takt time, work sequence, and standard work in process. Lean firms often use simple text and photos so procedures are clear for workers from a variety of educational, cultural, and language backgrounds. They are located next to the process so operators can see them often and so they are readily available for training purposes.
In some firms, language can be an issue due to a multilingual workforce. In these situations, it is important to provide SOPs in multiple languages. Again, photos and diagrams can be very helpful.
Some firms have implemented SOPs on computer systems. These systems allow for multiple languages and can also provide photos, videos, animations, and games for training. They can also administer tests for internal training and certification programs.

According to the Lean Lexicon (Marchwinski & Shook 2006), standardized work is based on three elements:
1. Takt time, which is the rate at which products must be made in a process to meet customer demand.
2. The precise work sequence in which an operator performs tasks within takt time.
3. The standard inventory, including units in machines, required to keep the process operating smoothly.
See 5S, Business Process Re-engineering (BPR), division of labor, human resources, ISO 9001:2008, job design, job enlargement, lean thinking, process improvement program, process map, scientific management, Total Productive Maintenance (TPM), work simplification.
starving – Forcing a process to stop because of lack of input materials. ![]()
Starving a bottleneck process is bad, because it will reduce the output of the entire system. Starving a nonbottleneck process generally has few consequences for the overall output of the system. Starving a nonbottleneck process might signal that the worker should be moved to somewhere else in the process. Given that the bottleneck resource defines the capacity for the entire plant, starving a bottleneck resource results in the loss of capacity for the entire plant. Starving a bottleneck resource might signal the need to improve the planning system or increase buffers to avoid the situation going forward. Starving and blocking are often discussed in the same context and are important concepts in the Theory of Constraints (TOC) literature.
See blocking, kanban, Theory of Constraints (TOC).
statement of work (SoW) – See project charter.
station time – The “touch time” at each workstation.
See cycle time.
Statistical Process Control (SPC) – A set of statistical tools that can be used to monitor the performance of a process. ![]()
SPC is usually implemented using graphical methods called control charts to check if the process performance is within the upper and lower control limits. Ideally, a control chart will signal a problem with all special (unusual) causes of variation and ignore normal variation.
People sometimes confuse control limits with product specification limits. Control limits are a function of the natural variability of the process. The control limits are based on the process standard deviation (sigma) and are often set at plus and minus three sigma. Unlike control limits, specification limits are not dependent on the process in any way. Specification limits are the boundary points that define the acceptable values for an output variable of a particular product characteristic. Specification limits are determined by customers, product designers, and management. Specification limits may be two-sided, with upper and lower limits, or one-sided, with either an upper or a lower limit.
Inspection can be performed by variables or by attributes. Inspection by variables is usually done for process control and is performed with an x-bar chart (to control the mean) or an r-chart (to control the range or variance). Inspection by attributes is usually done for lot control (acceptance sampling) and is performed with a p-chart (to control the percent defective) or a c-chart (to control the number of defects).
See Acceptable Quality Level (AQL), acceptance sampling, attribute, c-chart, common cause variation, control chart, cumulative sum control chart, Deming’s 14 points, incoming inspection, inspection, lean sigma, np-chart, operating characteristic curve, p-chart, process capability and performance, process validation, quality assurance, quality management, r-chart, seven tools of quality, special cause variation, specification limits, Statistical Quality Control (SQC), tampering, Total Quality Management (TQM), u-chart, x-bar chart, zero defects.
Statistical Quality Control (SQC) – A set of statistical tools for measuring, controlling, and improving quality.
See Acceptable Quality Level (AQL), acceptance sampling, attribute, c-chart, common cause variation, control chart, cumulative sum control chart, Deming’s 14 points, hypergeometric distribution, incoming inspection, inspection, lean sigma, operating characteristic curve, p-chart, process capability and performance, process validation, quality assurance, quality management, r-chart, seven tools of quality, special cause variation, specification limits, Statistical Process Control (SPC), tampering, Total Quality Management (TQM), x-bar chart, zero defects.
steering committee – A project management term for a group of high-level stakeholders who are responsible for providing overall guidance and strategic direction for a project or program.
See project management, sponsor.
stickiness – The ability of a website to hold the attention of the visitor.
Stickiness is generally accomplished through intriguing, useful, and/entertaining content.
stock – A synonym for inventory.
See part number.
Stock Keeping Unit (SKU) – See part number.
stock position – See inventory position.
stockout – A situation in which a customer demand cannot be immediately satisfied from current inventory; often used synonymously with a shortage. ![]()
Stockouts can often be attributed to either incorrect safety stock parameters (e.g., bad numbers in the computer) or poor ordering disciplines (planners not following the numbers in the computer).
The cost of a stockout may be nothing if customers are willing to wait or have to wait because they have no other alternatives. However, in many situations, the stockout cost includes the lost margin. In some severe situations, the stockout cost includes the net present value of the lifetime value of the customer or even the total lifetime value of that customer and many others who are influenced by that customer’s word of mouth.
Many (if not most) sources use the terms shortage and stockout interchangeably and only make a distinction between stockouts with backorders (the customer is willing to wait) and stockouts with lost sales (the customer is not willing to wait). However, the term “stockout” is sometimes used to imply that the sale is lost, whereas the term “shortage” implies that the customer is inconvenienced, but the sale is not lost. If the customer is willing to wait, the demand is said to be “backordered,” and we have a shortage, but not a stockout.
Statistical models can be used to infer (impute) the implied shortage cost (or implied stockout cost) for a given reorder point, safety stock, or target inventory value. The reorder point (R) that minimizes the sum of the expected carrying and expected shortage cost is the solution to the newsvendor problem for one order cycle, which is R = F-1(cunder/(cunder + cover)), where F–1(.) is the inverse CDF for the demand during leadtime distribution, cunder is the underage cost (the cost of setting R one unit too low), and cover is the overage cost (the cost of setting R one unit too high). The underage cost is the shortage cost per unit short, and the overage cost is the cost of carrying one unit for one order cycle (i.e., cover = icQ/D), where i is the carrying charge, c is the unit cost, Q is the average order quantity, and D is the expected annual demand. Note that the optimal safety stock is the optimal reorder point less the average demand during leadtime. We can rewrite this equation to determine the shortage cost implied by a given reorder point. In other words, if R is given, the implied shortage cost is cs = F(R) icQ/D/(1 − F(R)), where F(R) is the CDF for the demand during leadtime evaluated at R.
See backlog, backorder, goodwill, newsvendor model, opportunity cost, order cycle, safety stock, service level, slow moving inventory.
stockout cost – See stockout.
story board – Large, visual communication of important information and key points.
Consultants often talk about their “story board” for a PowerPoint presentation. This is a high-level overview of the main points that they want to make in their presentation. Story boards are often taped to the wall in a conference room to help the consulting team envision and improve the flow of ideas in a presentation.
See MECE, Minto Pyramid Principle.
Straight Through Processing (STP) – An initiative used by financial trading firms to eliminate (or at least reduce) the time to process financial transactions.
STP is enabled by computer-based information and communication systems that allow transactions to be transferred in the settlement process without manual intervention. STP represents a major shift from present-day, three-day trading to same-day settlement. One of the benefits of STP is a decrease in settlement risk, because shortening transaction-related processing time increases the probability that a contract or an agreement is settled on time (adapted from www.investopedia.com/terms/s/straightthroughprocessing.asp, December 10, 2007).
See lockbox.
Strategic Business Unit (SBU) – A business unit that has either value propositions, core competences, or markets that are different from the other business units in the firm, and therefore must have its own unique strategy. ![]()
strategic sourcing – See sourcing.
strategy map – A causal map that shows the relationships between the critical elements of the organization’s business system. ![]()
Kaplan and Norton (2000) proposed strategy maps as a tool for communicating the critical relationships and metrics needed to understand and implement the organization’s strategy. According to Larry Bossidy, former Chairman of Honeywell, many companies fail to execute their strategy and therefore fail in the marketplace because they do not clearly communicate the strategy to those responsible for executing it (Bossidy, Charan, & Burck 2002). Many so-called leaders give only a vague description to their “troops” of what they should do and why each task is important. As a result, they ultimately “lead” their firms to failure. With mixed messages and unclear direction from the top, managers will do what they think is in the best interests of the firm, their own departments, and their own careers.
In the information age, businesses must create and manage complex business systems to offer distinctive value. These business systems are defined by highly interdependent relationships between customers, distributors, suppliers, employees, buildings, machines, product technologies, process technologies, information technologies, knowledge, and culture. These relationships must be made clear if the strategy is going to be understood and implemented in these complex business systems.
Strategy maps can show cause and effect relationships for business relationships, such as the following:
• The firm’s value proposition, target markets, and business performance
• The firm’s value proposition and investments in people, systems, R&D, capacity, and process technology
• Employee recognition programs, employee reward systems, employee motivation, service quality, customer satisfaction, and customer loyalty
• Sales force size, incentives, and sales
• Advertising investment, message, and media selection
Strategy maps can also highlight the key metrics that will be used to motivate and monitor the execution of the strategy. Kaplan and Norton (1996) argue that the strategy map should focus on the few “balanced scorecard” metrics that drive the strategy to success. These metrics should be reported at a high level in the firm. Goldratt (1992) emphasizes that most organizations have only one constraint (bottleneck) that restricts performance and that this constraint should be the focus for the strategy and the metrics.
Kaplan & Norton’s four views for a strategy map

As shown on the right, Kaplan and Norton’s strategy maps show the causal relationships going from the bottom up to the top and require four perspectives (views or levels) for the strategy map – financial, customer, internal, and learning and growth. They require that the causal linkages always go in order from learning and growth at the bottom to financial at the top.
The figure below is a simplified example of a strategy map from Strategy Maps (Kaplan & Norton 2004). This example shows how the four perspectives cascade up the causal map to create the airline’s strategy. The strategic analysis begins at the top with the question, “How do we improve RONA?” The answer in this analysis is to grow the business without adding more aircraft. As the analysis moves down the causal linkages, the key strategic initiative must be ground crew training to improve the ground turnaround time. Spear (2008) asserts that this fast turnaround is the main competitive advantage of Southwest Airlines.
Each link in the strategy map states a “hypothesis” or a belief about the causal relationship. For example, in this strategy map, we see that management believes that “ground crew training” will improve the turnaround time. Now that this link is explicitly communicated as a part of the strategy, it can be openly discussed and even tested.

In the causal mapping work by Scavarda, Bouzdine-Chameeva, Goldstein, Hays, and Hill (2006) and others, strategy maps can be drawn in any direction and do not require Kaplan and Norton’s four perspectives. They argue that Kaplan and Norton’s strategy mapping process imposes too much structure on the causal mapping process. See the causal map entry for a strategy map presented in a causal mapping format. See the Balanced Scorecard entry for a complete list of references.
See balanced scorecard, causal map, DuPont Analysis, hoshin planning, hypothesis, lean sigma, mindmap, mission statement, operations performance metrics, operations strategy, target market, turnaround time, value proposition, Y-tree.
stratification – See sampling.
stratified sampling – See sampling.
Student’s t distribution – A continuous probability distribution used when the sample size is small (i.e., less than 30) to test if two population means are different or to create a confidence interval around a population mean; also known as the t-distribution, the T distribution, and the Student’s t distribution.
Given a random sample of size n from a normal distribution with mean μ, sample mean ![]() , and sample standard deviation s, the t statistic is the random variable
, and sample standard deviation s, the t statistic is the random variable ![]() , which follows the Student’s t distribution with k = n − 1 degrees of freedom. The density function for the t statistic is symmetric around the origin and bell-shaped like the standard normal distribution, but has a wider spread (fatter tails). As the degrees of freedom increase, the tails of the t distribution become thinner, and the t distribution approaches the normal. Most statistics texts state that when n > 30, the normal is a good approximation for the Student’s t distribution.
, which follows the Student’s t distribution with k = n − 1 degrees of freedom. The density function for the t statistic is symmetric around the origin and bell-shaped like the standard normal distribution, but has a wider spread (fatter tails). As the degrees of freedom increase, the tails of the t distribution become thinner, and the t distribution approaches the normal. Most statistics texts state that when n > 30, the normal is a good approximation for the Student’s t distribution.
The z statistic is defined as ![]() . Both t and z are approximately standard normal (e.g., N(0, 1)) when n is large (i.e., n > 30), but z is exactly standard normal regardless of the sample size if the population is exactly normal with known standard deviation σ. The t statistic is exactly Student’s t if the population is exactly normal regardless of the sample size.
. Both t and z are approximately standard normal (e.g., N(0, 1)) when n is large (i.e., n > 30), but z is exactly standard normal regardless of the sample size if the population is exactly normal with known standard deviation σ. The t statistic is exactly Student’s t if the population is exactly normal regardless of the sample size.
Parameter: Degrees of freedom, k.
Density and distribution functions: ![]() with k degrees of freedom, k
with k degrees of freedom, k ![]() I, k
I, k ![]() 1.
1. ![]() dx with k degrees of freedom.
dx with k degrees of freedom.
Statistics: Range (–∞, ∞). Mean = 0 for k > 1; otherwise undefined. Median = mode = 0. Variance = k / (k - 2) for k > 2; ∞ for 1 < k ![]() 2; otherwise, undefined.
2; otherwise, undefined.
Graph: The graph on the right compares the normal density function (narrow line) with the Student’s t density with k = 2 (darker line) and k = 10 degrees of freedom (middle line). The Student’s t approaches the standard normal as k increases.
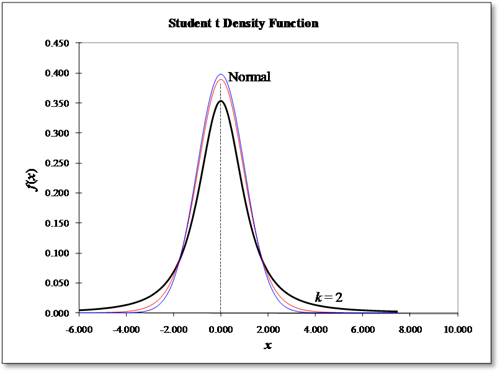
Excel: Caution: The Excel 2003 and 2007 documentation for the Student’s t distribution is confusing. TDIST(x, k, tails) returns the tail probabilities for a t distributed random variable with k degrees of freedom for one or two tails (tails =1 or 2). If tails = 1, TDIST(x, k, tails) returns the upper tail probability (e.g., P(tk ![]() x) and if tails = 2, TDIST(x, k, tails) returns P(| t | > x) or equivalently P(t < – x) + P(t > x). If x < 0, F(x) = TDIST(– x, k, 1) and if x
x) and if tails = 2, TDIST(x, k, tails) returns P(| t | > x) or equivalently P(t < – x) + P(t > x). If x < 0, F(x) = TDIST(– x, k, 1) and if x ![]() 0, F(x) = 1 − TDIST(x, k, 1). TDIST is not defined for x < 0.
0, F(x) = 1 − TDIST(x, k, 1). TDIST is not defined for x < 0.
TINV(p, k) is the 100(1 − p) percentile of the two-tailed t distribution with k degrees. In other words, if p < 0.5, then –TINV(2p, k) = F-1(p) and if p ![]() 0.5, then TINV(2(1 − p), k) = F-1(p). For example, when (p, k) = (0.0364, 10), then F-1(0.0364) = –TINV(2·0.0354, 10) = –2.0056 and when (p, k) = (0.9636, 10), then F-1(0.9636) = TINV(2(1 − 0.9636), 10) = 2.0056. The TINV function requires that p
0.5, then TINV(2(1 − p), k) = F-1(p). For example, when (p, k) = (0.0364, 10), then F-1(0.0364) = –TINV(2·0.0354, 10) = –2.0056 and when (p, k) = (0.9636, 10), then F-1(0.9636) = TINV(2(1 − 0.9636), 10) = 2.0056. The TINV function requires that p ![]() 0.5.
0.5.
TTEST(array1, array2, tails, type) is used for t-tests. See the t-test entry for more information.
Excel does not have a function for the Student’s t density function, but f(t, k) can be calculated with the Excel formula EXP(GAMMALN((k+1)/2))/SQRT(PI()* k)/EXP(GAMMALN(k/2))/(1+(t)^2/k) ^((k+1)/2).
History: Statistician William Sealy Gosset first published the Student’s t distribution in an article in Biometrika in 1908 using the pseudonym “Student.” Wikipedia’s article on Gosset and many other sources state that Gosset wanted to avoid detection by his employer, the Dublin brewery of Guinness, because Guinness did not allow employees to publish scientific papers due to an earlier paper revealing trade secrets. However, one source (www.umass.edu/wsp/statistics/tales/gosset.html, May 1, 2010) claims that the secrecy was because Guinness did not want competitors to know it was gaining a competitive advantage by employing statisticians.
See confidence interval, gamma function, normal distribution, probability density function, probability distribution, t-test.
subassembly – See assembly.
subcontracting – A person or organization that enters into a contract to perform part of or all the obligations of another party’s contract.
See level strategy, outsourcing, systems engineering.
Subject Matter Expert (SME) – Someone who is knowledgeable about a particular topic and therefore is designated to serve as a resource for a consulting project or process improvement project team.
SMEs are normally considered advisers to the project team rather than full team members. Consulting firms use the term “SME” for consulting experts who provide deep information on a particular topic. Some consulting firms are now using the term “subject area specialists.”
See project charter, project management.
suboptimization – A situation that occurs when an organization achieves something less than the best possible performance due to (a) misalignment of rewards or (b) lack of coordination between different units.
Suboptimization occurs in organizations when different organizational units seek to optimize their own performance at the expense of what is best for the organization as a whole. For example, the sales organization might exaggerate sales forecasts to ensure that enough inventory is available. However, this practice might result in high inventory carrying cost. Good leaders practice systems thinking, which motivates them to understand the entire system and find global rather than suboptimal solutions.
See balanced scorecard, Management by Objectives (MBO), systems thinking.
subtraction principle – Application of the lean thinking to eliminate the waste in a process.
Love (1979) defines the elimination principle for improving a process as removing any unnecessary activities. This is one important application of lean thinking.
See 8 wastes, addition principle, human resources, job design, lean thinking, multiplication principle.
successive check – See inspection.
sunk cost – An important managerial economics principle that once a cost has been incurred, it becomes irrelevant to all future decision making. ![]()
For example, a firm has invested $10 million in developing a new product. The firm needs to decide what it should do with respect to the new product. A careful analysis of the situation should consider the future alternatives for the firm without regard to the amount of money already invested. That investment is a sunk cost and is irrelevant to the evaluation of the alternatives. Organizations and individuals should not allow emotions or reputational concerns to confuse their analysis in making sound economic decisions about courses of action.
See economics, financial performance metrics, marginal cost.
super bill of material – See bill of material (BOM).
supermarket – A lean manufacturing concept of using a buffer inventory on the shop floor to store components for downstream operations.
In the context of lean manufacturing, a supermarket is typically a fixed storage location and is designed to provide highly visual current status information. A withdrawal of a unit from a supermarket will usually signal the need for more production.
See fixed storage location, lean thinking, pacemaker, periodic review system.
supplier – An individual or organization that provides materials or services to a customer; also known as a vendor. ![]()
Most buyers request materials or services from a supplier through a purchase order, and most suppliers respond to a purchase order with an invoice to request payment. Many suppliers are wholesalers or distributors who purchase and store materials produced by manufacturers. Wholesalers and distributors are often valuable members of a supply chain because they provide place utility (by having products close to the buyer) and time utility (by being able to get the product to the buyer quickly) and can reduce transaction cost (by being able to provide a wide variety of products with only one financial transaction). For example Granger, a large supplier (distributor) of MRO products to manufacturers, provides 3M sandpaper and many other factory supplies from a single catalog and from many stocking locations around North America.
See Accounts Receivable (A/R), invoice, Maintenance-Repair-Operations (MRO), purchase order (PO), purchasing, spend analysis, supply chain management, wholesaler.
supplier managed inventory – See vendor managed inventory (VMI).
supplier qualification and certification – Programs designed by purchasing organizations to test if suppliers can meet certain standards.
A supplier is said to be qualified by a customer when it has been determined that the supplier is capable of producing a part. A supplier is said to be certified when it has delivered parts with perfect quality over a specified time period. In many organizations, when a supplier becomes certified, the customer stops inspection. Ideally, the two firms then share in the cost savings. Of course, each purchasing organization will have its own standards for qualification and certification.
See dock-to-stock, inspection, purchasing, quality at the source, quality management, receiving, supply chain management.
supplier scorecard – A tool for customers to give evaluative feedback to their suppliers about their performance, particularly with respect to delivery and quality.
A supplier scorecard is a powerful tool for customers to give feedback to their suppliers about their performance and to help them improve over time. In addition, many leading firms, such as Best Buy, also use supplier scorecards as a mechanism for inviting suppliers to give them feedback so they can work together to improve supplier coordination and communication. Each firm has different needs and therefore should have a unique scorecard format. Ideally, supplier scorecards should be as simple as possible, measure only the vital few metrics, and be updated regularly.
Standardizing the supplier scorecard for an entire firm has advantages with respect to systems, communications, and training. Multi-divisional firms need to standardize their scorecards so suppliers that supply to more than one division will see only one supply scorecard – or at least only one supplier scorecard format. However, many firms have found this to be a difficult challenge.
Supplier scorecards have many benefits for both the customer and the customer’s supply network, including:
• Creation benefits – The process of setting up a supplier scorecard program forces the customer to align competitive priorities and the supply management strategy by deciding which supplier metrics are most important to the business. For example, if a customer competes primarily on product innovation, a responsive supply chain is important and the metrics should focus on new product development collaboration and leadtimes and de-emphasize price (or cost). Similarly, if the customer competes on price, an efficient supply chain is important and the metrics should focus on price (Fisher 1997). It is common for customers to constantly “beat up” suppliers, telling them that they need to improve everything or they will lose business. However, the reality is that many metrics conflict with each other, and a supplier can only successfully focus on improving a few metrics at a time. If too many metrics are chosen, the supplier will spread limited resources too thin and little improvement will be achieved.
• Communication and prioritization benefits – An effective supplier scorecard helps customers and suppliers communicate on a higher level. When a scorecard is published, the leadership of the supplier’s organization receives a clear message about what is important to the customer.
• Process improvement program benefits – An effective supplier scorecard system helps the supplier prioritize process improvement projects in light of the customer’s requirements.
• Rapid correction benefits – If the measurement period is properly established, a good scorecard program can help point out easily correctable problems. For instance, if the metrics are measured every week, and it is noted that there is a pattern of higher lot rejects every fourth week, it could indicate that problems are arising at the end of each month, because the supplier rushes to get inventory out the door to make monthly shipping goals.
• Supplier selection benefits – The scorecard program will also serve as an objective tool for making data-driven supplier selection (sourcing) decisions. It is easy for customers to focus only on the most recent disappointment (e.g., the most recent late shipment or rejected lot) and make judgments based on perception and emotion. Once a scorecard program has been implemented, it becomes easier to analyze the data to reach sound conclusions about which course of action should be taken. The supplier with the highest scorecard rating will likely retain the business and be awarded a larger share of any new business.
• Commitment benefits – A properly developed scorecard program can help create a climate of cooperation that can benefit the customer and the supplier.
The typical measurement for make to stock items is the percentage of orders filled immediately from stock. In addition, average days-late information may also be recorded. For make to order and assemble to order items, the metrics relate to on-time delivery. This metric must define the “on-time” standard, which could be defined as the requested delivery date, the original promised delivery date, or a revised promised delivery date. Most firms use the original promised delivery date.
In addition to being delivered on time, a product must also meet the customer’s quality requirements. The parts should meet the agreed-to level of quality for construction and tolerances based on the specifications that the parts are ordered to. Quality can either be measured in percentages of lots accepted (first pass yield), defects per million opportunities (DPMO), or other similar measures.
Delivery and quality are the foundation for nearly all supplier scorecard programs, but many firms also use additional metrics such as:
• Customer service
• Technical support
• Volume flexibility
• Planned versus actual leadtime
• R&D metrics/Product innovation
• Financial metrics
• Improvement in process capabilities/SPC
• Process innovation
• Cost savings ideas
• Risk management
However, many of these metrics are difficult and costly to measure, making it important for the supplier and the customer to define them jointly and agree on the measurement method.
Many companies benefit from a supplier scorecard program. Scorecards have the potential to significantly improve supplier performance without large capital investments. A properly structured program will give the buying organization the necessary tool for making important sourcing decisions. A good supplier scorecard program can also help the purchasing organization prioritize its supplier development/supplier process improvement efforts.
In some cases the customer will see supplier improvement that is due to superficial improvement, such as increased sorting of defective parts. Ideally, a good scorecard program should drive improvements backward through the supply chain so the customer has visibility into the capabilities of the suppliers’ processes.
See balanced scorecard, benchmarking, buyer/planner, customer service, dashboard, incoming inspection, on-time delivery (OTD), operations performance metrics, purchasing, supply chain management, yield.
supply chain – See supply chain management.
Supply Chain Council – A non-profit professional society dedicated to meeting the needs of supply chain management professionals; most famous for its development and use of the SCOR Model.
The Supply Chain Council was founded in 1996 by the consulting firm Pittiglio Rabin Todd & McGrath (PRTM) and AMR Research and initially included 69 voluntary member companies.
The Supply Chain Council now has about 1,000 corporate members worldwide and has established international chapters in North America, Europe, Greater China, Japan, Australia/New Zealand, South East Asia, Brazil and South Africa. Development of additional chapters in India and South America are underway. The Supply Chain Council’s membership consists primarily of practitioners representing a broad cross-section of industries, including manufacturers, services, distributors, and retailers.
The Supply Chain Council is closely associated with the SCOR Model. The website for the Supply Chain Council is www.supply-chain.org.
See operations management (OM), SCOR Model, supply chain management.
supply chain management – The activities required to manage the flow of materials, information, people, and money from the suppliers’ suppliers to the customers’ customers. ![]()
Supply chain management is the integration of and coordination between a number of traditional business functions, including sourcing, purchasing, operations, transportation/distribution/logistics, marketing/sales, and information systems. It also includes coordination and collaboration with channel partners, which can be suppliers, intermediaries, third party service providers, and customers. In essence, supply chain management integrates supply and demand management within and across companies.
The table below lists the responsibilities, entities, and decisions for each of the primary functions involved in supply chain management. All of these functions must be involved in coordinating with the others for the organization and the supply chain to be successful.

The Supply Chain View figure on the right was developed from an extensive survey of more than 300 supply chain experts (Scavarda & Hill 2003). The figure emphasizes that supply chain management begins with the fundamental premise that coordination, collaboration, and a sense of co-destiny can be beneficial to all members in a supply chain. In the words of Professor K. K. Sinha56, “Competition is no longer firm against firm, but supply chain against supply chain.” Starting with this supply chain view, the “partners” in the supply chain need to design the supply chain to fit with a common strategy. These activities require collaboration and trust. Based on this strategy, the supply chain “partners” need to coordinate their efforts for both new and existing products. This requires shared metrics, scorecards to communicate these metrics, and information systems to communicate transactional data and the scorecard information. Parallel to the coordination, it is critical that the supply chain “partners” develop a deep understanding of the customers for the supply chain (not just their immediate customers), how they are linked together (information and transportation systems), and the cost structure for the entire supply chain.

Source: Professor Arthur V. Hill
The result of good supply chain management should be lower total system cost (lower inventory, higher quality), higher service levels, increased revenues, and increased total supply chain profit. However, the key issue is how the supply chain will share the benefits between the players in the supply chain.
Supply chain management is a major theme of this encyclopedia. The reader can find more information on supply chain management principles by going to the links listed below. The SIPOC Diagram and SCOR Model entries provide particularly useful frameworks for understanding supply chain management.
See broker, bullwhip effect, business process outsourcing, buy-back contract, channel conflict, channel integration, channel partner, contract manufacturer, cross-docking, demand chain management, digital supply chain, disintermediation, distribution channel, distributor, dot-com, facility location, forecasting, Institute for Supply Management (ISM), inventory management, inventory position, leverage the spend, logistics, make versus buy decision, maquiladora, materials handling, materials management, offshoring, operations strategy, outsourcing, pipeline inventory, purchasing, risk sharing contract, SCOR Model, SIPOC Diagram, sourcing, spend analysis, square root law for warehouses, supplier, supplier qualification and certification, supplier scorecard, Supply Chain Council, systems thinking, tier 1 supplier, traceability, value chain, vendor managed inventory (VMI), vertical integration, warehouse, wholesaler.
sustainability – The characteristic of a process that can be indefinitely maintained at a satisfactory level; often equated with green manufacturing, environmental stewardship, and social responsibility. ![]()
In the environmental context, sustainability usually refers to the longevity of systems, such as the climate, agriculture, manufacturing, forestry, fisheries, energy, etc. Ideally, these systems will be “sustainable” for a very long time to the benefit of society.
In the supply chain context, sustainability deals with issues, such as reducing, recycling, and properly disposing of waste products, using renewable energy, and reducing energy consumption. Some of the supply chain decisions that affect sustainability include (1) product design (packaging, design for environment, design for disassembly), (2) building design (green roofs, xeriscaping57, energy efficiency), (3) process design (sewer usage, water consumption, energy efficiency, safety), and (4) transportation (reducing distance traveled, using fuel efficient vehicles, reducing product weight by making liquid products more concentrated).
For example, Bristol-Myers Squibb defined specific goals for 2010 on the following dimensions (source: http://bms.com/static/ehs/vision/data/sustai.html, October 11, 2008):
• Environmental, health, and safety
• Safety performance
• Environmental performance
• Sustainable products
• Supply chain
• Sustainability awards
• Biotechnology
• Community
• Social
• Endangered species
• Land preservation
An executive at General Mills contributed this informal list of bullet points that his company uses in internal training on sustainability (with a few edits by this author):
• Measurement systems – Life cycle analysis of ingredients and materials.
• Tracking systems – Water, gas, electricity.
• External relationships – Paint a picture of the stakeholders, NGOs, governments, shareholders, watchdog groups, for-profit agencies, and rating agencies.
• Public communications – What’s in a corporate social responsibility report?
• Agriculture and bio-systems “supply chains” – Where does food come from?
• Sourcing – Where does everything else come from?
• Demographics – World population, consumption of raw materials per capita.
• Emerging economies – Growth of China and India and the impact on the world.
• Recycling – How does it work? Does it work? What can and can’t be recycled?
• Politics and taxation of carbon – Cap and trade, world treaties, taxing to manage consumption.
• Organic – Facts and fiction.
See cap and trade, energy audit, green manufacturing, Hazard Analysis & Critical Point Control (HACCP), hazmat, operations strategy, triple bottom line.
swim lanes – See process map.
switching cost – The customer’s cost of switching from one supplier to another. ![]()
For example, the switching cost for a medical doctor to change from implanting one type of pacemaker to another is quite significant, because the doctor will have to learn to implant a new type of pacemaker and learn to use a new type of programmer to set the parameters for the pacemaker.
It is often in the supplier’s best interest to increase the customer’s switching costs so the customer does not defect to the competition the first time the competition offers a slightly lower price. Some suppliers have been successful in increasing switching costs through frequent-purchase reward programs. For example, large airlines offer frequent flyer miles to encourage flyers to be “loyal” to their airlines. Others have increased switching costs by helping customers reduce transaction costs through information systems. For example, a hospital supply firm provided free computer hardware to hospitals to use to order their supplies. This lowered the hospital’s transaction cost, but also made it harder for the hospitals to change (switch) to another supplier.
An interesting study by Oberholzer-Gee and Calanog (2007) found that trust increased the perceived switching cost and created barriers to entry. Customers were reluctant to change suppliers when they had a supplier they could trust, even when a competitor appeared to offer superior benefits.
See core competence, loss leader, outsourcing, search cost, total cost of ownership, transaction cost, Vendor Managed Inventory (VMI).
SWOT analysis – A popular strategic analysis tool that considers strengths, weaknesses, opportunities, and threats.
SWOT analysis

SWOT analysis is a tool for auditing an organization and its environment. It is a good place to start a strategic planning process. Strengths and weaknesses are internal factors, whereas opportunities and threats are external factors. Strengths and opportunities are positives, whereas weaknesses and threats are negatives. SWOT analysis is often facilitated using the nominal group technique using Post-it Notes. The facilitator leads the team through the process of generating many Post-it Notes for each topic and then sorting the Post-it Notes into meaningful groups. After all four topics are analyzed, the discussion should move to defining specific projects that need to be pursued to address the most important issues found in the SWOT analysis.
See competitive analysis, five forces analysis, industry analysis, operations strategy.
synchronous manufacturing – The Theory of Constraints’ ideal of the entire production process working in harmony to achieve the economic goals of the firm.
When manufacturing is truly synchronized, its emphasis is on total system performance, not on localized measures, such as labor or machine utilization.
See Theory of Constraints (TOC).
system – A collection of interdependent parts that interact over time. ![]()
A system is a set of interdependent elements (often including people, machines, tools, technologies, buildings, information, and policies) that are joined together to accomplish a mission. Good examples include factories, supply chains, automobiles, and computers.
See systems engineering, systems thinking.
systems engineering – An interdisciplinary field and approach that focuses on managing complex engineering design projects.
A system is a collection of entities that interact to produce an objective or result. Large systems are often very complex and require systems engineers to coordinate activities across many engineering disciplines (e.g., mechanical, electrical, aerospace), scientific disciplines (e.g., physics, chemistry), and functional organizations (e.g., new product development, marketing, manufacturing) so the project meets customer needs.
Systems engineering includes both management and technical activities. The management process focuses on program and project management, while the technical process focuses more on tools, such as modeling, optimization, simulation, systems analysis, statistical analysis, reliability analysis, and decision theory. Systems engineers also use a wide range of graphical tools to represent problems.
For example, systems engineers at Lockheed Martin involved in the Joint Strike Fighter project must ensure that the electrical and mechanical systems work together properly and must coordinate work between subcontractors working on each of the subsystems.
The International Council on Systems Engineering (ICOSE) was created to address the need for improvements in systems engineering practices and education. Many schools around the world now offer graduate programs in systems engineering. Many experts believe that practical experience is needed to be an effective systems engineer, which explains why few schools offer systems engineering undergraduate programs.
See industrial engineering, subcontracting, system, systems thinking.
systems thinking – A worldview that encourages a holistic understanding of how a collection of related entities interact with each other and the environment over time to fulfill its mission.
Systems thinking is a holistic way of understanding the world. It not only considers the system at a point in time, but also considers how a system changes over time in response to changes in its environment. Contrary to Descartes’ reductionist view, systems thinking argues that a system cannot be understood just by studying its parts. Systems thinking acknowledges that a change in one area can adversely affect other areas of the system.
For example, the reductionist approach to improving the braking system in a car would study each component separately (brake pads, brake pedal, brake lights, etc.). In contrast, systems thinking studies all components related to the braking system of the car, including the braking system, the car display, the driver, the road, and the weather, and how these components interact with each other over time.
Application of systems thinking to the supply chain has created what many consider to be a new business discipline with multiple professional societies, journals, and job titles that did not exist until the mid-1980s.
See process, simulation, SIPOC Diagram, suboptimization, supply chain management, system, systems engineering.
system reliability – See reliability.