
P
pacemaker – (1) In a manufacturing context: The lean manufacturing concept of using a single workcenter to set the pace (speed) for the entire process; also called a pacing process. (2) In a medical context: A medical device used to set the pace of a patient’s heart.
In the lean manufacturing context, the pacemaker should be used to level-load the system over time and to set the pace for the other processes in the system. Ideally, the pace for the pacing process should be determined by the takt time, which is the cycle time determined by the market demand rate. Processes before the pacemaker (upstream) should produce only when they receive a pull signal from the next downstream process or directly from the pacemaker. This helps prevent overproduction and keeps the pacemaker from being starved. Processes after the pacemaker (downstream) should not block the pacemaker, should push materials in small order quantities (possibly using transfer batches), and should not be allowed to have inventories except in supermarkets or finished goods inventory. The pacemaker is normally the assembly process in a make to stock system. In make to order systems, the pacemaker is typically the process step where the product becomes unique.
Using a pacemaker simplifies scheduling, maintains a level output, focuses on the bottleneck, and prevents overproduction. The pacemaker concept is similar to the Drum-Buffer-Rope concept (Theory of Constraints) and to the CONWIP concept.
See CONWIP, Drum-Buffer-Rope (DBR), gateway workcenter, lean thinking, supermarket, takt time, Theory of Constraints (TOC), transfer batch, upstream.
pacing process – See pacemaker.
Pack to order – A customer interface strategy that collects components and packs them into a box or some other shipping container in response to a customer order.
Pack to order is similar to assemble to order, because it is “assembling” the shipment, which includes one or more products, packaging, and shipping information, in response to a customer order. Boston Scientific’s “pack to demand” process fills orders from inventory by attaching a country- and language-specific label to the box before shipping.
See make to order (MTO), mass customization, respond to order (RTO).
packing slip – The paperwork that accompanies a shipment and describes its contents, including information such as order numbers, item numbers, and quantities.
See Advanced Shipping Notification (ASN), bill of lading, manifest.
Paired-cell Overlapping Loops of Cards with Authorization – See POLCA.
pallet – A portable horizontal, rigid platform used as a base for storing, stacking, and transporting a load of goods.
Pallets are designed to be picked up and moved by a forklift truck. Pallets vary with respect to size, design, strength, and materials. Most pallets are made from wood, but they can also be made from plastic or steel. A two-way pallet allows a forklift truck to enter from the front or the back, whereas a four-way pallet is designed so a forklift can enter the pallet from any side. The most common pallet in the U.S. is the Grocery Manufacturer’s Association (GMA) grocery pallet, which is a 4-way pallet that is 40 inches (101.6 cm) wide, 48 inches (121.92) deep, and 5 inches (12.7 cm) high. A skid is a pallet that does not have bottom deck boards.
See forklift truck, logistics, warehouse.
paradigm – A way of thinking; a frame of thought.
An old paradigm can inhibit creative thinking about a new problem. A new paradigm (also called a “paradigm shift”) can be a powerful new way of thinking about an old problem. For example, in the Soviet factory management paradigm, bigger and heavier machines were usually better. This influenced reward systems and machine design in many negative ways. The quality management field has seen a paradigm shift from thinking that quality and cost are always trade-offs to understanding that improved conformance quality usually leads to lower cost.
See bounded rationality, inductive reasoning.
parent item – See bill of material (BOM).
Pareto analysis – See Pareto Chart.
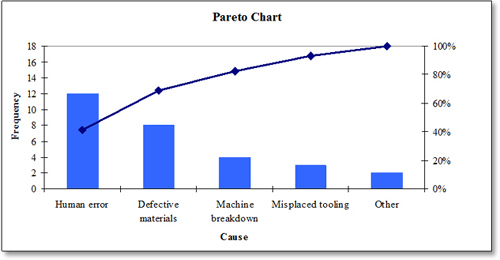
Pareto Chart – A histogram (bar chart) that helps identify and prioritize the most common sources of errors or defects. ![]()
The Pareto Chart, named for Vilfredo Pareto, was popularized as a quality management tool by Joseph M. Juran and Kaoru Ishikawa. The basic concept is based on Pareto’s Law, which teaches that each system has an “important few and a trivial many” (often called the 80-20 principle). A Pareto Chart highlights the important few by displaying the frequencies for the causes of a problem, sorted from highest to lowest.
For example, an analysis of work stoppages on a production line is shown in the table on the right, presented here from highest to lowest frequency. These data were graphed to create the Pareto Chart below, which highlights the need to focus on the causes of human errors.
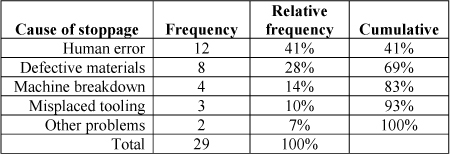
The line shows the cumulative frequency and shows the total percent of the causes up to and including that cause. Fixing the first two causes (human error and defective materials) will remove 69% of the stoppage problems, whereas fixing the last two will remove only 17%.
Pareto Charts can easily be generated in Microsoft Excel. When selecting the chart type, go to “custom types” and select “Line – Column on 2 Axes.”
See ABC classification, bar chart, causal map, checksheet, Failure Mode and Effects Analysis (FMEA), histogram, Pareto’s Law, Root Cause Analysis (RCA), seven tools of quality.
Pareto efficiency – See Pareto optimality.
Pareto optimality – An economics concept developed by the Italian economist Vilfredo Pareto that describes a situation where no one individual can be made better off without making other individuals worse off; also called Pareto efficiency.
Given an initial allocation of goods among a set of individuals, a Pareto improvement is a reallocation that makes at least one individual better off without making any others worse off. An allocation is Pareto optimal (Pareto efficient) when no other Pareto improvements can be made. Pareto efficiency does not necessarily result in a socially desirable distribution of resources and makes no statement about equality or the overall well-being of a society.
See economics, Pareto’s Law.
Pareto’s Law – The principle that most systems have a vital few and a trivial many; also called the 80-20 rule or principle. ![]()
Pareto’s Law teaches that most of the consequences in a system come from just a few of the causes. Some popular expressions of Pareto’s Law include, “Don’t sweat the small stuff,” “Major on the majors,” and “the vital few and the trivial many.” Juran preferred to say “the vital few and the useful many” to emphasize that the less important causes should not be ignored. The implication of Pareto’s Law is that people need to find and focus on the important few causes (issues, items, people, customers, problems) and not spend too much time on the many causes that do not matter as much. Pareto’s Law is written as two numbers, where the first number represents the percentage of the consequences (e.g., cost, errors) and the second number is the percentage of objects (e.g., causes). Note that the two numbers do not need to add up to 100.
Examples of Pareto’s Law include the ABC classification (manage the high dollar volume items), FMEA (manage the high risk failure modes), Theory of Constraints (manage the bottleneck), dispatching rules (start high-priority jobs first), critical path and critical chain analysis (manage the most important path and tasks in a project), supplier management (just a few suppliers account for most of the spend), customer sales distribution (few customers account for most of the sales), quality control (most of the defects can be attributed to just a few causes), human relations (most of the problems are caused by just a few people), sports (just a few players make most of the points), medicine (most people die from one of a few causes), and international relations (most of the problems in the world are caused by just a few rogue nations).
Alfredo Pareto was an Italian economist who lived in France in the early 1900s. In studying the distribution of wealth in Milan (Milano), he found that 20% of the people earned about 80% of the wealth. Although developed by the same man, Pareto’s Law is unrelated to the economics concept of Pareto efficiency. A Pareto Chart is a useful way to show a frequency count and highlight the higher priority issues.
See ABC classification, causal map, cycle counting, error proofing, Failure Mode and Effects Analysis (FMEA), Lorenz Curve, Pareto Chart, Pareto Optimality, Root Cause Analysis (RCA), Theory of Constraints (TOC).
parking lot – A meeting facilitation tool used to store discussion items not immediately relevant to the agenda.
Meeting participants often raise issues that are not immediately relevant to the current topic. When this happens, the meeting leader and other participants should keep the focus on the current agenda by (1) suggesting adding the item to the parking lot, (2) quickly adding the idea to the parking lot list if others agree, and (3) immediately returning to the current agenda item. The parking lot list is often written on a whiteboard or flip chart. If Post-it Notes are being used to brainstorm ideas, the parking lot can be a set of Post-its on a side wall. Ideally, the facilitator and participants will show respect for the person, show respect for the idea, and capture potentially important ideas for future discussions. Just before the meeting adjourns, the facilitator should ensure that someone records the parking lot issues and that the items will be addressed appropriately. In many cases, parking lot items should be added to the agenda for the next meeting.
See affinity diagram, brainstorming, causal map, Nominal Group Technique (NGT), personal operations management, two-second rule.
Parkinson’s Laws – Laws written by Professor C. Northcote Parkinson in the book Parkinson’s Law (1958). ![]()
A 20th century British author and professor of history, Cyril Northcote Parkinson (1909-1993) wrote some sixty books, including his famous satire of bureaucratic institutions. Parkinson’s most famous law is often quoted as “Work expands to fill the time allotted to it”; however, Parkinson’s actual wording was, “Work expands so as to fill the time available for its completion.” Here are some other examples of Parkinson’s laws:
• Expenditure rises to meet income.
• Expansion means complexity, and complexity decay.
• Policies designed to increase production increase employment; policies designed to increase employment do everything but.
• When something goes wrong, do not “try, try again.” Instead, pull back, pause, and carefully work out what organizational shortcomings produced the failure. Then, correct those deficiencies. Only after that, return to the assault.
• Delay is the deadliest form of denial.
• The matters most debated in a deliberative body tend to be the minor ones where everybody understands the issues.
• Deliberative bodies become decreasingly effective after they pass five to eight members.
This author has written a few 21st century operations management corollaries to Parkinson’s Laws:
• Inventory expands to fill the space allotted to it.
• The best way to improve on-time delivery is to reduce cycle time so that customers have taken delivery before they have time to change their minds.
• Lying begets41 lying. If a firm lies to its customers about expected delivery dates, customers will lie to the firm about the actual need date.
• The later a project becomes, the more unlikely it is that the project manager will inform the customer of the project’s lateness.
• The pi rule for project management: Poorly managed projects require approximately pi (3.1416) times more time than originally planned.
See bullwhip effect, leadtime syndrome, Murphy’s Law, project management.
PARM (Perishable Asset Resource Management) – See yield management.
parsimony – Adoption of the simplest assumption in the formulation of a theory or in the interpretation of data, especially in accordance with the rule of Occam’s Razor.
See Occam’s Razor.
part number – A unique identification number (or alphanumeric string) that defines an item for inventory management purposes; also called Stock Keeping Unit (SKU), item number, material, product code, or material. ![]()
Historically, APICS and other professional societies in North America have used the terms “item number” or “part number.” However, SAP, the most widely used Enterprise Resources Planning (ERP) system, uses the term “material.” Retailers often use the term “Stock Keeping Unit (SKU).” In some cases, a part number is used to identify the “generic” item, and the SKU is used for the inventory count for that part number at a specific location. A serial number is an identifier for a specific unit.
It is better to use all numeric part numbers (0-9) and not mix alpha (A-Z) and numeric characters. This is because many numbers and letters are easily confused in both reading and writing. For example, the number 1 and the letter l, the number 5 and the letter S, and the number 0 and the letter O are easy to confuse on a computer screen and in handwriting. In addition, many letters sound the same. For example, K and A, M and N, and Y and I sound alike. If letters are used, they should not be case-sensitive.
A significant (meaningful) part number uses characters, or groups of characters, coded to describe item attributes, such as the product family, commodity, location, or supplier. A semi-significant part number is an identifier that uses a portion of the number that is meaningful. Significant part numbers rarely work very well because product attributes change over time and part numbers require too many characters to be truly meaningful. It is good practice, therefore, to use short (seven digits or less) non-meaningful part numbers to reduce data entry time and errors and then use additional codes for item attributes. The use of Automated Data Collection (ADC) systems, such as barcoding and RFID, has made these issues less important.
Check digits are often added to the base part number to make it possible to conduct a quick validity check. See the check digit entry for more information.
In manufacturing, some items might exist for a short period of time in the assembly process. These items are sometimes called phantom items. However, if these items are not inventoried, they should usually not be given part number identifiers.
See active item, Automated Data Collection (ADC), barcode, bill of material (BOM), check digit, Electronic Product Code (EPC), locator system, phantom bill of material, product family, Radio Frequency Identification (RFID), raw materials, traceability, unit of measure, Universal Product Code (UPC), warehouse.
part period balancing – See lotsizing.
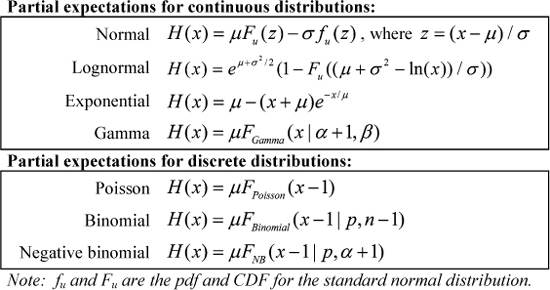
partial expectation – The partial first moment of a random variable; also called partial moment.
The partial expectation for a probability distribution is an important property used in inventory theory and risk management. The complete expectation (first moment) for continuous random variable X is the expected value 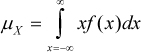 . The partial expectation evaluated at x0 is
 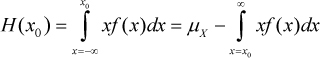 . Blumenfeld (2010) and others defined the partial expectation as the weighted tail of the distribution
 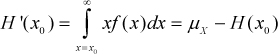 . The partial expectation is related to the conditional expectation with H(x0) = E(X | X < x0)P(X < x0) or H(x0) = μ − E(X | X > x0)(1 − F(x0)).
The partial expectation functions for several distributions are presented in the table on the right. These equations were derived by the author from the tail conditional expectation functions in Landsman and Valdez (2005). Winkler, Roodman, and Britney (1972) presented closed-form expressions for the partial expectations for several distributions.
See gamma distribution, mean, probability density function, safety stock.
partial moment – See partial expectation.
Parts per Million (PPM) – See Defective Parts per Million (DPPM).
pay for performance – See gainsharing.
pay for skill – A compensation policy that rewards employees for developing new capabilities; also called skill-based pay, pay for knowledge, and pay for learning.
The organization provides training on a set of skills and increases the hourly pay rate for workers who can demonstrate that they have acquired new skills. For example, an employee who learns to use a laser welder might be paid an extra $0.25 per hour.
Some of the benefits of a pay for skill program include (1) allowing employers to cover for an absent worker, (2) reducing inventory and cycle time when workers can move to where the work is, (3) reducing boredom and increasing employee engagement, and (4) giving workers a broader perspective of the process, which gives them insights that can be used to improve the process.
On the negative side, pay for skill will not achieve greater performance for the employee if the skill is not needed or not used. Job rotation can also achieve many of the same benefits. A one-time bonus might make more sense in some cases. A similar approach is to create a labor grade (pay grade) system in which employees get promoted to new pay grades after mastering new skills.
See gainsharing, human resources, job design, job enlargement, job rotation, labor grade, piece work.
payback period – The time required to break even on an investment.
Payback ignores the time value of money and is regarded to be a crude and imprecise analysis. Much better methods include Net Present Value (NPV) and Economic Value Added (EVA). However, payback is still a commonly used approach for “quick and dirty” investment analysis.
See break-even analysis, financial performance metrics.
p-chart – A quality control chart used to monitor the proportion of units produced in a process that are defective; a unit is considered defective if any attribute of the unit does not conform to the standard.
To set up a p-chart, estimate ![]() , the long-term percent defective, from a large sample while the process is under control. Then set the upper and lower control limits at
, the long-term percent defective, from a large sample while the process is under control. Then set the upper and lower control limits at ![]() and
and ![]() .
.
To use a p-chart, sample n units from the process every so many lots, units, or time periods. The sample proportion is p = x/n, where x is the number of defective units found in the sample. Plot the sample proportion on the p-chart and determine if the process is “under control.”
The p-chart is based on the binomial distribution, which is the sum of n independent Bernoulli distributed binary (0-1) random variables with mean ![]() and standard deviation of the estimate
and standard deviation of the estimate ![]() . The normal distribution is a reasonable estimate of the binomial when
. The normal distribution is a reasonable estimate of the binomial when ![]() and
and ![]() .
.
Whereas the p-chart plots the proportion defective for any sample size, the np-chart plots the number of defective units for a fixed sample size.
See attribute, Bernoulli distribution, binomial distribution, control chart, np-chart, Statistical Process Control (SPC), Statistical Quality Control (SQC).
PDCA (Plan-Do-Check-Act) – A well-known four-step approach for process improvement; also called PDSA (Plan-Do-Study-Act), the Deming Cycle, and the Shewhart Cycle. ![]()
The PDCA cycle is made up of four steps:
• PLAN – Recognize an opportunity and plan the change. Plan to improve operations first by finding out what things are going wrong and then generate ideas for solving these problems. Decide what actions might reduce process variation.
• DO – Test the change. Make changes designed to solve the problems on a small or experimental scale first. This minimizes disruptions while testing whether the changes will work.

• CHECK – Review the test, analyze the results, and identify learning. Use data to determine if the change was effective in reducing variation. Check whether the small-scale or experimental changes are achieving the desired result or not. Also, continuously check nominated key activities (regardless of any experimentation going on) to provide information on the quality of the output at all times and to identify new problems that might appear.
• ACT – Take action based on what you learned in the check step. If the change was successful, implement the change and identify opportunities to transfer the learning to other opportunities for improvement. Implementation will likely require involvement of other persons and organizations (departments, suppliers, or customers) affected by the change. If the change was not successful, document that plan and go through the cycle again with a different plan.
Upon completion of a PDCA cycle, the cycle is repeated to test another idea. The repeated application of the PDCA cycle to a process is known as continuous quality improvement.
The PDCA cycle was developed by Shewhart (1939). Shewhart said the cycle draws its structure from the notion that constant evaluation of management practices, as well as the willingness of management to adopt and disregard unsupported ideas, is the key to the evolution of a successful enterprise. W. Edwards Deming first coined the term “Shewhart cycle” for PDCA, naming it after his mentor and teacher at Bell Laboratories in New York. Deming promoted PDCA as a primary means of achieving continued process improvement. He also referred to the PDCA cycle as the PDSA cycle (“S” for study) to emphasize the importance of learning in improvement. Deming is credited with encouraging the Japanese to adopt PDCA in the 1950s.
The Japanese eagerly embraced PDCA and other quality concepts, and to honor Deming for his instruction, they refer to the PDCA cycle as the Deming cycle. Many lean thinking programs use PDCA concepts.
Most quality improvement projects today use a similar five-step approach called DMAIC, which comes from the lean sigma movement. Most people (including this author) find DMAIC more intuitive and easier to follow than the PDCA or PDSA approaches.
See DMAIC, hoshin planning, lean sigma, quality management, Total Quality Management (TQM).
PDF – See probability density function.
PDM – See product data management.
PDSA (Plan-Do-Study-Act) – See PDCA.
pegging – The process of identifying the sources of the gross requirements for an item in the MRP materials plan.
Single-level pegging for a gross requirement goes up one level in the bill of material (BOM). Full-level pegging goes all the way up to the top level. Pegging is an important tool for helping production planners identify the impact that a late order might have on higher-level orders and customers. Pegging is like a where-used report, but is only used for those parent items that determine the gross requirements for the item.
See bill of material (BOM), bill of material implosion, Materials Requirements Planning (MRP), where-used report.
percentage bill of material – See bill of material (BOM).
perfect order fill rate – See fill rate.
performance management system – A set of policies and procedures with a supporting information system used to help create and maintain alignment between the organizational and employee goals.
A good performance management system is built on four main activities:
• Planning – The manager and direct reports collaboratively establish goals, objectives, outcomes, and training requirements for the direct report.
• Coaching – The manager trains, observes, and provides feedback to direct reports to improve performance.
• Appraisal – The manager provides performance feedback to direct reports and documents performance for both the pay and promotion decision processes.
• Rewards – The organization provides rewards in the form of recognition, pay raises, bonuses, and promotions.
Although performance measurement focuses only on evaluating performance, performance management takes a broader view, with more emphasis on intentional performance development. A good performance management system will align and coordinate individual behavior with the organization’s strategic objectives.
Culbert (2010) made 12 arguments against performance reviews:42
• Focus on finding faults and placing blame.
• Focus on deviations from some ideal as weaknesses.
• Focus on comparing employees.
• Create competition between boss and subordinate.
• Create one-sided-accountability and too many boss-dominated monologues.
• Create “thunderbolts from on high,” with the boss speaking for the company.
• Cause the subordinate to suffer if they make a mistake.
• Create an environment that allow the big boss to go on autopilot.
• Focuse on scheduled events.
• Give human resource people too much power.
• Do not lead to anything of substance.
• Are hated, and managers and subordinates avoid doing them until they have to.
Culbert (2010) went on to propose a collaborative constant dialog between the manager and employee built on trust and respect and where they are both responsible for success. Part of this dialog includes a “Performance Preview” that Culbert claimed holds people accountable, gives both managers and employees helpful feedback, and gives the company more of what it needs. He proposed three questions: (1) What are you getting from me that you like and find helpful? (2) What are you getting from me/the company that gets in your way and that you would like to have stopped? (3) What are you not getting from me/the company that you think would make you more effective? Tell me how that would help you specifically to do your job better?
Coens and Jenkins (2002) make similar arguments against performance reviews and suggest that managers should (1) provide honest feedback to employees by maintaining daily, two-way communication; (2) empower employees to be responsible for their careers, for receiving feedback, and for holding themselves accountable for the work to be done; (3) have the freedom to choose for themselves the most effective ways of working with people; (4) move away from an individual performance company to an organizational improvement company; and (5) create a culture to support the above.
See financial performance metrics, Management by Objectives (MBO), operations performance metrics, work measurement.
performance quality – See product design quality.
performance rating – A subjective estimate of a worker’s pace of work.
A 120% performance rating means that the observer estimated that the worker was working 20% faster than a normal worker. The performance rating is used to adjust the observed time to compute the normal time.
See normal time, standard time, time study, work measurement.
performance-based contracting – A legal relationship that allows organizations (usually governmental organizations) to acquire services via contracts that define what is to be achieved rather than how it is to be done.
In many situations, performance-based contracting provides good value products and services. In addition, performance-based contracting gives firms the freedom to bring new approaches to their customers.
See service guarantee, Service Level Agreement (SLA).
period cost – Expenses based on the calendar rather than the number of units produced; also called period expense.
Period costs include selling and administrative costs, depreciation, interest, rent, property taxes, insurance, and other fixed expenses based on time. Period costs are expensed on the income statement in the period in which they are incurred and not included in the cost of goods sold.
See overhead.
Period Order Quantity (POQ) – A simple lotsizing rule that defines the order quantity in terms of periods supply43; also known as the Periodic Order Quantity, days supply, weeks supply, and months supply.
The POQ is implemented in MRP systems by setting the lotsize to the sum of the next POQ periods of net requirements after the first positive net requirement. The optimal POQ is the Economic Order Quantity (EOQ) divided by the average demand per period. The POQ is ![]() days, where D is the expected annual demand, S is the ordering (or setup) cost, i is the carrying charge, and c is the unit cost.
days, where D is the expected annual demand, S is the ordering (or setup) cost, i is the carrying charge, and c is the unit cost.
See Economic Order Quantity (EOQ), lotsizing methods, periods supply, time-varying demand lotsizing problem.
periodic review system – An order-timing rule used for planning inventories; also known as a fixed-time period model, periodic system, fixed-order interval system, and P-model. ![]()
A periodic review system evaluates the inventory position every P time periods and considers placing an order. Unlike a reorder point system that triggers an order when the inventory position falls below the reorder point, a periodic review system only considers placing orders at the end of a predetermined time period, the review period (P). The graph below shows the periodic review system through two review periods.
The periodic review system makes good economic sense when the firm has economies of scale in transportation cost. In other words, the periodic review system should be used when the firm can save money by shipping or receiving many different items at the same time. The optimal review period is the perod order quantity (POQ), which is EOQ/μD, where EOQ is the economic order quantity and μD is the average demand per period. However, in most situations, the review period is determined by other factors, such as the transportation schedule.
The periodic review system can be implemented with either a fixed order quantity, such as the EOQ, or with an order-up-to lotsizing rule. The order-up-to rule is also known as a base stock system. This rule orders a quantity that brings the inventory position up to a target inventory at the end of each review period. The target inventory level is also called the base stock level. The optimal target inventory is T = SS + μD(L + P), where μD is the average demand per period, L is the replenishment leadtime, and P is the review period. The safety stock is ![]() units, where σD is the standard deviation of demand per period and z is the safety factor. The average lotsize is
units, where σD is the standard deviation of demand per period and z is the safety factor. The average lotsize is ![]() , and the average inventory is
, and the average inventory is ![]() . Compared to the reorder point system, the periodic system requires more safety stock inventory, because it must protect against stockouts during the review period plus the replenishment leadtime (L + P) rather than just during the replenishment leadtime (L).
. Compared to the reorder point system, the periodic system requires more safety stock inventory, because it must protect against stockouts during the review period plus the replenishment leadtime (L + P) rather than just during the replenishment leadtime (L).

Most retail chains use a periodic review system to replenish their stores. Each store has a target inventory level (base stock level) for each stock keeping unit (SKU). Every week the stores order enough to bring their inventory positions up to the base stock level, and trucks move the orders from regional warehouses to the stores.
See continuous review system, inventory management, min-max inventory system, order-up-to level, perpetual inventory system, reorder point, safety stock, slow moving inventory, supermarket, warehouse.
periods supply – The “time quantity” for an inventory; also known as days on hand (DOH), days supply, days of inventory, days in inventory (DII), inventory days, inventory period, coverage period, weeks supply, and months supply. ![]()
The periods supply44 is the expected time remaining before the current inventory goes to zero, assuming that the current average demand rate does not change. The periods supply metric is often preferable to the inventory turnover metric, because it is easier to understand and can easily be related to procurement and manufacturing leadtimes.
Periods supply is estimated by taking the current inventory and dividing by some estimate of the current (or future) average demand. The current average demand might be a simple moving average, an exponentially smoothed average, or an exponentially smoothed average with trend. For example, a professor has 100 pounds of candy in his office and is consuming 20 pounds per day. Therefore, the professor has five-days supply.
The periods supply metric and the inventory turnover metric measure essentially the same inventory performance. However, periods supply is based on the current average or forecasted demand, and inventory turnover is based on historical actual demand or cost of goods sold over a specified time period. If demand is relatively stable, one can easily be estimated from the other. The relationships between inventory turnover (T) and days on hand are T = 365/DOH and DOH = 365/T. Inventory Dollar Days (IDD) is the unit cost times DOH.
The days supply for work-in-process (WIP) inventory can also be used as an estimate of the cycle time. For example, a firm with 10-days supply of WIP inventory has a cycle time of about 10 days. This concept is based on Little’s Law (Little 1961), which states that the average inventory is the demand rate times the cycle time. Written in queuing theory terms, this is L = λW, where L is the number in system (the work-in-process), λ is the mean arrival rate (the demand rate), and W is the time in system (the cycle time). Note that when days supply is calculated from financial measures, this estimate of the average cycle time is a dollar-weighted average.
See cycle time, Inventory Dollar Days (IDD), inventory management, inventory turnover, Little’s Law, lot-for-lot, lotsize, Period Order Quantity (POQ), weighted average.
Perishable Asset Resource Management (PARM) – See yield management.
permutations – See combinations.
perpetual inventory system – An inventory control system that keeps accurate inventory records at all times.
In a perpetual inventory system, records and balances are updated with every receipt, withdrawal, and inventory balance correction. These systems often provide real-time visibility of inventory position (inventory on-hand and inventory on-order). In contrast, an inventory system could update inventory records periodically. However, with modern computers it makes little sense to use a periodic updating system.
See on-hand inventory, on-order inventory, periodic review system, real-time.
personal operations management – A philosophy and set of practices for applying operations management principles to help individuals (particularly knowledge workers) become more productive.
The term “personal operations management” was coined in by the author (Hill, 2011a). The book adapts and applies lean principles to personal time and life management.
See 6Ps, delegation, Getting Things Done (GTD), knowledge worker, parking lot, SMART goals, time burglar, two-minute rule, two-second rule, tyranny of the urgent.
PERT – See Project Evaluation and Review Technique.
phantom – See phantom bill of material.
phantom bill of material – A bill of material coding and structuring technique used primarily for transient (non-stocked) subassemblies; phantom items are called blow-through (or blowthrough) or transient items.
A phantom bill of material represents an item that is physically built but rarely stocked before being used in the next level in the bill of material. Materials Requirements Planning (MRP) systems do not create planned orders for phantom items and are said to “blow through” phantom items.
See bill of material (BOM), Materials Requirements Planning (MRP), part number.
phase review – A step in the new product development process where approval is required to proceed to the next step; also called stage-gate review and tollgate review.
See the stage-gate process entry for more detail.
See DMAIC, New Product Development (NPD), stage-gate process.
phase-in/phase-out planning – A planning process that seeks to coordinate the introduction of a new product with the discontinuation of an existing product.
New products typically offer updated features and benefits that make the current product obsolete. The phase-in of the new product and the phase-out of the current product is complicated by many factors, such as forecasting the demand for both products, planning the consumption and disposal of the inventory of the current product, filling the distribution channel with the new product, giving proper incentives to the sales force for both the current and new products, coordinating end-of-life policies for all related products and consumables, carefully designing a pricing strategy that maximizes contribution to profit, and last, but not least, creating an effective market communication program. With respect to market communications, some firms have found themselves in trouble when information about a new product becomes public and the market demand for the current product to decline rapidly.
For example, the demand for the Apple iPad 2 will decline rapidly once the Apple iPad 3 is announced. Hill and Sawaya (2004) discuss phase-in/phase-out planning in the context of the medical device industry.
See product life cycle management.
physical inventory – The process of auditing inventory balances by counting all physical inventory on-hand.
A physical inventory is usually done annually or quarterly and usually requires that all manufacturing operations be stopped. Cycle counting is better than the physical inventory count, because it (1) counts important items more often, (2) fixes the record-keeping process rather than just fixing the counts, and (3) maintains record accuracy during the year.
See cycle counting.
pick face – The storage area immediately accessible to the order picker.
pick list – A warehouse term for an instruction to retrieve items from storage; also called a picking list.
A pick list gives stock pickers the information they need to pick the right items, in the right quantities, from the right locations, in the right sequence (route). These items may be for a specific production order, sales order, or interplant order, or, alternatively, they may be for a group of orders. If the pick list is for a group of orders, the orders need to be consolidated (assembled) from the items that are picked.
See backflushing, picking, warehouse.
picking – The process of collecting items from storage locations to meet the requirements of an order. ![]()
Warehouses usually have more outgoing shipments (customer orders) than incoming shipments (purchase orders). This is particularly true for warehouses that serve retailers, because these warehouses are often used to break out large orders from a few manufacturers into small orders sent to many retailers. The picking process, therefore, has a significant impact on overall supply chain efficiency. Mispicks (errors in picking) directly impact customers and customer satisfaction.
The ideal picking system will have low purchase and implementation cost, low operating cost, low cycle time per pick, and high accuracy. The efficiency of the picking system is highly dependent upon the warehouse system and policies for locating SKUs in the warehouse.
The type of picking process depends on many factors, such as product characteristics (weight, volume, dimensions, fragility, perishability), number of transactions, number of orders, picks per order, quantity per pick, picks per SKU, total number of SKUs, shipping requirements (piece pick, case pick, or full-pallet loads), and value-added services, such as private labeling, cutting, or packaging. A pick to clear rule selects item locations with the smallest quantities first to empty the bins more quickly. A pick to light system uses LED lights for each bin and uses these lights to guide the picker to the next bin to be picked.
Picking is closely connected to the slotting policies, which are the rules used to guide employees to a bin (or bins) when putting materials away. All Warehouse Management Systems (WMS) provide functionality for both slotting and picking rules.
Voice picking (voice recognition) uses speech recognition and speech synthesis technologies to allow workers to communicate with the WMS. Warehouse workers use wireless, wearable computers with headsets and microphones to receive instructions by voice and verbally confirm their actions back to the system. The wearable computer, or voice terminal, communicates with the WMS via a radio frequency local area network (LAN). Directed RF picking uses radio frequency technologies to transmit picking, put away, replenishment, and cycle count instructions to warehouse personnel using either handheld or truck-mounted devices.
See batch picking, carousel, discrete order picking, first pick ratio, flow rack, forward pick area, pick face, pick list, private label, random storage location, reserve storage area, slotting, task interleaving, voice picking, warehouse, Warehouse Management System (WMS), wave picking, zone picking.
picking list – See pick list.
piece work – Pay for performance based on the number of units produced rather than on the number of hours worked or a salary; also called piece rate.
See gainsharing, pay for skill.
pilot test – A method used to test new software or a production process before it is fully implemented; for information systems, a pilot test is also called a conference room pilot.
In the software context, the purpose of the pilot test may be to (1) evaluate for purchase, (2) evaluate for implementation, (3) evaluate if the database and settings in the software are ready for implementation, and (4) train users how to use the software. Ideally, the pilot test is conducted with actual data by actual decision makers in conditions as close as possible to actual operating conditions. The pilot uses realistic test data, but the system is not “live,” which means that no data are changed and no decisions are made that affect actual operations. In a manufacturing context, a pilot run is done to test the capabilities of the system before ramping up production.
See beta test, implementation, prototype.
pipeline inventory – The number of units (or dollars) of inventory currently being moved from one location to another.
See supply chain management, Work-in-Process (WIP) inventory.
pitch – The time allowed to make one container of a product.
Pitch is used to check if actual production is keeping up with takt time requirements. Pitch is a multiple of takt time based on the container size. For example, if the container size is 60 units and the takt time is 10 seconds, pitch is 60 × 10 = 600 seconds (or 10 minutes) for each container. Pitch can also be expressed as a rate. For example, if pitch (as a time) is 10 minutes per container, pitch (as a rate) is 6 containers per hour.
See cycle time, lean thinking, takt time.
Plan-Do-Check-Act – See PDCA.
Plan-Do-Study-Act – See PDCA.
planned leadtime – See cycle time, leadtime.
planned obsolescence – A strategy of designing products to become obsolete or non-functional after a period of time; also known as built-in obsolescence.
Firms sometimes use planned obsolescence to motivate customers to buy replacement products. Obsolescence of desirability refers to a marketing strategy of trying to make the previous model appear to be obsolete from a psychological standpoint (e.g., automobile style and other fashion goods). Obsolescence of function refers to a strategy of making the product cease to be functional after some period of time or number of uses (e.g., products with built-in, non-replaceable batteries).
See New Product Development (NPD), product life cycle management.
planned order – An MRP term for a recommended purchase order or manufacturing order generated by the planning system.
MRP systems create planned orders to meet the net requirements for higher-level products, assemblies, and subassemblies. Planned orders are deleted and replaced by new planned orders every time MRP recalculates the materials plan. When planners convert a planned order to a firm planned order, it can no longer be changed by the MRP system. Capacity Requirements Planning (CRP) uses planned orders, firm planned orders, and open (released) orders to determine the requirements (load) on each workcenter for each day.
See Capacity Requirements Planning (CRP), manufacturing order, Materials Requirements Planning (MRP), purchase order (PO), time fence.
planning bill of material – See bill of material (BOM).
planning horizon – The span of time that the master schedule extends into the future.
In a manufacturing context, the planning horizon for the master production schedule should extend beyond the cumulative (stacked) leadtime for all components.
See cumulative leadtime, time fence.
planning versus forecasting – See forecasting demand.
planogram – A diagram used to specify how products are to be displayed in a retail space; also called plano-gram, plan-o-gram, and POG.
A good planogram allows inexperienced employees to properly maintain the retail shelf stock and appearance. A good planogram system will help the retailer (1) control inventory investment, (2) maximize inventory turnover, (3) minimize labor cost, (4) satisfy customers, (5) maximize sales, (6) maximize profit, and (7) maximize return on investment for the space.
See assortment, category captain, facility layout.
plant stock – An SAP term for on-hand inventory in a particular plant location.
plant-within-a-plant – A relatively autonomous process (“a plant”) located within a facility that allows for more focus and accountability; sometimes called a focused factory.
Each plant-within-a-plant (or focused factory) will likely have unique operations objectives (cost, quality, delivery, etc.) and unique workforce policies, production control methods, accounting systems, etc. This concept was promoted by Professor Wickham Skinner at Harvard Business School in a famous article on the focused factory (Skinner 1974). See the focused factory entry for more details.
See facility layout, focused factory, operations strategy.
platform strategy – A new product development strategy that plans new products around a small number of basic product designs (platforms) and allows for many final products with differing features, functions, and prices.
A platform strategy is commonly used in the automotive industry, where the platform is a chassis/drive-train combination upon which different models are built (e.g., Chevrolet, Buick, Cadillac). This concept is used in many other industries, such as personal computers (e.g., Dell), white goods (e.g., Whirlpool), and medical devices (e.g., Medtronic).
See New Product Development (NPD), white goods.
point of use – The lean manufacturing practice of storing materials, tools, and supplies in a manufacturing facility close to where they are needed in the manufacturing process.
Point of use reduces non-value-added walking and searching time.
See 5S, dock-to-stock, receiving, water spider.
PMI – See Project Management Institute (PMI).
PO – See purchase order.
Point-of-Sale (POS) – A data collection device located where products are sold; usually a scanning and cash register device in a retail store.
POS data collection provides a rich source of data that can be used to (1) provide real-time sales information for the entire supply chain, (2) help maintain accurate inventory records, (3) automatically trigger replenishment orders as required, (4) provide data for detailed sales analysis, and (5) provide in-store information to shoppers.
See category captain, real-time, Universal Product Code (UPC).
Poisson distribution – A discrete probability distribution useful for modeling demand when the average demand is low; also used for modeling the number of arrivals to a system in a fixed time period.
Like the exponential distribution, the Poisson distribution only has one parameter. Unlike the exponential, the Poisson is a discrete distribution, which means that it is only defined for integer values. The mean of the Poisson distribution is λ (lambda), and the variance is equal to the mean. The probability mass function p(x) is the probability of x and is only defined for integer values of x.
Parameter: The Poisson has only one parameter (λ), which is the mean.
Probability mass and distribution functions:

Partial expectation function: The partial expectation for the Poisson distribution is ![]() for x
for x ![]() 1 (Hadley & Whitin 1963). This is a useful tool for inventory models.
1 (Hadley & Whitin 1963). This is a useful tool for inventory models.
Statistics: Range non-negative integers {0, 1, ... }, mean λ (note that λ need not be an integer), variance λ, mode λ − 1 and λ if λ is an integer and ![]() λ
λ![]() otherwise, where the
otherwise, where the ![]() x
x![]() rounds down to the nearest integer. Median ≈
rounds down to the nearest integer. Median ≈![]() λ + 1/3−0.02/λ
λ + 1/3−0.02/λ![]() . Coefficient of variation
. Coefficient of variation ![]() . Skewness
. Skewness ![]() . Kurtosis
. Kurtosis ![]() .
.
Graph: The graph below shows the Poisson probability mass function with mean λ = 3.
Excel: The Excel function for the Poisson probability mass function is POISSON(x,λ, FALSE). The Microsoft Excel function for the cumulative Poisson distribution is POISSON(x,λ, TRUE), which returns the probability that the random variable will be less than or equal to x given that the mean of the Poisson distribution is λ. Excel does not provide an inverse Poisson distribution function.

Excel simulation: In an Excel simulation, it is necessary to use Excel formulas or a VBA function to generate Poisson distributed random variates, because Excel does not have an inverse function for the Poisson distribution. Law and Kelton (2000) presented a simple and fast algorithm, which is implemented in the VBA code below. Law and Kelton (2000) also noted that the inverse transform method with a simple search procedure can also perform well. Given that the Poisson distribution is typically used only for distributions with a low mean (e.g., λ < 9), a simple search procedure is reasonably fast.
Relationships to other distributions: The Poisson and exponential distributions are unique in that they have only one parameter. If the number of arrivals in a given time interval [0,t] follows the Poisson distribution, with mean λt, the interarrival times follow the exponential distribution with mean 1/λ. (See the queuing theory entry.) If X1, X2, ..., Xm are independent Poisson distributed random variables with mean λi, then X1 + X2 + ... + Xm is Poisson distributed with mean λ1 + λ2 + ... + λm. The Poisson distribution is a good approximation of the binomial distribution when n ![]() 20 and p
20 and p ![]() 0.05 and an excellent approximation when n
0.05 and an excellent approximation when n ![]() 100 and np
100 and np ![]() 10. For large values of λ (e.g., λ > 1000), the normal distribution with mean λ and variance λ is an excellent approximation to the Poisson. The normal distribution is a good approximation for the Poisson when λ
10. For large values of λ (e.g., λ > 1000), the normal distribution with mean λ and variance λ is an excellent approximation to the Poisson. The normal distribution is a good approximation for the Poisson when λ ![]() 10 if the continuity correction is used (i.e., replace P(x) with P(x + 0.5)). Haley and Whitin (1963) presented several pages of equations related to the Poisson distribution that are useful for inventory models.
10 if the continuity correction is used (i.e., replace P(x) with P(x + 0.5)). Haley and Whitin (1963) presented several pages of equations related to the Poisson distribution that are useful for inventory models.
History: The French mathematician Siméon Denis Poisson (1781-1840) introduced this distribution.
See bathtub curve, binomial distribution, c-chart, dollar unit sampling, exponential distribution, hypergeometric distribution, negative binomial distribution, newsvendor model, np-chart, probability distribution, probability mass function, queuing theory, slow moving inventory, u-chart.
poka-yoke – See error proofing.
POLCA (Paired-cell Overlapping Loops of Cards with Authorization) – A hybrid push/pull production control system for low-volume manufacturing developed by Professor Rajan Suri at the University of Wisconsin.
Suri and Krishnamurthy (2003, p. 1) describe POLCA as follows: “It is a hybrid push-pull system that combines the best features of card-based pull (Kanban) systems and push (MRP) systems. At the same time, POLCA gets around the limitations of pull systems in high-variety or custom product environments, as well as the drawbacks of standard MRP, which often results in long lead times and high WIP.”
See CONWIP, Drum-Buffer-Rope (DBR), kanban.
Pollaczek-Khintchine formula – A relatively simple queuing formula that relates the standard deviation of the service time to the mean number of customers in queue for a single server queuing system.
The formula itself can be found in the queuing theory entry.
See queuing theory.
POMS – See Production Operations Management Society.
pooling – A practice of combining servers to reduce customer waiting time or combining inventory stocking locations to reduce inventory.
Operations managers often have to decide if it is better to have separate channels (each with its own queue) or to combine them into one queue (waiting line). Similarly, operations managers often have to decide if it is better to hold inventory in separate stocking locations or to combine them into a single stocking location. This is called the pooling problem. An queuing example is used here to explore the benefits of pooling.
A firm has two technical experts, with one on the East Coast and one on the West Coast. Customers on the West Coast are only allowed to call the West Coast expert; and the same is true for the East Coast. The average interarrival time45 for customers calling the technical experts is a = 0.4 hours on both coasts. The average service time for the two identical experts is p = 0.3 hours. The utilization for each expert is ρ = p / a = 0.3/0.4 = 75%. (Be careful to not confuse ρ and p.) The coefficient of variation for the interarrival time is 1, and the coefficient of variation for the service time is also 1 (e.g., ca = 1 and cs = 1). Each expert is analyzed separately, which means that the number of servers is s = 1. Using the approximate G/G/s model (see the queuing theory entry), the average queue time is:
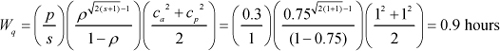
Therefore, customers will have to wait about 0.9 hours on average for each expert.
If the organization were to combine the two lines to form just one line for the experts, it would “pool” the systems and have only one line. In this case, the interarrival time for the combined system is half that of the separate systems (i.e., a = 0.2 hours), but the average service time remains the same (p = 0.3 hours). Again, using the approximate G/G/s model but with s = 2 servers, the average queue time for this system is:
Therefore, customers in the “pooled” system have to wait about 0.4 hours on average. In this case, pooling reduced the average waiting time by about one-half (from 0.9 hours to 0.4 hours), a very significant difference.
Why is the pooled system so much better? The answer is that in the old system, one expert could be idle while the other had customers waiting in line. In other words, the pooled system makes better use of the experts.
The benefits of pooling are often significant. The main point here is not the queuing model, but rather the fact that many systems can often be improved by pooling resources. Pooled systems can often make better use of resources, reduce the waiting time for customers, and reduce the risk of long waiting times.
Examples of this pooling concept can be found in many contexts:
• The dean of a business school centralized all tech support people for the school into one office instead of having one assigned to each department. The pooled resource provided faster and better support.
• Delta Airlines shares parts with other airlines in Singapore. This reduces the risk of any airline not having a needed part and reduces the required investment.
• Xcel Energy shares expensive power generator parts with many other firms in the Midwestern U.S.
• A large service firm reduced average waiting time by consolidating its call centers in one location.
Pooling also has disadvantages. When a service firm consolidates its call centers, some local customers might not experience service that is culturally sensitive, particularly if the call center is moved to another country. Also, large call centers can experience diseconomies of scale. Putting all operations in one location can be risky from a business continuity standpoint, because a disaster might put the entire business at risk. Finally, in a queuing context, if the mean service times for the customer populations are very different from one another, the pooled coefficient of variation of the pooled service time will increase and the average time in queue will also increase (Van Dijk & Van Der Sluis 2007).
See addition principle, call center, consolidation, diseconomy of scale, postponement, queuing theory, slow moving inventory.
POQ – See Period Order Quantity.
portal – See corporate portal.
Porter’s Five Forces – See five forces analysis.
POS – See Point-of-Sale.
post-mortem review – See post-project review.
post-project review – The practice of appraising a project after it has been completed to promote learning for (1) the members of the project team, (2) the sponsoring organization, and (3) the wider organization; also called post-mortem review, project retrospective, and post-implementation audit.
Organizations should seek to learn from their successes and failures. Organizations that do not do this are doomed to repeat their mistakes over and over again. This is a critical activity for successful project management. Gene Heupel of GMHeupel Associates recommends that process improvement project teams conduct three activities at the end of a project: (1) create a project completion notice, (2) conduct a post-project review, and (3) create a project closing report. Each of these is discussed briefly below.
The project completion notice is serves several purposes, including (1) verifying that the deliverables in the project charter have been completed, (2) defining the plan to sustain the implementation, and (3) releasing the team and establishing the end-of-project activities. Heupel recommends that the project team have the project sponsor sign this document.
The post-project review is a comprehensive review conducted by the project team to ensure that the team and the organization have learned as much as they can from the project. Lessons learned from this review are documented in the project closing report. It is important to remember that the purpose of this review is not to blame people, but rather to help the organization learn from the project experience so that going forward it will retain the good practices and improve the poor ones.
The project closing report contains all of the significant documents related to the project as well as lessons learned from the post-project review. This report becomes an important part of the organization’s knowledge base going forward. The project is not complete until the sponsor has signed off on the project closing report.
In many contexts, the post-project review might also (1) assess the level of user satisfaction, (2) evaluate the degree to which the stated goals were accomplished, and (3) list further actions required.
See deliverables, forming-storming-norming-performing model, implementation, lean sigma, learning organization, project charter, project management, sponsor.
postponement – The principle of delaying differentiation (customization) for a product as long as possible to minimize complexity and inventory; also called delayed differentiation, late customization, and late configuration. ![]()
Forecasting the demand for standard products is relatively easy, and the inventory carrying cost for these products is relatively low. However, forecasting demand for products differentiated for a particular channel or customer is much harder, and the carrying cost is often high due to obsolescence. Firms will likely have too much inventory for some differentiated products and too little for others. If a firm can delay the differentiation of the products until after the customer order has been received, the finished goods inventory is eliminated. Postponement is a form of pooling, where the organization pools the inventory as long as possible before the customer order requires differentiation.
Postponement is a foundational principle for mass customization. Postponement principles often allow an organization to change from make to order to assemble to order or configure to order, which allows the firm to reduce customer leadtime or increase customization. The point at which products are customized for customers is called the push-pull boundary.
For example, HP was able to standardize its printers and put all country-specific power management technology in the cord. This allowed for lower inventory and better customer service.
See agile manufacturing, customer leadtime, mass customization, New Product Development (NPD), operations strategy, pooling, push-pull boundary, respond to order (RTO), standard products.
predatory pricing – The practice of selling a product or service at a very low price (even below cost) to drive competitors out of the market and create barriers to entry for potential new competitors.
After a company has driven its competitors out of the market, it can recoup its losses by charging higher prices in a monopoly relationship with its customers. Predatory pricing is against the law in many countries.
See antitrust laws, bid rigging, bribery, price fixing.
predictive maintenance – See maintenance.
premium freight – Additional charges paid to a transportation provider to expedite shipments.
Premium freight can be used for bringing purchased materials into a facility and delivering products to customers. Premium freight is used when the normal freight method cannot provide needed materials in time for a production schedule. An increase in premium freight for purchased materials suggests that the firm should consider freezing more of the master production schedule (i.e., move out the time fence).
Similarly, premium freight is used when the normal freight method cannot deliver finished goods to customers by the promised delivery dates. An increase in premium freight for delivering products to customers suggests that the firm may be over-promising on its delivery dates to its customers.
See logistics, time fence.
prevention – Work to design and improve products and processes so defects are avoided.
Prevention cost is the cost associated with this work and includes product design, process design, work selection, worker training, and many other costs. The cost of quality suggests that investing in prevention will generally reduce appraisal (inspection) cost, internal failure cost, and external failure cost. However, many firms find that prevention cost is the hardest component of the cost of quality to measure.
See cost of quality, error proofing, Failure Mode and Effects Analysis (FMEA), rework, sentinel event.
preventive maintenance – See maintenance.
price elasticity of demand – See elasticity.
price fixing – Agreement between competitors to set an agreed-upon minimum price.
Price fixing inhibits competition and therefore forces customers to pay more than they would in a competitive environment. Price fixing is an illegal practice in many countries.
See antitrust laws, bid rigging, bribery, predatory pricing, purchasing.
price of non-conformance – See cost of quality.
primacy effect – A concept from psychology and sociology that suggests that people assign disproportionate importance to initial stimuli or observations.
For example, if a subject reads a long list of words, he or she is more likely to remember words read toward the beginning of the list than words read in the middle. The phenomenon is due to the fact that short-term memory at the beginning of a sequence of events is far less “crowded,” because fewer items are being processed in the brain.
The recency effect is a similar concept from psychology and sociology that suggests that people assign disproportionate importance to final stimuli or observations.
In summary, the primacy and recency effects predict that people will remember the items near the beginning and the end of the list. Lawyers scheduling the appearance of witnesses for court testimony and managers scheduling a list of speakers at a conference take advantage of these effects when they put speakers they wish to emphasize at the beginning or end. In measuring customer satisfaction, it is well-known that customers place undo emphasis on their first and most recent customer experiences (“moments of truth”).
See moments of truth, service quality.
primary location – See random storage location.
Principal Component Analysis (PCA) – A statistical tool that transforms a number of possibly correlated variables into a smaller number of uncorrelated variables called principal components.
The first principal component accounts for as much of the variability in the data as possible, and each subsequent component accounts for as much of the remaining variability as possible.
See cluster analysis, factor analysis.
print on demand – A customer interface strategy of printing books, manuals, and other materials in response to a customer order rather than creating an inventory; also called POD, publish on demand, and print to order.
Print on demand requires a printing process that can efficiently handle small printing batch sizes. Print on demand is a mass customization strategy made possible by computer-based printing technologies. Ideally, print on demand has nearly zero setup time, setup cost, finished goods inventory, and obsolete inventory.
See mass customization, respond to order (RTO).
print to order – See print on demand.
prisoners’ dilemma – A conflict situation (“game”) in which two players can decide to either cooperate or cheat.
The prisoner’s dilemma is a classic scenario in the game theory literature that received its name from the following hypothetical situation (Axelrod 1984). Imagine two criminals, A and B, arrested under suspicion of having committed a crime together. However, the police do not have sufficient proof to convict them. The police separate the prisoners and offer each of them the same deal. If one testifies for the prosecution against the other and the other remains silent, the betrayer goes free, and the silent accomplice receives the full 10-year sentence. If both stay silent, both prisoners are sentenced to only six months in jail for a minor charge due to lack of evidence. If each betrays the other, each receives a two-year sentence. Each prisoner must make the choice of whether to betray the other or remain silent. However, neither prisoner knows what choice the other prisoner will make. The game is summarized in the following table.
Prisoner’s dilemma
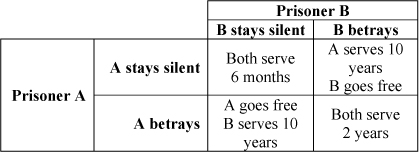
The gain for mutual cooperation in the prisoners’ dilemma is kept smaller than the gain for one-sided betrayal so that players are always tempted to betray. This economic relationship does not always hold. For example, two wolves working together can kill an animal that is more than twice as large as what either of them could kill alone.
The prisoners’ dilemma is meant to study short-term decision making where the actors do not have any specific expectations about future interactions or collaborations (e.g., in the original situation of the jailed criminals). Synergy usually only gets its full power after a long-term process of mutual cooperation, such as wolves hunting deer. If two entities repeatedly face a prisoners’ dilemma with each other, a fairly good strategy for each one is sometimes called tit for tat, which means that if you cheated on the previous move, I’ll cheat on this move; if you cooperated on the previous move, I’ll cooperate on this move.
See game theory, zero sum game.
private carrier – A shipper that transports its goods in truck fleets that it owns or leases.
See common carrier, logistics.
private label – A product or service created by one organization but sold by another organization under the seller’s brand name.
The most common example is when a large retailer (e.g., Target) contracts with a manufacturer to make a generic version of its product sold under the Target brand. Private label is a common practice in consumer packed goods and white goods.
See category captain, category management, consumer packaged goods, Original Equipment Manufacturer (OEM), picking, white goods.
privatization – The process of moving from a government owned and controlled organization to a privately owned and controlled for-profit organization; spelled privatisation in most of the world outside of the U.S.
pro bono – To work for the public good without charging a fee; short for the Latin pro bono publico, which means “for the public good.”
When lawyers, consultants, and other professionals work “pro bono,” they work without charging a fee. Some organizations provide pro bono services, but then prominently mention the gift in their marketing communications. Technically, this is gratis (free of charge) rather than pro bono, because it is part of the organization’s advertising, promotion, and branding strategy and not truly intended only for the public good.
probability density function – A statistics term for a function that represents the probability for a continuous random variable as the area under the curve; usually written as f (x); also called the density function and PDF. ![]()
Only continuous random variables have probability density functions. Discrete random variables have a probability mass function, which defines the probability for each discrete (integer) value (e.g., p(x) = P(X = x)).
The integral of the PDF for the entire range of a continuous random variable is one (![]() ).
).
The Cumulative Distribution Function (also called the CDF or simply the distribution function) is the lower tail (left tail) cumulative probability (i.e., the integral of the PDF) and is the probability that a random variable is less than the specified value. This can be expressed mathematically as  , where X is a continuous random variable, x is a specific value, and f(x) is the density function evaluated at x. The probability that a random variable is in the range [a, b] is
  . The reliability function is simply one minus the CDF. The PDF is the derivative of the cumulative distribution function (i.e., dF(x)/dx = f(x)).
See beta distribution, chi-square distribution, Erlang distribution, exponential distribution, gamma distribution, lognormal distribution, normal distribution, partial expectation, probability distribution, probability mass function, random variable, reliability, sampling distribution, Student’s t distribution, triangular distribution, uniform distribution, Weibull distribution.
probability distribution – A mathematical or graphical description of how likely a random variable will be less than or equal to a particular value. ![]()
Random variables are said to be either discrete (i.e., only integer values) or continuous (i.e., any real values). Discrete random variables have a probability mass function that defines the probability for each discrete (integer) value. Continuous random variables have a Probability Density Function (PDF), where the probability is represented by the area under the curve. The Cumulative Distribution Function (CDF) evaluated at x is the probability that the random variable will attain a value less than or equal to x.
See Bernoulli distribution, beta distribution, bimodal distribution, binomial distribution, chi-square distribution, Erlang distribution, exponential distribution, gamma distribution, hypergeometric distribution, lognormal distribution, negative binomial distribution, normal distribution, Poisson distribution, probability density function, probability mass function, random variable, sampling distribution, Student’s t distribution, triangular distribution, uniform distribution, Weibull distribution.
probability mass function – A probability theory term for an equation that can be used to express the probability that a discrete random variable will be exactly equal to a given value; usually denoted as p(x).
A discrete random variable can only take on integer values. In contrast, a probability density function is used for continuous variables.
The probability mass is p(x) = P(X = x). A probability mass function must sum to one (i.e., ![]() ).
).
See Bernoulli distribution, bimodal distribution, binomial distribution, hypergeometric distribution, negative binomial distribution, Poisson distribution, probability density function, probability distribution, sampling distribution.
Probit Analysis – See logistic regression.
process – A set of steps designed to achieve a particular goal. ![]()
All processes have inputs and outputs. Ideally, processes will also have a feedback mechanism that evaluates the outputs and adjusts the inputs and the processes to better achieve the desired goal.
As mentioned in the preface to this book, this author uses the following framework to discuss process improvement:
• Better – How can we provide customers improved product quality, service quality, and value?
• Faster – How can we reduce cycle times to make our products and services more flexible and customizable?
• Cheaper – How can we reduce waste, lower cost, and better balance demand and capacity in a global supply chain?
• Stronger – How can we leverage our competitive strengths (core competences), mitigate risks by making processes more robust, and consider the triple bottom line (people, planet, and profits)?
Process improvement programs, such as lean sigma and lean, typically use tools, such as process mapping, error proofing, and setup time reduction methods, to reduce waste and add more value.
See error proofing, lean sigma, lean thinking, process map, robust, setup time reduction methods, systems thinking.
process capability and performance – A lean sigma methodology that measures the ability of a process to consistently meet quality specifications. ![]()
Process capability and performance can be measured in many ways. The simplest approach is to measure the Defects per Million Opportunities (DPMO), where a defect is anything that does not meet the customer (or specification) requirements. A DPMO value can be translated into a sigma level, where the lower the DPMO, the higher the sigma level. (See the sigma level entry.)
Another approach is to use the statistical measures Cp and Cpk for measuring process capability and Pp and Ppk for measuring process performance. Process capability compares the process output for an “in-control” process with the customer’s specification (tolerance limits) to determine if the common-cause variation is small enough to satisfy customer requirements.
The figure on the right shows a process with a process mean that is not centered between the lower tolerance limit (LTL) and the upper tolerance limit (UTL). Note that the mean μ is right of the center of the tolerance limits. Therefore, this process is not centered. This figure also shows that the process limits for common-cause variation (±3σ) are well within the specification (tolerance) limits. Therefore, this process is said to be capable.

One humorous way to communicate this concept is to compare the specification limits to the width of a garage. The common-cause variation (the process width) is the size of a car that must fit into the garage. The specification width is the size of the garage. If the garage is large (wide specification limits) and the car is small (tight process limits), the car will fit into the garage with no problem. However, if the garage is narrow and the car is large, the car will hit the sides of the garage (defects will be produced).
Several of the main process capability concepts are defined in more detail below.
Process Capability (Cp) – Process capability is the difference between the tolerance (specification) limits divided by the process width. In mathematical terms, this is Cp = (UTL − LTL)/(6σ), where UTL is the Upper Tolerance Limit and LTL is the Lower Tolerance Limit. Cp should be at least 1.33 for the process to be considered capable. (This is a defect rate of 0.0063%.) The standard deviation for Cp can be estimated with moving range, range, or sigma control charts. The inverse of process capability is called the process capability ratio (Cr) and should be no greater than 75% for the process to be considered capable.
Process Capability Index (Cpk) – The process capability index (Cpk) measures the ability of a process to create units within specification limits. Cpk is the difference between the process mean and the closest specification limit over the standard deviation times three. The Cpk adjusts Cp for a non-centered distribution and therefore is preferred over Cp. For example, in target shooting, if shots hit the bottom right corner of the target and form a tight group, the process has a high Cp but a low Cpk. When the sight is adjusted so this tight group is centered on the bull’s eye, the process also has a high Cpk. Cpk is the smaller of the capability of the upper half and the lower half of the process. In mathematical terms, Cpu = (UTL − μ)/(3σ), Cpl = (μ − LTL)/(3σ), and Cpk = min(Cpl, Cpu). When the Cpk is less than one, the process is said to be incapable. When the Cpk is greater than or equal to one, the process is considered capable of producing a product within specification limits. The Cpk for a six sigma process is 2. The process capability index (Cpk) can never be greater than the process capability (Cp). They will be equal when the process average is exactly in the middle of the specification limits.
Process Performance (Pp) – Process performance is similar to Cp, except it is based on the sample standard deviation. The inverse of process performance is called the process performance ratio (Pr).
Process Performance Index (Ppk) – The process performance index is similar to Cpk except it is based on the sample standard deviation. Process performance is based on the sample standard deviation, whereas process capability is based on the long-term “common-cause” standard deviation determined from the moving range, range, or sigma control charts. Process performance, therefore, is the actual short-term performance of a system, whereas process capability is the system’s long-term potential to perform when under control. The difference between the two is the potential for improvement. The table below compares these two metrics.

See business capability, common cause variation, control chart, cost of quality, Defects per Million Opportunities (DPMO), Design for Six Sigma (DFSS), functional build, lean sigma, operations performance metrics, Overall Equipment Effectiveness (OEE), process validation, sigma level, specification limits, Statistical Process Control (SPC), Statistical Quality Control (SQC), tolerance, yield.
process control – See Statistical Process Control (SPC).
process design – The activities required to create a new manufacturing or service process. ![]()
Process design includes facility location, facility layout, process planning, capacity planning, ergonomics, and work design. Process design should be simultaneous with product design and guided by the organization’s strategy. One key component of process design is to error-proof the process.
See capacity, ergonomics, error proofing, facility layout, facility location, New Product Development (NPD), service blueprinting.
process flowchart – See process map.
process improvement program – A systematic approach for improving organizational performance that consists of practices, tools, techniques, and terminology and implemented as a set of process improvement projects. ![]()
Many process improvement program concepts are presented in this book. The best-known programs are lean sigma and lean. In recent years, nearly all six sigma programs have been renamed “lean sigma.”
See benchmarking, Business Process Management (BPM), Business Process Re-engineering (BPR), error proofing, lean sigma, lean thinking, program management office, project hopper, project management, standardized work, Theory of Constraints (TOC), voice of the customer (VOC).
process layout – See facility layout.
process map – A diagram showing the logical flow of steps required for a task; also called a flowchart, process flowchart, and business process map. ![]()
The “as-is” process map shows how the process currently operates. The “should-be” process map shows the team’s recommendations for how the process should operate in the future.
Guidelines for creating process maps – The following is a list of best practices for process mapping developed by this author.
• Engage the gemba to create the process map.
• Use Post-it Notes to brainstorm the steps.
• Use rectangles for process steps.
• Use diamonds for decision steps.
• Use ovals or rounded rectangles to start and end processes.
• Do not bother with more sophisticated shapes.
• Draw the map from left to right.
• Do not bother with complicated standards for how the arrows connect to the boxes.
• Be careful to have the right scope.
• Show all the flows.
• Start with the “as-is” before creating the “should-be” process map.
• Listen to the voice of the customer.
• Identify the pain points.
• Identify the handoffs.
• Identify the waits.
• Identify the setup (changeover) steps.
• Identify the “as-is” and “should-be” control points for monitoring the process.
• Identify the bottleneck.
• Identify the risk points (fail points).
• Identify the non-value-added steps.
• Identify the rework loops.
• Identify the moments of truth.
• Identify roles and responsibilities for the major steps in the process.
• Identify the line of visibility.
• Show the numbers.
• Use a hierarchical approach.
• Use normal-sized paper.
• Identify and prioritize opportunities for improvement.
Software tools for process mapping – Many software tools are available for process mapping. Although the most popular tool appears to be Microsoft Visio, Microsoft Excel can create process maps that are just as good. Simple process maps can also be created in Microsoft Word and Microsoft PowerPoint.
Getting the benefits of a value stream map with a process map – Although a value stream map is more visual than a process map, a process map is better than a value stream map from the standpoint of information value. A process map allows for decision points, but a value stream map does not. A value stream map requires a diagram of the physical system, which works well in a factory, but is difficult in a knowledge work process. This is particularly important for transactional processes in banks and other information-intensive organizations with many decision points. Therefore, nearly all the information in a value stream map can be included in a process map. To make the process map more visual, it is possible to add photos, drawings, and icons.
See benchmarking, brainstorming, Business Process Management (BPM), causal map, facility layout, flowchart, handoff, lean sigma, mindmap, process, rework, service blueprinting, seven tools of quality, SIPOC Diagram, standardized work, upstream, value stream map.
process performance qualification – See process validation.
process validation – A term used by the Food and Drug Administration (FDA) in the U.S. for establishing documented evidence that a process will consistently produce a product meeting specifications.
Process validation is a requirement of the Current Good Manufacturing Practices Regulations for Finished Pharmaceuticals and the Good Manufacturing Practice Regulations for Medical Devices. The following terms are important elements of process validation (source: www.fda.gov, April 19, 2011):
Installation Qualification (IQ) – Establishing confidence that process equipment and ancillary systems are capable of consistently operating within established limits and tolerances.
Process performance qualification – Establishing confidence that the process is effective and reproducible.
Product performance qualification – Establishing confidence through appropriate testing that the finished product has been produced according to the specified process and meets all requirements.
Prospective validation – Validation conducted prior to the distribution of a new product or a product made under a revised manufacturing process, where the revisions may affect the product’s characteristics.
Retrospective validation – Validation of a process for a product already in distribution based upon accumulated production, testing, and control data.
Validation – Establishing documented evidence that provides a high degree of assurance that a specific process will consistently produce a product that meets pre-determined specifications and quality attributes.
Validation protocol – A written plan stating how validation will be conducted, including test parameters, product characteristics, production equipment, and decision points on what constitutes acceptable test results.
Worst case – A set of conditions encompassing upper and lower processing limits and circumstances, including those within standard operating procedures, which pose the greatest chance of process or product failure when compared to ideal conditions. Such conditions do not necessarily induce product or process failure.
See Good Manufacturing Practices (GMP), process capability and performance, quality assurance, Statistical Process Control (SPC), Statistical Quality Control (SQC).
procurement – See purchasing.
producer’s risk – The probability of rejecting a lot that should have been accepted.
The producer suffers when a lot with an acceptable quality level (AQL) is rejected. This is called a Type I error. The Greek letter α (alpha) is used for Type I risk with typical α values in range (0.2, 0.01).
See Acceptable Quality Level (AQL), acceptance sampling, consumer’s risk, operating characteristic curve, quality management, sampling, Type I and II errors.
Product Data Management (PDM) – The business function and associated software that creates, publishes, and manages detailed product information.
PDM manages all information related to a product and the components that go into a product. The data include current and historical specifications, the engineering change history (version control), the item master, bill of material (BOM), and routing databases.
The best PDM systems are Web-based collaborative applications for product development that allow enterprises to share business processes and product data with dispersed divisions, partners, and customers. PDM systems hold master data in a single secure vault where data integrity can be assured and all changes are monitored, controlled, and recorded (i.e., version control). Duplicate reference copies of the master data, on the other hand, can be distributed freely to users in various departments for design, analysis, and approval. The new data are then released back into the vault. When the database is changed, a modified copy of the data, signed and dated, is stored in the vault alongside the old data.
See knowledge management, New Product Development (NPD), product life cycle management, version control.
product design quality – The degree to which the product design meets customer requirements; also called design quality and performance quality. ![]()
Product design quality is the output of a team of knowledge workers in marketing, product design, quality assurance, operations, and sourcing, possibly with the help of suppliers. This design is stored and communicated in drawings (CAD files) and specifications.
For example, the marketing and R&D people in a firm decide that a watch should be designed to survive 100 meters under water based on focus groups with customers and salesforce feedback. This design is better than a watch designed to only survive 10 meters under water.
Although the product design standards might be high (e.g., survive 100m under water), it is possible that the manufacturing process is flawed and that products regularly fail to meet the standard (e.g., only survive 10m under water). In summary, product design (performance) quality is how well the design specifications meet customer requirements, and conformance quality is how well the actual product meets the design specifications.
See conformance quality, quality management, warranty.
product family – A group of items with similar characteristics; also called family or part family.
Product families can be created from many different points of view, including selling, sales planning, production planning, engineering, forecasting, capacity planning, financial planning, and factory layout. Product families may meet a common set of customer requirements (e.g., a product family sold to one market segment), may have similar manufacturing requirements (e.g., all items within a family require the same sequence of manufacturing steps), or may have similar product technologies or components (e.g., all use digital electronics).
See bill of material (BOM), cellular manufacturing, part number, Resource Requirements Planning (RRP), Sales & Operations Planning (S&OP), sequence-dependent setup time, setup cost, value stream.
product layout – See facility layout.
product life cycle management – Managing a product through its entire life, from concept to design, development, commercialization, manufacturing, and finally, phase out.
Many firms struggle with the early and late phases of the product life cycle. During the start-up phase, the difficulties include forecasting (see the Bass Model entry) and commercialization. In the later phases, many firms fail to clearly state their end-of-life policies regarding when they will stop selling or supporting products.
As products mature and reach technical obsolescence, an end-of-life policy can help both the manufacturer and its customers. The manufacturer cannot afford to support products and technologies indefinitely. The end-of-life policy sets boundaries and manages expectations about the supply and support guidelines for a product. Many manufacturers provide support and replacement parts for up to five years after the date of sale, even for products that are removed from the market. For some critical products, the manufacturer takes the initiative to notify customers months in advance of the products’ scheduled end-of-life.
Good product life cycle management is supported by a good product profitability analysis, which is based on Activity Based Costing (ABC). This analysis can help balance the conflicting interests of manufacturing (that wants to eliminate obsolete products early) and sales (that wants to keep a full catalog of products).
Some of the key product life cycle events that need to be managed include:
• End of Production – The date that a product is no longer produced or shipped by a manufacturer.
• End of Life – The date that a product is no longer marketed or sold.
• End of Support – The last date that a product will be supported. Some customers might negotiate an extension for this date.
Some firms use a termination date policy for products and components. A product and its unique components46 are no longer sold or supported after the termination date. The advantages of having a termination date policy include:
• Provides a clear plan for every functional area that deals with products (manufacturing, purchasing, inventory, service, engineering, and marketing) and supports an orderly, coordinated phase-out.
• Communicates to the salesforce and market that the product will no longer be supported (or at least no longer sold) after the termination date. This can provide incentive for customers to upgrade to a newer product.
• Allows manufacturing and inventory planners to bring down the inventories for all unique components needed for the product in a coordinated way.
Good implementation practices of a termination date policy include the following policies:
• Helps the organization plan many years ahead to warn all stakeholders, including marketing, sales, product management, purchasing, and manufacturing.
• Makes sure that all functions (and divisions) have “buy-in” to the termination date.
See adoption curve, all-time demand, all-time order, Bass Model, bathtub curve, phase-in/phase-out planning, planned obsolescence, Product Data Management (PDM), stakeholder, technology road map, termination date, time to market, value engineering, version control.
product mix – The variety of products that a firm offers to the market; also called product assortment.
Product mix usually refers to the length (the number of products in the product line), breadth (the number of product lines that a company offers), depth (the different varieties of products in the product line), and consistency (the relationship between products in their final destination) of product lines. Product mix is a strategic decision based on the industry, the firm’s desired position in the market, and the firm’s ability to offer more variety without adding cost (mass customization). By definition, specialty or niche firms have a limited product mix.
See linear programming (LP), mass customization, product proliferation.
product mix problem – See linear programming (LP).
product performance qualification – See process validation.
product proliferation – The marketing practice of adding new products, product variants, and product extensions to the market; also called stock keeping unit (SKU) proliferation.
Product proliferation occurs when marketing and sales organizations offer new product variations through different color combinations, sizes, features, packaging, languages, regions, etc. Product line extensions can bring both benefits and problems.
Benefits of product line extensions include:
• Meet the ever-changing customer needs.
• Increase sales and capture larger market share.
• Help firms explore new products and markets. Hamel and Prahalad (1991) argue for the use of “expeditionary marketing” to test new markets because of the difficulties of conducting marketing research.
• Create a barrier to entry for competitors.
Problems of product line extensions (and product proliferation) include:
• Products competing with one another in the same market.
• Consumer confusion about the products.
• Cannibalization of the existing product line of the company.
• Higher complexity, which increases costs and makes service more difficult throughout the product life cycle.
The marketing, sales, and R&D organizations are responsible for identifying new products and are held accountable for growing sales each year. However, as Mariotti (2008) points out, no organization within a firm is responsible for balancing the drive to increase (proliferate) the number of SKUs. His book argues persuasively that product proliferation leads to complexity that has significant hidden costs.
Product rationalization is the process of evaluating which products should be kept in a product portfolio. Product rationalization is based on several factors, such as sales, margin, product life cycle, support for complementary products, and similarity of product attributes. As mentioned above, it tends to be a difficult process in many firms because of goal misalignment between the sales and marketing organizations, which want a broad product line to satisfy a wide variety of customers and win new ones, and the manufacturing and supply chain organizations, which want to reduce cost, complexity, and inventory.
See Activity Based Costing (ABC), assortment, focused factory, market share, mass customization, product mix, standard products.
product rationalization – See product proliferation.
product simplification – See value engineering.
product structure – See bill of material (BOM).
production activity control – See shop floor control.
production function – A microeconomics concept that defines the relationship between an organization’s inputs and outputs.
The production function is a mathematical model that indicates what outputs can be obtained from various amounts and combinations of factor inputs. In its most general mathematical form, a production function is expressed as Q = f(x1, x2, ... , xn), where Q is the quantity of output and (x1, x2, ... , xn) are the factor inputs, such as capital, labor, raw materials, land, technology, and management.
The production function can be specified in a number of ways, including an additive (linear) function Q = a + b1x1 + b2x2 + ... + bnxn or a multiplicative (Cobb-Douglas) production function ![]() . Other forms include the “constant elasticity of substitution” production function (CES), which is a generalized form of the Cobb-Douglas function, and the quadratic production function, which is a specific type of additive function. The best form of the equation and the best values of the parameters depend on the firm and industry.
. Other forms include the “constant elasticity of substitution” production function (CES), which is a generalized form of the Cobb-Douglas function, and the quadratic production function, which is a specific type of additive function. The best form of the equation and the best values of the parameters depend on the firm and industry.
See Data Envelopment Analysis (DEA), economics.
production line – A manufacturing term for a sequence of workstations or machines that make a product (or family of products); most often used in a high-volume, repetitive manufacturing environment where the machines (workcenters) are connected by conveyers.
Levitt (1972) wrote an HBR article entitled the “Production-line approach to service” that used McDonald’s as an example to support his argument that services should be managed more like factories with respect to standardization, technology, systems, and metrics.
See assembly line, manufacturing processes, service management.
production linearity – See heijunka.
Production Operations Management Society (POMS) – An international professional society representing the interests of production and operations management professionals from around the world.
The purposes of the society are to (1) extend and integrate knowledge that contributes to the improved understanding and practice of production and operations management (POM), (2) disseminate information on POM to managers, scientists, educators, students, public and private organizations, national and local governments, and the general public, and (3) promote the improvement of POM and its teaching in public and private manufacturing and service organizations throughout the world.
Professor Kalyan Singhal founded POMS on June 30, 1989, in collaboration with about three hundred professors and executives. The society held its first international meeting in Washington, D.C. in October 1990. The first issue of the POMS journal Production and Operations Management was published in March 1992.
The POMS website is www.poms.org.
See operations management (OM).
production order – See manufacturing order.
production plan – See production planning.
production planning – The process of creating a high-level production plan, usually in monthly time buckets for families of items, and often measured in a high-level common unit of measure, such as units, gallons, pounds, or shop hours; called aggregate planning or aggregate production planning in the academic literature. ![]()
In academic circles, the result of the aggregate production planning process is called the aggregate plan, whereas in many practitioner circles (including APICS) it is known simply as the production plan. Aggregate planning is particularly difficult for firms with seasonal demand for their products. Firms such as Polaris (a manufacturer of snowmobiles and ATVs) and Toro (a manufacturer of snow blowers and lawnmowers) have to build inventory in the off season in anticipation of seasonal demand.
Production planning is just one step in the Sales & Operations Planning (S&OP) process. S&OP is a broader and higher-level business process that includes sales, marketing, finance, and operations and that oversees the creation of the business plan, the sales plan, and the production plan. (See the Sales & Operations Planning (S&OP) entry for more information on this topic.)
Whereas the business plan is usually defined in dollars (profit, revenue, and cost), the production plan is usually defined by units or some other aggregate output (or input) measure, such as shop hours worked, gallons produced, crude oil started, etc. An aggregate measure is particularly useful when the production plan includes many dissimilar products.
The goal is to meet customer demand at the lowest cost. Relevant costs for production planning decisions include inventory carrying costs, capacity change costs (hiring, training, firing, facility expansion or contraction, equipment expansion or reduction), and possibly the opportunity costs of lost sales.
The linear programming formulation for the aggregate production planning problem has been in the operations management and operations research literature since the 1960s. It assumes that the demand is known with certainty over the T-period planning horizon. The problem is to find the optimal production plan, workforce plan, and inventory plan to meet the demand at the lowest cost. Mathematical statement of the problem is below.
The aggregate production planning problem
Minimize ![]()
Subject to It = It−1 + Pt − Dt, for t = 1, 2, ... , T
OTt ![]() 1.5Wt, for t = 1, 2, ... , T
1.5Wt, for t = 1, 2, ... , T
Pt = r(Wt + OTt), for t = 1, 2, ... , T
Wt = Wt−1 + Ht − Ft, for t = 1, 2, ... , T
where,
T Number of periods in the planning horizon.
t Period index, t = 1, 2, ... , T.
cH Cost of hiring one worker.
Ht Number of workers hired in period t.
cF Cost of firing one worker.
Ft Number of workers fired in period t.
cOT Cost of using one full-time equivalent worker to work overtime for one period.
OTt Number of workers working over time in period t, expressed in full-time equivalents. (The constraint above assumes that overtime is limited to 1.5 times regular time.)
cW Cost of employing one worker for one period.
Wt Number of workers employed in period t.
cC Cost of carrying one unit for one period.
It Inventory (in units) at the end of period t.
Pt The production rate in period t. This is the number of units produced in period t.
Dt Number of units demanded in period t.
R Number of units produced by one worker per period.
The objective function is to minimize the sum of the hiring, firing, overtime, regular time, and carrying costs. The first constraint is the inventory balancing equation, which requires the new inventory at the end of period t to be equal to the old inventory plus what is produced minus what is sold. The second constraint defines the number of units produced in period t as a function of the number of workers working in that period. The third constraint limits overtime labor hours to 1.5 times the regular time labor hours. Finally, the fourth constraint defines the number of regular time workers as the old number plus the number hired less the number fired.
Although the model has been around for a long time, very few firms have found it useful. The basic model requires the assumption that demand is known with certainty, which is usually far from reality. The model also requires the estimation of a number of cost parameters, such as the firing cost, hiring cost, and carrying cost, which are often hard to estimate. Finally, the linear programming modeling approach does not seem to fit well with the organizational dynamics that surround such difficult decisions as firing employees or building inventory.
See aggregate inventory management, anticipation inventory, Business Requirements Planning (BRP), carrying charge, carrying cost, chase strategy, flexibility, hockey stick effect, level strategy, linear programming (LP), Master Production Schedule (MPS), Materials Requirements Planning (MRP), Resource Requirements Planning (RRP), Rough Cut Capacity Planning (RCCP), Sales & Operations Planning (S&OP), seasonality, time bucket, unit of measure.
production smoothing – See heijunka.
productivity – A measure of the value produced by a system for a given level of inputs. ![]()
Productivity is normally defined and measured as the ratio of an output measure divided by an input measure (e.g., hamburgers created per hour). It is a measure of how well a country, industry, business unit, person, or machine is using its resources. Productivity for a firm can be compared to another firm or to itself over time.
Total factor productivity is measured in monetary units. Partial factor productivity is measured in individual inputs or monetary units. For example, labor productivity could be measured as units per labor hour. Partial factor productivity can be misleading because a decline in the productivity of one input may be due to an increase in the productivity of another input. For example, a firm might improve labor productivity by outsourcing production, but find that the overall cost per unit is up due to the high cost of managing the outsourcing partner.
Whereas total factor productivity is total output divided by total input, partial factor productivity can be defined as output/labor hour, output/capital, output/materials, output/energy, etc. Multi-factor productivity is defined as output/(labor + capital + energy), output/(labor + materials), etc.
Many firms define and report productivity in terms of cost/unit, which is really the inverse of productivity. This is not output divided by input, but rather input (cost) divided by output (units). For example, a firm consumed 2400 hours of labor to process 560 insurance forms. What is the labor productivity? Answer: 2400/560 = 4.29 forms/hour. However, the firm prefers to express this in terms of hours per form (e.g., 0.23 hours/form) and dollars/form (e.g., $4.67/form).
The above definition of productivity is indistinquishable from the economics definition of efficiency. However, the industrial definition of efficiency is quite different from the above definition of productivity.
See Data Envelopment Analysis (DEA), earned hours, efficiency, High Performance Work Systems (HPWS), human resources, job design, operations performance metrics, Overall Equipment Effectiveness (OEE), Results-Only Work Environment (ROWE), utilization.
product-process matrix – A descriptive model that relates the production volume requirements to the type of production process. ![]()
The product-process matrix
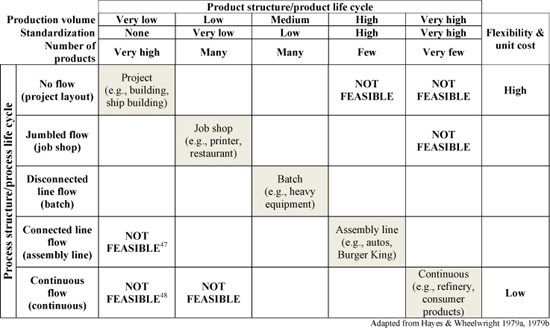
The product-process matrix was first introduced by Robert H. Hayes and Steven C. Wheelwright in two Harvard Business Review articles published in 1979 entitled “Link Manufacturing Process and Product Life Cycles” and “The Dynamics of Process-Product Life Cycles” (Hayes & Wheelwright 1979a, 1979b). The matrix consists of two dimensions, product structure/product life cycle and process structure/process life cycle. The process structure/process life cycle dimension describes the process choice (job shop, batch, assembly line, and continuous flow) and process structure (jumbled flow, disconnected line flow, connected line flow and continuous flow), while the product structure/product life cycle describes the four stages of the product life cycle (low to high volume) and product structure (low to high standardization).
Later writers have added an additional stage in the upper-left for the project layout. The product-process matrix is shown below with some examples along the main diagonal. Many authors argue that the ideal configuration is the main diagonal (the shaded boxes in the matrix) so that the product and process match. Others point out that mass customization and flexible manufacturing systems are strategies to move down the matrix while still offering product variety.
See facility layout, Flexible Manufacturing System (FMS), mass customization.
profit center – An accounting term for an area of responsibility held accountable for its contribution to profit.
Multi-divisional firms often hold each division responsible for its own profit. However, most public firms do not report profits for each profit center to external audiences.
See cost center, investment center, revenue center.
program – A set of projects that are coordinated to achieve certain organizational objectives.
A program is an on going activity with no set end date with a long-term goal, usually implemented with a series of many interrelated projects. Programs are often managed by a program management office (PMO) with a dedicated leadership team. An example of a program might be a process improvement program, such as lean sigma, or a large-scale construction project, such as a nuclear reactor that requires years to complete.
See program management office, project charter, project management.
program management office – An individual or group of people who are charged with overseeing a set of projects intended to achieve some overarching objective; often called a PMO. ![]()
One of the keys to success of process improvement programs, such as lean sigma, is managing the hopper of potential projects so the firm is carefully selecting the projects from a strategic point of view and matching them to resources (black belts and green belts) to develop the leadership capability in the firm. According to Englund, Graham, and Dinsmore (2003, p. xii), “The project office adds value to the organization by ensuring that projects are performed within procedures, are in line with organizational strategies, and are completed in a way that adds economic value to the organization.”
A research project by Zhang, Hill, Schroeder, and Linderman (2008) found two keys to success for any process improvement program: Strategic Project Selection (SPS) and Discipline Project Management (DPM). The research found a causal linkage from DPM to SPS to operating performance. SPS and DPM are both outcomes of a well-managed program management office.
Other related terms include project management office and project control (Englund, Graham, & Dinsmore 2003). Still other firms use the name of the program to name the office (e.g., lean sigma champion, lean promotion office, director of management information systems, etc.). These programs could be related to new product development projects, building projects, process improvement projects, or marketing research projects.
See champion, lean promotion office, lean sigma, lean thinking, process improvement program, program, project charter, project hopper, project management.
project – See project management.
project charter – A document that clearly defines the key attributes of a project, such as the purpose, scope, deliverables, and timeline; closely related to a statement of work (SoW). ![]()
The charter is essentially an informal contract between the project sponsor and the project leader and team. Like a good product design or building blueprint, a well-designed project charter provides a strong foundation for a successful project.
The following project charter format has been developed over the course of several years by Gene Heupel and Professor Arthur Hill. Mr. Heupel was the Director of Project Control at Xcel Energy for many years and is now the president of GMHeupel Associates, a consultancy that provides process improvement and project management services. This framework draws from his experience, a large number of company examples, and the Project Management Institute’s recommended format.
• Project name: Usually a short descriptive name.
• Project number: Often a budget number or project designator in the “portfolio” of projects.
• Problem: A clear and concise business case for the project. This statement should include enough background to motivate the project. (See the business case entry for detailed suggestions on how to write a business case.)
• Objectives: The targeted benefits (improvement) in cost, sales, errors, etc. This requires selection of the metrics to be used and the target values for these metrics. In some cases, the benefits may be hard to quantify (e.g., customer satisfaction); however, in general, it is best to define quantifiable objectives. Some firms require separate sections for “financial impact” and “customer impact.”
• Deliverables: A list of products to be delivered (e.g., improved procedures, NPV analysis, training, implementation plan) and how these will be delivered to the project sponsor (e.g., workshop, PowerPoint presentation, Excel workbook, or training).
• Scope: A clear statement of the project boundaries, including clear and deliberate identification of what is out of scope. Many experts break this section into “inclusions” and “exclusions.”
• Assumptions: Key beliefs about the problem (e.g., an assumption that the process improvement efforts will not require changes to the information systems).
• Schedule: A short list of the most important planned completion dates (milestones) for each of the main activities and deliverables in the project.
• Budget: The estimated labor hours and cost for key resources plus any other expenses.
• Risk mitigation: The barriers that might keep the project from being completely successful, including a statement about how these should be addressed. For example, a project might be at risk if one user group fails to embrace a new process. The mitigation for this might be to assign a key representative of this user group to the process design team and to provide training for all the users before the new process is implemented.
• Team: A list of the team members’ names and titles along with their roles (e.g., team leader, team member, team support person). Some organizations add planned utilization, start dates, and end dates. Subject matter experts (SMEs) should also be listed with an explanation of their roles (e.g., advising, reviewing, etc.). SMEs are not formal team members and therefore can be included without increasing the size of the team.
• Sponsor: The name of the project sponsor or sponsors. Sponsors should be included from every organization that is significantly impacted by the project.
• Approvals: Signatures from all project sponsors before the project is started. It is important to revise the charter and get new approvals whenever the scope is changed. In some situations, such as new product development, signoffs are required at the end of each phase of the project.
A statement of work (SoW) is a description of the business need, scope, and deliverables for a project. The SoW usually follows the project charter and provides more detail. However, some organizations use a SoW in place of a project charter. At a minimum, the SoW should include the business need, scope, and deliverables. However, some experts insist that the SoW also include acceptance criteria and schedule. Still others include all the details of the project charter, including executive summary, background, objectives, staffing, assumptions, risks, scope, deliverables, milestones, and signatures.
See A3 Report, business case, champion, change management, deliverables, implementation, lean sigma, lean thinking, New Product Development (NPD), post-project review, program, program management office, project management, RACI Matrix, scope creep, scoping, sponsor, stage-gate process, stakeholder, stakeholder analysis, Subject Matter Expert (SME).
Project Evaluation and Review Technique (PERT) – A project planning and scheduling method developed by the U.S. Navy for the Polaris submarine project.
In its original form, PERT required each task to have three task time estimates: the optimistic task time (a), the most likely task time (m), and the pessimistic task time (b) (Malcolm, Roseboom, Clark, & Fazar, 1959). The expected task time is then estimated as E(T) = (a + 4m + b)/6 and the task time variance as V(T) = (b − a)2/36. These equations were supposedly based on the beta distribution. Sasieni (1986) asserts that these equations have little scientific basis, but Littlefield and Randolph (1987) attempt to refute Sasieni’s assertions. In this author’s view, Sasieni was probably closer to the truth on this issue.
The expected critical path time is estimated by adding the expected times for the tasks along the critical path; similarly, the variance of the critical path time is estimated by adding the variances along the critical path. The earliest and latest project completion time are then estimated as the expected critical path time plus or minus z standard deviations of the critical path time.
This approach assumes that (1) the distribution of the project completion time is determined only by the critical path time (i.e., that no other path could become critical), (2) the project completion time is normally distributed, and (3) the equations for the mean and variance are correct. In reality, these assumptions are almost always incorrect. Few organizations find that the three-task time approach is worth the time, confusion, or cost.
See beta distribution, critical chain, Critical Path Method (CPM), project management, slack time, work breakdown structure (WBS).
project hopper – A simple tool that helps a process improvement program leader (champion) manage the set of current and potential projects.
The project hopper is a tool used to help store and prioritize potential process improvement projects. This is usually done with an Excel workbook. Ecolab and other firms prioritize potential projects based on two dimensions: (1) benefits (sales growth, cost reduction, improved service) and (2) effort (cost, resources, time to achieve benefits). Ecolab graphs each project on these two dimensions and uses that information as a visual tool to help managers prioritize potential projects49. Preliminary project charters are then written for the most promising projects, and then the benefit and cost assessment is performed one more time to select which projects to charter, resource, and initiate.
See lean sigma, process improvement program, program management office.
project management – The planning, organizing, scheduling, directing, and controlling of a one-time activity to meet stakeholder-defined goals and constraints on scope, schedule, and cost. ![]()
According to the Project Management Institute’s Project Management Body of Knowledge (PMBOK 1996, p. 167), “A project is a temporary endeavor undertaken to create a unique product or service.”
Key success factors for project management include conducting a careful stakeholder analysis, creating a clear project charter with well-defined roles and responsibilities (using the RACI Matrix), assigning a strong project leader, avoiding scope creep, and finally conducting a careful post-project review (also called a post-mortem review) so the organization learns from its project management mistakes and successes.
Well-managed projects also make proper trade-offs between the goals of time, cost, and scope (as illustrated by the project management triangle). The project management triangle emphasizes the point that all projects require trade-offs between scope (quality), cost, and time. See the project management triangle entry.
In most cases, the ideal project team will not have more than five or six members. If additional expertise is needed, Subject Matter Experts (SMEs) can assist the team, but need not be on the team. SMEs should be listed in the project charter. The project should have one or more clearly defined sponsors who have signed the charter.
This author has collected and adapted the following list of pessimistic project management “laws” (with a little humor) over many years. Of course, well-managed organizations do not have to be victims of these laws.
• Murphy’s Law: If it can go wrong, it will.
• Second Law of Thermodynamics (Law of Entropy): All systems tend toward their highest state of disorder. (Murphy’s Law is an application of this law.)
• Parkinson’s Law: Work expands to fill the time allotted to it. (Parkinson’s exact wording was “Work expands so as to fill the time available for its completion.”) This is only one of many laws found in his book (Parkinson 1958).
• The Pi Rule: Poorly managed projects take pi (π ≈ 3.1416.) times longer than originally planned. People tend to think that the path is across the diameter of the circle, when it is in fact the entire circumference.
• The optimistic time estimate law: Projects rarely do what was promised and are rarely completed on time, within budget, or with the same staff that started them. Corollary a: It is highly unlikely that your project will be the first exception. Corollary b: A carelessly planned project will take π ≈ 3.1416 times longer to complete than expected, and a carefully planned project will take only e ≈ 2.7183 times as long. Corollary c: When the project is going well, something will go wrong. Corollary d: When things cannot get any worse, they will. Corollary e: When things appear to be going better, you have overlooked something.
• The last 10 percent law: Projects progress rapidly until they are 90 percent complete. The last 10 percent takes about 50 percent of the time.
• Brooke’s Law: Adding people to a late project generally makes it later.
• The project employment law: A project requiring more than 18 months tends to lose its identity as a project and becomes a permanent part of the organization. Corollary: If the project objectives are allowed to change freely, the team might unintentionally turn the project into guaranteed long-term employment.
• The project charter law: A project without a clearly written charter will experience scope creep and will help stakeholders discover their organization’s worst political problems.
• The project correction law: The effort required to correct a project that is off course increases every day it is allowed to continue off course.
• The matrix organization law: Matrix organizations tend to be dysfunctional. All employees really have only one boss and that is the person who makes their next salary decision. (However, matrix organizations are essential in the modern firm, particularly for project management.)
• The project leader law: A great way to sabotage an important project is to assign whoever is completely available as the project leader.
• The technical leadership law: The greater the project’s scope and organizational complexity, the less likely a technician is needed to manage it. Corollary: Get the best project manager who can be found. A good project manager will find the right technical people for the project.
• The belief in the system law: If the user does not believe in the system, a parallel informal system will be developed, and neither will work very well.
• The post-project review law: Organizations that do not have a disciplined post-project review process are doomed to repeat their mistakes over and over again.
Project Management Institute’s Project Management Body of Knowledge (PMBOK) is the accepted standard for project management practices. Another source of project management knowledge is the Automotive Project Management Guide published by AIAG (Automotive Industry Action Group, www.aiag.org). AIAG publishes a set of books used by Ford, GM, and others for managing automotive projects and suppliers. Brown and Hyer (2009) wrote a good project management book entitled Managing Projects: A Team-Based Approach.
See 6Ps, change management, co-location, committee, co-opt, critical chain, critical path, Critical Path Method (CPM), cross-functional team, Design Structure Matrix (DSM), Earned Value Management (EVM), facility layout, finite scheduling, forming-storming-norming-performing model, Gantt Chart, groupware, infinite loading, issue log, just do it, load, load leveling, matrix organization, milestone, Murphy’s Law, New Product Development (NPD), Parkinson’s Laws, post-project review, process improvement program, program, program management office, project charter, Project Evaluation and Review Technique (PERT), Project Management Institute (PMI), project management triangle, project network, scope creep, scoping, slack time, sponsor, stage-gate process, stakeholder, stakeholder analysis, steering committee, Subject Matter Expert (SME), waterfall scheduling, work breakdown structure (WBS).
Project Management Institute (PMI) – The leading association for the project management profession.
Founded in 1969, PMI is one of the world’s largest professional membership associations, with a half million members and credential holders in more than 180 countries. It is a not-for-profit organization that advances the project management profession through globally recognized standards and certifications, collaborative communities, an extensive research program, and professional development opportunities. PMI’s Project Management Professional certification is the most widely recognized in the profession.
The latest version of PMI’s A Guide to the Project Management Body of Knowledge can be purchased from the PMI website (www.pmi.org).
See operations management (OM), project management.
project management office – See program management office.
project management triangle – A graphic used to emphasize that projects require trade-offs between time, cost, and scope and that the project sponsor can usually only control two of these; also called the project triangle and the triple constraint.

The graphic on the right shows the three goals of most projects – time, cost, and scope. Scope is sometimes replaced by quality or features.
One humorous way to use this tool is to fold a piece of paper into a triangle and hand it to the project sponsor or user. The sponsor will invariably take it with two hands and grasp two sides. The point is then made that the sponsor can control two sides, but the third side must be under control of the project team.
See project management, scope creep, sponsor.
project network – A database that shows the predecessor/successor relationships between the pairs of activities required to complete a project.
For the pair A → B, activity A is called the predecessor and B the successor. A predecessor activity usually needs to be completed before the successor can be started. However, four possible types of logical relationships are possible in most modern project management software packages:
• Finish-to-start – The “from” activity must finish before the “to” activity may start.
• Finish-to-finish – The “from” activity must finish before the “to” activity may finish.
• Start-to-start – The “from” activity must start before the “to” activity may start.
• Start-to-finish – The “from” activity must start before the “to” activity may finish.
See Critical Path Method (CPM), mindmap, project management, slack time.
project team – See project management.
promotion – (1) Marketing communications used in the marketplace (e.g., advertisements). (2) A temporary price reduction often accompanied by advertising.
Promotion is one of the four “P’s” of the marketing mix (product, price, place, and promotion). Everyday low pricing (EDLP) avoids price reductions and encourages customers to reduce forward buying and stabilize demand.
See forward buy.
prospective validation – See process validation.
prototype – In the product development context, an example built for evaluation purposes.
A prototype is a trial model used for evaluation purposes or a standard for subsequent units produced. Prototypes are often built quickly to help users evaluate features and capabilities. In the software development context, prototyping is particularly important for getting user input before the final design is implemented. Prototyping is closely related to the software development concept of agile design.
A beta test is the test of new software by a user under actual work conditions and is the final test before the software is released. In contrast, an alpha test is the first test conducted by the developer in test conditions.
See agile software development, beta test, breadboard, catchball, New Product Development (NPD), pilot test, scrum, sprint burndown chart.
pseudo bill of material – See bill of material (BOM).
public warehouse – See warehouse.
public-private partnership – A form of cooperation between government and private enterprise with the goal of providing a service to society through both private for-profit and not-for-profit organizations.
For example, PPL (http://www.pplindustries.org) is a public-private partnership in the city of Minneapolis, Minnesota, that has served Hennepin County for more than thirty years. The mission of PPL is to “work with lower-income individuals and families to achieve greater self-sufficiency through housing, employment training, support services, and education.” One of PPL’s main divisions is called “PPL Industries Disassembly and Reclamation,” which employs hundreds of ex-convicts to disassemble tens of thousands of electronic products, such as televisions, stereos, telephones, VCRs, and computers collected by Hennepin County each year. This service provides value to society by giving jobs and job training to just-released convicts, and it also helps protect the environment.
See triple bottom line.
Pugh Matrix – A decision tool that facilitates a disciplined, team-based process for concept generation, evaluation, and selection.
The Pugh Matrix is a scoring matrix that defines the important criteria for a decision, defines the weights for each criterion, defines the alternatives, and then scores each alternative. The selection is made based on the consolidated scores. The Pugh Matrix allows an organization to compare different concepts, create strong alternative concepts from weaker concepts, and arrive at the best concept, which may be a variant of other concepts. This tool is very similar to the Kepner-Tregoe Model.
Several concepts are evaluated according to their strengths and weaknesses against a reference concept called the datum (base concept), which is the best current concept at each iteration of the methodology. The Pugh Matrix encourages comparison of several different concepts against a base concept, creating stronger concepts and eliminating weaker ones until an optimal concept is finally reached.
See Analytic Hierarchy Process (AHP), decision tree, Design for Six Sigma (DFSS), force field analysis, Kano Analysis, Kepner-Tregoe Model, lean sigma, New Product Development (NPD), Quality Function Deployment (QFD), TRIZ, voice of the customer (VOC).
pull system – A system that determines how much to order and when to order in response to customer demand, where the customer may be either an internal or external customer. ![]()
All production and inventory control systems deal with two fundamental decision variables: (1) when to order, and (2) how much to order. It is easiest to understand “push” and “pull” systems for managing these two variables in a logistics context. Suppose, for example, a factory supplies two warehouses. With a push system, the people at the factory decide when and how much to ship to each of the two warehouses based on forecasted demand and inventory position information. With a pull system, the problem is disaggregated so the people at each warehouse decide when and how much to order from the factory based on their needs. Of course, the factory might not have the inventory, so some of these orders might not be filled.
The following table compares push and pull systems.
A comparison of push and pull systems
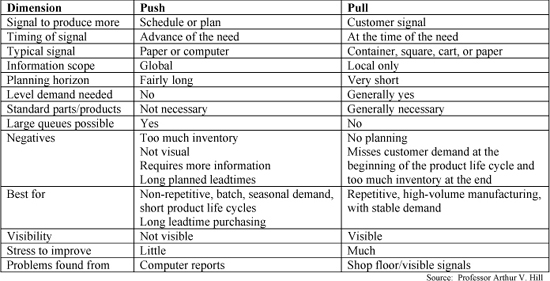
Hopp and Spearman (2004) provide a different perspective in their comparison of push and pull systems. They define a pull system as one that limits the amount of work in process that can be in the system and a push system as one that has no limit on the amount of work in process that can be in the system. They argue further that the definition of push and pull is largely independent of the make to order/make to stock decision.
See CONWIP, inventory management, kanban, lean thinking, push-pull boundary, repetitive manufacturing, standard parts, two-bin system, warehouse.
purchase order (PO) – A commercial document (or electronic communication) that requests materials or services; often abbreviated PO or P.O. ![]()
Purchase orders usually specify the quantity, price, and terms for the purchase. A purchase order may request many different items, with each item having a separate “line.”
See Accounts Receivable (A/R), blanket purchase order, buyer/planner, Electronic Data Interchange (EDI), interplant order, invoice, leadtime, lotsizing methods, manufacturing order, Materials Requirements Planning (MRP), planned order, purchasing, requisition, service level, supplier.
purchasing – The business function (department) responsible for selecting suppliers, negotiating contracts, and ensuring the reliable supply of materials; also known as procurement, supply management, supplier management, supplier development, strategic sourcing, and buying. ![]()
The goals of a purchasing organization are usually defined in terms of on-time delivery, quality, and cost. Some purchasing organizations, particularly in the larger firms, also get involved helping their suppliers improve their performance. The sourcing, supplier scorecard, and spend analysis entries have much more information on this topic.
Purchasing practices in the U.S. are constrained by a number of important laws. Bribery, kickbacks, price fixing, and GATT rules are important issues for purchasing managers. See the antitrust law and GATT entries for more details.
See Accounts Receivable (A/R), acquisition, antitrust laws, bill of lading, blanket purchase order, bribery, business process outsourcing, buy-back contract, buyer/planner, commodity, due diligence, Electronic Data Interchange (EDI), e-procurement, fixed price contract, forward buy, futures contract, General Agreement on Tariffs and Trade (GATT), Institute for Supply Management (ISM), inventory management, invoice, joint replenishment, leadtime, leverage the spend, logistics, Maintenance-Repair-Operations (MRO), materials management, Materials Requirements Planning (MRP), newsvendor model, outsourcing, price fixing, purchase order (PO), purchasing leadtime, reconciliation, Request for Proposal (RFP), requisition, reverse auction, right of first refusal, risk sharing contract, service level, single source, sourcing, spend analysis, supplier, supplier qualification and certification, supplier scorecard, supply chain management, tier 1 supplier, total cost of ownership, transfer price, vendor managed inventory (VMI).
purchasing leadtime – The time between the release and receipt of a purchase order from a supplier; also known as purchase leadtime and replenishment leadtime.
The purchasing leadtime parameter in a Materials Requirements Planning (MRP) system should be the planned purchasing leadtime, which should be set to the average actual value. Safety stock and safety leadtime is then used to handle variability in the demand during the replenishment leadtime.
See cycle time, leadtime, purchasing, safety leadtime, safety stock.
push system – See pull system.
pushback – Active or passive resistance to an idea or new way of doing things.
This term is often used in the context of organization change. For example, when consultants states that they are getting “pushback on a proposal,” it means the organization is resisting proposed changes.
See stakeholder analysis.
push-pull boundary – The point at which a supply chain (or firm) switches from building to forecast (push) to building to an actual customer order (pull); Hopp (2007) calls this the inventory/order (I/O) interface; Schroeder (2008) calls this the customization point; others call it the order penetration point, decoupling point, or customization process decoupling point. ![]()
The push-pull boundary is the point at which the customer order enters the system. For example, with an assemble to order (ATO) system, the point of entry is just before the final assembly. ATO systems, therefore, generally use a longer-term Master Production Schedule (MPS) to plan inventory for all major components, fasteners, etc., and a Final Assembly Schedule (FAS) to schedule the production of specific orders.
Moving the push-pull boundary to a point earlier in the process allows firms to be more responsive to customer demand and avoid mismatches in supply and demand. However, the customer leadtime will usually get longer. The push-pull boundary is closely related to postponement (postponed differentiation) and has strategic implications. See the postponement and Respond-to-Order entries for more detailed information.
One of the most successful examples of a firm moving the push-pull boundary for competitive advantage is Dell Computer, which assembles computers in response to customer orders. In contrast, many of Dell’s competitors (e.g., Compaq Computer) built to finished inventory, sometimes with disastrous business results. By moving from MTS to ATO, Dell was able to reduce finished goods inventory and provide a more customized product. However, more recently, computers have become more of a commodity, which means that customization is less important. In response, Dell is now building standard computer to stock (MTS) and selling them through Best Buy.
See cumulative leadtime, customer leadtime, Final Assembly Schedule (FAS), leadtime, make to order (MTO), make to stock (MTS), mass customization, Master Production Schedule (MPS), operations strategy, postponement, pull system, respond to order (RTO).
put away – See slotting.
Pythagorean Theorem – In any right triangle, the area of the square with side c (the hypotenuse) is equal to the sum of the areas of squares with sides a and b; the Pythagorean equation is c2 = a2 + b2.
See cluster analysis, Minkowski distance metric, numeric-analytic location model.
Q
QFD – See Quality Function Deployment.
QR – See Quick Response.
QRM – See Quick Response Manufacturing.
QS 9000 – A supplier development program developed by a Chrysler/Ford/General Motors supplier requirement task force.
The purpose of QS 9000 is to provide a common standard and a set of procedures for the suppliers of the three companies.
See quality management.
quadratic formula – A basic algebra approach for finding the roots of a second order polynomial of the form y = ax2 + bx + c = 0.
The quadratic formula is ![]() . For example, the roots (solution) of the equation y = x2 + 3x − 4 = 0 are x = -4 and 1, which means that the graph of the equation crosses the x-axis (i.e., when y = 0) at both x = -4 and x = 1.
. For example, the roots (solution) of the equation y = x2 + 3x − 4 = 0 are x = -4 and 1, which means that the graph of the equation crosses the x-axis (i.e., when y = 0) at both x = -4 and x = 1.
qualification – See supplier qualification and certification.
qualitative forecasting – See forecasting.
quality – See quality management.
quality assurance – The process of ensuring that products and services meet required standards.
Quality assurance is built on the following basic principles: (1) quality, safety, and effectiveness must be designed into the product, (2) quality cannot be inspected or tested into the product, (3) each step of the manufacturing process should be controlled to maximize the probability that the finished product meets all specifications, (4) humans tend to be unreliable at the inspection process, and (5) it is important to find the critical few points for inspection. Process validation is a key element in assuring that quality assurance goals are met.
See process validation, quality management, Statistical Process Control (SPC), Statistical Quality Control (SQC).
quality at the source – The quality management philosophy that workers should be responsible for their own work and should perform needed inspections before passing their work on to others.
Quality at the source is an application of the early detection of defects philosophy to ensure that every step of a process only passes along perfect conformance quality to the next step. The opposite of this philosophy is to try to “inspect quality in” at the end of the process.
People who do the work should be responsible for ensuring their own conformance quality. This concept is often called self check. Checking quality in a later step tends to encourage workers to be lazy and careless, because they know that someone else will be checking their work.
Similarly, suppliers should check their own work. A good supplier qualification and certification program can eliminate incoming inspection and reduce cost for both the supplier and the customer.
Similarly, data entry personnel should ensure that every number is entered properly. Data entry should not have to be inspected by someone else. One good way to achieve this goal is to have the computer system validate every data item to ensure that it has a reasonable range of values. Automated Data Collection (ADC) is very useful because machines are much more reliable than people for routine tasks.
See Automated Data Collection (ADC), conformance quality, early detection, inspection, quality management, supplier qualification and certification.
quality circles – A small group of volunteers who meet to identify, analyze, and improve their processes and workplace environment.
Typical discussion topics include safety, product design, and process improvement. Unlike many process improvement teams, quality circles remain intact over time. Quality circles were popular in the 1980s and early 1990s in North America, but then fell out of favor.
See brainstorming, quality management.
Quality Function Deployment (QFD) – A structured method for translating customer desires into the design specifications of a product; also known as “house of quality,” because the drawing often looks like a house. ![]()
QFD uses cross-functional teams from manufacturing, engineering, marketing, and sourcing. The process begins with market research and other voice of the customer (VOC) tools to define current and future customer needs and then categorize them into customer requirements. Requirements are then prioritized based on their importance to the customer. Conjoint analysis can help with this process. QFD then compares product and product attributes in the competitive marketplace with respect to competitor market positions and demographics.
The four phases of QFD are:
Phase 1. Product planning using QFD – (1) Define and prioritize customer needs, (2) analyze competitive opportunities, (3) plan a product to respond to needs and opportunities, and (4) establish critical characteristic target values.
Phase 2. Assembly/part deployment – (1) Identify critical parts and assemblies, (2) identify critical product characteristics, and (3) translate into critical part/assembly characteristics and target values.
Phase 3. Process planning – (1) Determine critical processes and process flow, (2) develop production equipment requirements, and (3) establish critical process parameters.
Phase 4. Process/quality control – (1) Determine part and processes characteristics, (2) establish process control methods and parameters, and (3) establish inspection and test methods and parameters.
See affinity diagram, concurrent engineering, conjoint analysis, cross-functional team, New Product Development (NPD), Pugh Matrix, quality management, voice of the customer (VOC).
quality management – The discipline that focuses on measuring and improving product and service performance and conformance to specifications. ![]()
Quality is somewhat difficult to define. The standard textbook definitions include fitness for use, conformance to customer requirements, and conformance to specifications. Many sources begin with Garvin’s eight dimensions of product quality (Garvin 1987):
• Performance – Measurable primary operating characteristics. Examples: Auto acceleration, TV reception.
• Features – Attributes available. Examples: Free drinks on airplanes, automatic tuners on a TV.
• Reliability – Probability that a product will malfunction within a given time period. Often measured by the Mean Time Between Failure (MTBF).
• Conformance – Degree to which a product meets established standards. Example: Many of the Japanese cars imported to the U.S. in the 1970s were good in conformance but not in durability.
• Durability – Measure of product life (until replacement)50.
• Serviceability – Speed, courtesy, competence, and ease of repair. Measured by mean response time and Mean Time to Repair (MTTR).
• Aesthetics – Appeal of the product’s look, feel, sound, taste, or smell based on personal judgment.
• Perceived quality – Reputation, indirect method of comparing products. Example: Sony (San Diego, California) and Honda (Marysville, Ohio) are reluctant to tell customers their products are made in the U.S.
The cost of quality is an important framework for understanding quality (Feigenbaum 1983). This concept is summarized briefly below. (See the cost of quality entry for more detail.)
• Prevention costs – Costs associated with designing products to be more robust (using design for manufacturing tools) and with preventing process problems from occurring (through error proofing).
• Appraisal costs – Costs related to inspection and testing.
• Internal failure costs – Costs associated with scrap (wasted materials), rework, repair, wasted capacity, and the opportunity cost of lost sales.
• External failure costs – Costs associated with lawsuits, returns, lost customer goodwill, complaint handling, and customer recovery, including the net present value of all future lost profit due to quality problems.
Another major concept in quality is the difference between conformance quality and design quality (also called performance quality). Conformance quality is simply the percentage of products that meet the product specifications and can be measured as a yield rate, first-pass yield, etc. In contrast, product design quality has to do with the design specifications. It is possible for a simple cheap product to have perfect conformance quality, but low design quality. Conversely, it is possible for a product to have a superior design (in terms of features and intended performance), but have poor conformance quality.
Quality control can be broken into two types: Process control, which asks “Is this process performing normally?” and lot control (acceptance sampling), which asks “Is this lot (batch) acceptable?”
Inspection can be done by variables (using tools, such as the x-bar or r-chart) or by attributes (using tools, such as the p-chart or the c-chart). Inspection by variables is usually for process control; inspection by attributes is usually for lot control.
Basic quality principles include:
• Do not try to inspect quality into a product.
• Strive for quality at the source.
• Inspect before the bottleneck. (Take care of “golden parts” that have gone through the bottleneck.)
• Most defects are the result of management error.
• Human inspectors rarely detect more than 50-60% of defects.
• Processes have many sources of uncontrollable variation (common causes), but special (assignable) causes of variation can be recognized and controlled.
Quality management and service quality management are major themes in this encyclopedia.
See Acceptable Quality Level (AQL), acceptance sampling, American Society for Quality (ASQ), attribute, causal map, common cause variation, conformance quality, consumer’s risk, control chart, cost of quality, Critical to Quality (CTQ), defect, Defects per Million Opportunities (DPMO), Deming’s 14 points, Design for Reliability (DFR), Design for Six Sigma (DFSS), durability, error proofing, Good Manufacturing Practices (GMP), goodwill, incoming inspection, inspection, ISO 14001, ISO 9001:2008, lean sigma, Lot Tolerance Percent Defective (LTPD), Malcolm Baldrige National Quality Award (MBNQA), operating characteristic curve, PDCA (Plan-Do-Check-Act), producer’s risk, product design quality, QS 9000, quality assurance, quality at the source, quality circles, Quality Function Deployment (QFD), quality trilogy, reliability, service quality, seven tools of quality, special cause variation, stakeholder analysis, Statistical Process Control (SPC), Statistical Quality Control (SQC), supplier qualification and certification, tampering, Total Quality Management (TQM), TS 16949 quality standard, voice of the customer (VOC), yield, zero defects.
quality trilogy – A concept promoted by Joseph Juran and the Juran Institute stating that quality consists of three basic quality-oriented processes: quality planning, quality control, and quality improvement.
Juran (1986) expanded on these three processes using the following guidelines:
Quality planning
Quality control
Quality improvement
See lean sigma, quality management, Total Quality Management (TQM).
quantitative forecasting methods – See forecasting.
quantity discount – A pricing mechanism that offers customers a lower price per unit when they buy more units.
Sellers often offer a lower price to customers when customers order in larger quantities. The difference between the normal price and the reduced price is called a price discount. Two policies are common in practice: the incremental units discount and the all-units discount.
The incremental units discount policy gives the customer a lower price only on units ordered above a breakpoint. For example, if a seller has a price breakpoint at 100 units and a customer orders 120 units, the price for the first 100 units is $10 and the price for the last 20 units is $9, for a total price of $1180.
In contrast, the all-units discount policy offers a lower price on all units ordered. For example, if a seller has a price breakpoint at 100 units and a customer orders 120 units, the price for all 120 units is lowered from $10 to $9, for a total price of $1080. With both policies, the optimal (minimum total cost) order quantity will always be at one of the price breakpoints (where the price changes) or at a feasible EOQ.
See blanket purchase order, bullwhip effect, carrying cost, commonality, Economic Order Quantity (EOQ), less than truck load (LTL), risk sharing contract.
quantity flexible contracts – See risk sharing contracts.
queue – See waiting line.
queue time – See wait time.
queuing theory – A branch of mathematics that deals with understanding systems with customers (orders, calls, etc.) arriving and being served by one or more servers; also known as queueing theory51, waiting line theory, and stochastic processes. ![]()
Managers and engineers often need to make important decisions about how much capacity to have, how many lines to have, and where to invest in process improvement. Intuition around these decisions is often wrong, and computer simulation is often too expensive to be of practical value. Queuing theory can give managers:
• A powerful language for describing systems with waiting lines (queues).

• Practical managerial insights that are critical to understanding many types of operations.
• Computationally fast analytical tools that can be implemented in Excel and used to help managers and engineers answer a wide variety of important “what-if” questions. For example, queuing models can help answer questions such as, “What would happen to our average waiting time if we added a server?”
Nearly all queuing theory models assume that the mean service rate and the mean arrival rate do not change over time. These models then evaluate the steady state (long-term) system performance with statistics, such as utilization, mean time in queue, mean time in system, mean number in queue, and mean number in system. Unfortunately, queuing models are often limited by the required assumptions that the mean arrival rate and mean service rate do not change over time; therefore, most queuing models are only approximations of the real world.
Customers arriving to the system can be people, orders, phone calls, ambulances, etc. The server (or servers) in the system can be machines, people, buildings, etc. Customers often spend time waiting in queue before they begin service. The customer’s time in system is the sum of their waiting time in queue and their service time. The mean service (processing) time is the inverse of the mean service rate (i.e., p = 1/μ and μ = 1/p) and the mean time between arrivals is the inverse of the mean arrival rate (i.e., a = 1 / λ). Utilization is the percentage of the time that the servers are busy (i.e., ρ = λ/μ = p / a).
One of the fundamental managerial insights from queuing theory is that the relationship between utilization and the mean time in system is highly non-linear. The graph below shows this relationship with commonly used assumptions. This particular graph has a mean arrival rate of λ = 100 customers per hour and one server with a mean service rate of μ = λ/ρ customers per hour, where ρ is the utilization. However, the shape of the graph is similar no matter which parameters are used. The practical implication of this insight is that managers who seek to maximize utilization might find themselves dramatically increasing the mean time in system, which might mean very long customer waiting times, poor service, and high inventory.
The most basic queuing model has a single server (s = 1) and requires three assumptions: (1) the time between arrivals follows the negative exponential distribution, (2) service times also follow the negative exponential distribution, and (3) the service discipline is first-come-first-served. (Note: The negative exponential distribution is often called the exponential distribution.) The model also assumes that all parameters are stationary, which means that the mean arrival rate and mean service rate do not change over time and are not affected by the state of the system (i.e., a long waiting line will not affect the arrival rate). This model is known as the M/M/1 queue. The first “M” notation indicates that the arrival process is Markovian. The second “M” indicates that the service process is also Markovian. The “1” indicates that the system has one server. A Markovian arrival process has interarrival times that follow the exponential distribution. A Markovian service process has service times that also follow the exponential distribution. A Markovian process is also called a Poisson process.
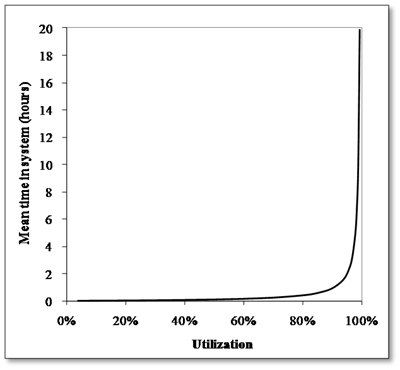
Define μ (mu) as the mean service rate (customers/period) and λ (lambda) as the mean arrival rate (customers/period). The steady state results for the M/M/1 queue are then:

More detail and examples of Little’s Law (Little 1961) can be found in the Little’s Law entry. The Pollaczek-Khintchine formula entry presents the model for the M/G/1 queue, which is a Markovian (Poisson) arrival process for a single server with a general (G) service time distribution. When the number of servers is greater than one, the arrival process is not Markovian, or the service process is not Markovian, the “heavy-traffic” approximation can be used. See the pooling entry for an example of this model.
Erlang C formula can be used to estimate the required number of servers for a call center or any other system with random arrivals. The only two inputs to the model are the average (or forecasted) arrival rate and the average service time. The service policy is stated in terms of the probability p* that an arriving customer will have to wait more than t* time units (e.g., seconds). For example, the service policy might be that at least p* = 90% of customers will have to wait no more than t* = 60 seconds for a customer service representative to answer a call. This is written mathematically as P(T ![]() t*)
t*) ![]() p*, where T is the waiting time for a customer, which is a random variable. Although this model has Erlang in its name, it does not use the Erlang distribution. This model is essentially the M/M/s queuing model with an exponentially distributed time between arrivals and exponentially distributed service times.
p*, where T is the waiting time for a customer, which is a random variable. Although this model has Erlang in its name, it does not use the Erlang distribution. This model is essentially the M/M/s queuing model with an exponentially distributed time between arrivals and exponentially distributed service times.
Finite population queuing models are used when the size of the calling population is small. For example, a finite queuing model should be used when the “customers” in the system are a limited number of machines in a factory. State-dependent queuing models are applied when the mean arrival rate or the mean service rate are dependent upon the state of the system. For example, when customers arrive to the system and see a long waiting line, they may become discouraged and exit the system.
See balking, call center, capacity, exponential distribution, First-In-First-Out (FIFO), Last-In-First-Out (LIFO), Little’s Law, operations performance metrics, Poisson distribution, Pollaczek-Khintchine formula, pooling, run time, time in system, utilization, value added ratio, wait time, what-if analysis.
quick hit – A process improvement opportunity that can be realized without much time or effort; also called a “just do it” task and a “sure hit.”
Lean sigma project teams are often able to identify and implement a number of process improvements very quickly. These improvements are often not the main focus of the project, but are additional benefits that come from the project and therefore should be included in the project report and credited to the process improvement project. These improvements often justify the entire project. Quick hits usually do not require a formal project plan or project team and can normally be done by one person in less than a day.
See DMAIC, just do it, lean sigma.
Quick Response (QR) – See Quick Response Manufacturing.
Quick Response Manufacturing – An approach for reducing leadtimes developed by Professor Rajan Suri, director of the Center of Quick Response Manufacturing, University of Wisconsin-Madison.
See agile manufacturing, Efficient Consumer Response (ECR), lean thinking, time-based competition.