
D
dampened trend – The process of reducing the trend (slope) in a forecast over time.
Gardner (2005) and others suggest that the trend in a forecasting model should be “dampened” (reduced) for multiple period-ahead forecasts because trends tend to die out over time. Almost no trends continue forever.
See exponential smoothing, linear regression.
dashboard – A performance measurement and reporting tool that provides a quick summary for the business unit or project status.
Ideally, a dashboard has a limited number of metrics (key performance indicators) to make it easy to comprehend and manage. The term “dashboard” is a metaphor for an automobile’s instrument panel, with a speedometer, tachometer, fuel gauge, and oil warning light. Many firms use simple “red, yellow, green” indicators to signal when the organization is not meeting its targets. Ideally, a dashboard should include both financial and non-financial measures and should be reviewed regularly. When the dashboard approach is applied to external supply chain partners, it is usually called a supplier scorecard.
See Balanced Scorecard, corporate portal, Key Performance Indicator (KPI), operations performance metrics, supplier scorecard.
Data Envelopment Analysis (DEA) – A performance measurement technique that can be used to measure the efficiency of an organization relative to other organizations with multiple inputs and outputs.
DEA has been used to measure and improve efficiency in many industry contexts, such as banks, police stations, hospitals, tax offices, prisons, defense bases, schools, and university departments. For example, consider a bank that operates many branch banks, each having different numbers of transactions and different teller staffing levels. The table below displays the hypothetical data for this example. (This example is adapted from http://people.brunel.ac.uk/~mastjjb/jeb/or/dea.html, January 6, 2007.)

The simplest approach for measuring efficiency for a branch is to calculate the ratio of an output measure (transactions) to an input measure (tellers). In DEA terminology, the branches are viewed as taking inputs (tellers) and converting them with varying degrees of efficiency into outputs (transactions). The St. Paul branch has the highest efficiency ratio in terms of the number of transactions per teller. The efficiency ratio for the St. Paul branch could be used as a target for the other branches and the relative efficiency of the other branches can be measured in comparison to that target.
This simple example has only one input (tellers) and one output (transactions). To take the example one step further, consider how the bank might measure efficiency when it includes both personal and business transactions. The bank will likely find that one branch is more efficient at personal transactions and another is more efficient at business transactions. See the data in the table below.

With this data, the St. Paul branch is still the most efficient for personal transactions per teller, but the Bloomington branch is the most efficient for business transactions. One simple way to handle this problem for two ratios is to graph the data. The graph on the right shows that the “efficient frontier” is the convex hull (region) defined by the Bloomington and St. Paul branches and that the Edina and Minneapolis branches are relatively inefficient. From this graph, it is easy to see why it is called Data Envelopment Analysis.

Source: Professor Arthur V. Hill
The measurement becomes much more difficult with multiple inputs or with multiple outputs. DEA uses linear programming to measure the efficiency of multiple Decision Maker Units (DMUs) when the production process presents a structure of multiple inputs and outputs.
The benefits of DEA over other similar approaches are that (1) it does not require an explicit mathematical form for the production function, (2) it is useful for uncovering relationships, (3) it is capable of handling multiple inputs and outputs, (4) it can be used with any input-output measurement, and (5) it allows sources of inefficiency to be analyzed and quantified for every evaluated unit.
In the DEA methodology developed by Charnes, Cooper, and Rhodes (1978), efficiency is defined as a weighted sum of outputs to a weighted sum of inputs, where the weights are calculated by means of mathematical programming and constant returns to scale is assumed.
See operations performance metrics, production function, productivity.
data mining – The process of analyzing a database (often in a data warehouse) to identify previously unknown patterns and relationships in the data and predict behavior of customers, prospective customers, etc.
Data mining tools make use of both statistical and software engineering tools and are often used in conjunction with very large databases. Ideally, data mining allows the user to visualize the data by providing graphical outputs. Standard data mining tools include cluster analysis, tree analysis, binary logistic regression, and neural nets (neural networks).
For example, data mining software can help retail companies find customers with common interests, screen potential donors for a college, and identify the key characteristics that should be considered in granting credit to a new customer.
Data mining is also known as knowledge-discovery in databases (KDD).
The major software vendors in the market are SAS Enterprise Miner, SPSS Clemintine, and XLMiner.
See business intelligence, cluster analysis, data warehouse, logistic regression, neural network.
data warehouse – A database designed to support business analysis and decision making.
The data warehouse loads data from various systems at regular intervals. Data warehouse software usually includes sophisticated compression and hashing techniques for fast searches, advanced filtering, ad hoc inquiries, and user-designed reports.
See cluster analysis, data mining, logistic regression, normalization.
days of inventory – See periods supply.
days on hand – See periods supply.
days supply – See periods supply.
DBR – See Drum-Buffer-Rope (DBR).
DC – See Distribution Center (DC).
DEA – See Data Envelopment Analysis.
deadhead – (1) The move of an empty transportation asset, especially a truck, to a new location to pick up freight or return home. (2) The unloaded, unpaid distance a truck must cover between where it emptied and where it will reload; verb form: moving a transportation asset in this manner.
Backhaul loads are normally taken at lower rates than headhaul loads. For example, long haul trucks often get high rates to move loads from the West Coast to the Northeast. Once they have made delivery in the Northeast, they may have substantial deadhead distance to another location where they can pick up backhauls to the West Coast. Backhaul rates are normally less than headhaul rates.
See backhaul, logistics, repositioning.
death spiral – See make versus buy decision.
Decision Sciences Institute (DSI) – A multidisciplinary international professional society that is dedicated to advancing knowledge and improving instruction in all business and related disciplines.
DSI facilitates the development and dissemination of knowledge in the diverse disciplines of the decision sciences through publications, conferences, and other services. DSI publishes the Decision Sciences Journal (DSJ) and the Decision Sciences Journal of Innovative Education (DSJIE). The DSI website is www.decisionsciences.org.
See operations management (OM).
decision theory – See decision tree.
Decision Support System (DSS) – An interactive computer-based information system that supports decision makers by providing data and analysis as needed.
DSS software often runs queries against databases to analyze data and create reports. More sophisticated systems will use (1) simulation models to help managers ask “what-if” questions and (2) optimization models to recommend solutions for managers. Business intelligence and business analytics are examples of DSSs.
See business intelligence, groupware, optimization, simulation.
decision tree – A graphical decision tool for drawing and analyzing possible courses of action. ![]()
A decision tree is a basic tool in the fields of decision analysis (decision theory), risk management, and operations research. A decision tree is usually drawn in time order from left to right. Decision nodes are usually drawn with squares and chance nodes are drawn with circles. When probabilities are assigned to each chance node, the decision nodes can be evaluated in terms of the expected monetary value.
The figure on the right is a verysimple decision tree with one decision node (build or not build) and one chance node (win or not win the contract). (Chery is a Chinese automobile manufacturer.) This example could be taken another step by assigning probabilities to each arc coming out of the chance node and computing the expected monetary value for each decision alternative. Bayes’ Theorem is sometimes applied in analyzing such problems in the presence of imperfect information.
Decision tree example

See Analytic Hierarchy Process (AHP), Bayes’ Theorem, causal map, force field analysis, issue tree, Kepner-Tregoe Model, MECE, operations research (OR), Pugh Matrix, risk assessment.
decomposition – See forecasting.
decreasing returns to scale – See diseconomy of scale.
decoupling point – See push-pull boundary.
deductive reasoning – See inductive reasoning.
de-expediting – See expediting.
defect – An error in a product or service.
Products and services have specification limits on important characteristics (dimensions). A defect occurs when the characteristic is outside these specification limits. Therefore, a product or service can have as many defects as it has characteristics. A product or service is “defective” if it has one or more defects in the unacceptable range.
See early detection, lean sigma, lean thinking, quality management, sigma level, Total Quality Management (TQM).
Defective Parts per Million (DPPM) – The number of units not meeting standards, expressed as units per million; sometimes also called PPM (Parts per Million).
See Defects per Million Opportunities (DPMO), sigma level.
Defects per Million Opportunities (DPMO) – The number of defects (not the number of defective units) per million opportunities, where each unit might have multiple opportunities.
It is possible that a unit (a part) has many defects. For example, a single automobile can have defects in the door, windshield, and muffler. The Defective Parts per Million (DPPM) will be the same as the DPMO only if each unit has only one opportunity for a defect and a unit is judged to be defective if it has this defect. (A part is usually considered defective if it has one defect.) Managers should be careful with this metric because it is easy to make it better by arbitrarily defining more “opportunities” for defects for each unit.
See Defective Parts per Million (DPPM), lean sigma, process capability and performance, quality management, sigma level.
delegation – The transfer of responsibility for a job or task from one person or organization to another.
Tasks should be assigned to the most productive resource, which may be outside an organization. Delegation, therefore, can be a powerful tool for managers to increase their productivity. Outsourcing is a form of delegation. Delegation is similar to, but not identical to, the division of labor principle. Whereas division of labor splits a task into two or more pieces and then delegates, delegation does not require that the task be split. Value chain analysis (Porter 1985) is a strategic view of delegation from an organizational point of view.
Good questions to ask to help a manager decide if a task should be delegated: (1) Do you have time to complete the task? (2) Does this task require your personal supervision and attention? (3) Is your personal skill or expertise required for this task? (4) If you do not do the task yourself, will your reputation (or the reputation of your organization) be damaged? (5) Does anyone on your team have the skill to complete the task? (6) Could someone on your team benefit from the experience of performing the task?
In contract law, the term “delegation” is used to describe the act of giving another person the responsibility of carrying out the duty agreed to in a contract. Three parties are concerned with this process: the delegator (the party with the obligation to perform the duty), the delegatee (the party that assumes the responsibility of performing the duty) and the obligee (the party to whom this duty is owed).
See division of labor, human resources, outsourcing, personal operations management, value chain, vendor managed inventory (VMI).
deliverables – The tangible results of a project that are handed over to the project sponsor.
Examples of deliverables include hardware, software, mindmaps, current state and future state analysis (shown in process maps and value stream maps), causal maps, reports, documents, photos, videos, drawings, databases, financial analyses, implementation plan, training, and standard operating procedures (SOPs). In a process improvement context, some projects stop with the proposed plan, whereas others include the actual process improvement. A deliverable can be given to the sponsor in the form of a PowerPoint presentation, report, workshop, Excel workbook, CD, or a training session.
See DMAIC, milestone, post-project review, project charter, scrum, sponsor, stage-gate process, value stream map.
delivery time – The time required to move, ship, or mail a product from a supplier to a customer.
See service level.
Delphi forecasting – A qualitative method that collects and refines opinions from a panel of anonymous experts to make forecasts; also known as the Delphi Method. ![]()
Named after the Greek oracle at Delphi whom the Greeks visited for information about their future, the Delphi Method is an iterative procedure for collecting and refining the opinions of a panel of experts. The collective judgment of experts is considered more reliable than individual statements and is thus more objective in its outcomes. Delphi forecasting is usually applied to estimate unknown parameters, typically forecasting dates for long-term change in the fields of science and technology.
A survey instrument is used over several iterations. Both statistical and commentary feedback is provided with each iteration. After two or three iterations, opinions converge and a final report is made. The typical steps in a Delphi study are as follows:
Step 1. Define the questions that need to be asked.
Step 2. Identify the experts, who ideally have differing points of view on the questions defined in Step 1.
Step 3. Create the survey instrument. For technological forecasting, the questions are often phrased in the form, “In what year do you believe that event X will occur?”
Step 4. Recruit the experts to respond to this round. Ask them to individually and independently respond to the survey questions with both quantitative responses (e.g., the year that the event will happen) and commentary feedback (assumptions, justifications, explanations). Note that the experts’ identities should remain anonymous so feedback from famous or powerful people is not given undue weight.
Step 5. Summarize the results from this round and give statistical and commentary feedback to the expert panel. The statistical feedback is usually presented in the form of a histogram and some basic descriptive statistics.
Step 6. Conduct the next round of the survey if needed.
Delphi overcomes many problems with face-to-face meetings, such as (1) domination by a few strong personalities, (2) anchoring on the first ideas that are presented, (3) pressure on participants to conform, and (4) regularly becoming overburdened with non-essential information.
See anchoring, brainstorming, forecasting, technological forecasting.
demand – The quantity the market will buy per period at a particular price. ![]()
Whereas sales is how many units were actually sold, demand is how many units would have been sold if inventory had been available. In other words demand = sales + lost sales. Sales data, therefore, is censored because it may not include all demand.
It is often useful to distinguish between discrete (integer) and continuous demand. When demand is considered to be continuous, the demand variable is not restricted to integer values, which means that a continuous probability distribution (such as the normal, lognormal, or gamma) can be used. Even when demand is an integer, it is often modeled as a continuous variable when the average demand is greater than 10.
See the forecasting entry for more discussion on this and related issues.
See all-time demand, bookings, censored data, dependent demand, economics, elasticity, exponential smoothing, forecasting, independent demand.
demand chain management – Supply chain management that focuses on the customer end of the supply chain and uses signals (such as point-of-sale data) from the customer to trigger production.
Some North America consulting firms have tried to promote this term. However, at the time of this writing, it has not been widely embraced in industry or academia.
demand during leadtime – The quantity demanded while waiting for a replenishment order to arrive.
In inventory and purchasing management, the demand during the replenishment leadtime is a random variable. Formulas are available to estimate the mean and standard deviation of the demand during leadtime distribution from estimates of the mean and standard deviation of demand and the mean and standard deviation of the replenishment leadtime. It is important to set the reorder point large enough to meet the demand while the firm waits for a replenishment order to arrive.
See leadtime, reorder point, replenishment order, safety stock.
demand filter – An exception reporting and control tool for time series forecasting that signals a problem when one forecast value is outside the expected range of forecast values.
When the absolute value of the forecast error is very large, the demand filter triggers an exception report to warn the user. The simplest rule is to test if the forecast error is larger than plus or minus three times the standard deviation of the forecast error.
The demand filter at the end of period t is the absolute value of the forecast error divided by an estimate of the standard deviation of the error. One approach for handing this is to define the demand filter at the end of period t as ![]() , where |Et| is the absolute value of the forecast error and
, where |Et| is the absolute value of the forecast error and ![]() is the square root of the smoothed mean squared error (an estimate of the recent standard deviation of the forecast error). This uses the smoothed MSE because the demand filter is typically implemented in a time series forecasting context. The demand filter exception report is created whenever DFt exceeds some critical value, DF*. Assuming that the errors (Et) are normally distributed, DFt is a standard normal random variable. Therefore, it can be compared to a z value used in basic statistics textbooks. Therefore, a reasonable control limit is DF* = 3. In other words, the system should create an exception report whenever the demand filter exceeds a value of 3. It is important to use the smoothed mean squared error from the previous period in the demand filter so an outlier is not included in the estimation of the standard deviation of the forecast error. Alternative forms for the demand filter include
is the square root of the smoothed mean squared error (an estimate of the recent standard deviation of the forecast error). This uses the smoothed MSE because the demand filter is typically implemented in a time series forecasting context. The demand filter exception report is created whenever DFt exceeds some critical value, DF*. Assuming that the errors (Et) are normally distributed, DFt is a standard normal random variable. Therefore, it can be compared to a z value used in basic statistics textbooks. Therefore, a reasonable control limit is DF* = 3. In other words, the system should create an exception report whenever the demand filter exceeds a value of 3. It is important to use the smoothed mean squared error from the previous period in the demand filter so an outlier is not included in the estimation of the standard deviation of the forecast error. Alternative forms for the demand filter include ![]() and DFt = |Et| / (1.25SMADt).
and DFt = |Et| / (1.25SMADt).
See exponential smoothing, forecast bias, forecast error metrics, forecasting, Mean Absolute Percent Error (MAPE), mean squared error (MSE), tracking signal.
demand flow – Another word for Just-in-Time (JIT) manufacturing.
See lean thinking.
demand management – (1) The name of an organizational function (i.e., the demand management organization). (2) The name of a set of practices that are designed to influence demand. ![]()
The demand management organization is a relatively new organizational form in North America. This organization can report to either the manufacturing or sales organization and is charged with creating forecasts, managing the S&OP process, influencing supply policies (manufacturing, purchasing, inventory, logistics), and influencing demand policies (sales, marketing, pricing).
Demand management practices include those activities that collect demand information and affect the demand to better match the capacity. Demand can be influenced through pricing, advertising, promotions, other customer communications, and other mechanisms. Leveling the demand can often reduce capacity change costs.
See forecasting, heijunka, Sales & Operations Planning (S&OP).
Deming’s 14 points – A summary of the quality improvement philosophy developed and taught by W. Edwards Deming.
Deming (1900-1993) was an American statistician, college professor, author, lecturer, and consultant. He is widely credited with improving production in the U.S. during World War II, although he is perhaps best known for his work in Japan. From 1950, onward he taught top management how to improve design, product quality, testing, and sales. Deming made a significant contribution to Japan’s ability to produce innovative high-quality products and is regarded as having had more impact upon Japanese manufacturing and business than any other individual not of Japanese heritage. Adapted from http://en.wikipedia.org/wiki/ W._Edwards_Deming (January 17, 2007).
Deming’s work is outlined in two books, Out of the Crisis (1986, 2000), and The New Economics for Industry (2000), in which he developed his System of Profound Knowledge. The fourteen points are summarized below. (Author’s note: These titles were not in the original 14 points. Many variations for some of Deming’s points can be found on the Web. The list below is from Wikipedia with some minor edits, with the exception of point 6.)
1. Create constancy of purpose – Create constancy of purpose toward improvement of product and service, with the aim to become competitive, stay in business, and provide jobs.
2. Adopt the new philosophy – Adopt a new philosophy of cooperation (win-win) in which everybody wins and put it into practice by teaching it to employees, customers and suppliers.
3. Cease dependence on inspection to achieve quality – Cease dependence on mass inspection to achieve quality. Instead, improve the process and build quality into the product in the first place.
4. End the practice of awarding business on the basis of price alone – End the practice of awarding business on the basis of price alone. Instead, minimize total cost in the long run. Move toward a single supplier for any one item, based on a long-term relationship of loyalty and trust.
5. Continuously improve every process – Improve constantly, and forever, the system of production, service, and planning. This will improve quality and productivity and thus constantly decrease costs.
6. Institute training on the job – Institute modern methods of training on the job for all, including management, to make better use of every employee. New skills are required to keep up with changes in materials, methods, product and service design, machinery, techniques, and service.
7. Improve leadership – Adopt and institute leadership for the management of people, recognizing their different abilities, capabilities, and aspiration. The aim of leadership should be to help people, machines, and gadgets do a better job. Leadership of management is in need of overhaul.
8. Drive out fear – Drive out fear and build trust so that everyone can work more effectively.
9. Break down functional silos – Break down barriers between departments. Abolish competition and build a win-win system of cooperation within the organization. People in research, design, sales, and production must work as a team to foresee problems of production and use that might be encountered with the product or service.
10. Eliminate slogans – Eliminate slogans, exhortations, and targets asking for zero defects or new levels of productivity. Such exhortations only create adversarial relationships, because most of the causes of low quality and low productivity belong to the system and thus lie beyond the power of the workforce.
11. Eliminate quotas – Eliminate numerical goals, numerical quotas, and management by objectives. Substitute leadership.
12. Encourage pride in work – Remove barriers that rob people of joy in their work. This will mean abolishing the annual rating or merit system that ranks people and creates competition and conflict.
13. Institute educational programs – Institute a vigorous program of education and self-improvement.
14. Take action – Put everybody in the company to work to accomplish the transformation. The transformation is everybody’s job.
Anderson, Rungtusanatham, and Schroeder (1994) traced the development of the Deming management method, positioned it in the context of theory, and explained the underlying theory of quality management.
See functional silo, inspection, lean sigma, Management by Objectives (MBO), quality management, Statistical Process Control (SPC), Statistical Quality Control (SQC), Total Quality Management (TQM).
demonstrated capacity – See capacity.
demurrage – The carrier charges and fees applied when rail freight cars and ships are retained beyond specified loading or unloading times.
See terms.
dendrogram – See cluster analysis.
dependent demand – Demand that is derived from higher-level plans and therefore should be planned rather than forecasted.
In a manufacturing firm, dependent demand is calculated (not forecasted) from the production plan of higher-level items in the bill of material (BOM). End item demand is usually forecasted. A production plan (aggregate production plan) and a Master Production Schedule (MPS) are created in light of this forecast. These plans are rarely identical to the forecast because of the need to build inventory, draw down inventory, or level the production rate. This dependent demand should almost never be forecasted.
It is common for some items to have both dependent and independent demand. For example, a part may be used in an assembly and has dependent demand. However, this same part might also have independent demand as a service part.
See bill of material (BOM), demand, independent demand, inventory management, Materials Requirements Planning (MRP).
deployment leader – A person who leads the lean sigma program in one part of a business, often a division, strategic business unit, or functional area (operations, new product development, sales, etc.).
In some firms, the deployment leader is not assigned full time to the lean sigma program. Deployment leaders usually report to the overall program champion, at least with a dotted line reporting relationship.
See champion, lean sigma.
Design Failure Mode and Effects Analysis (DFMEA) – The application of Failure Modes and Effects Analysis (FMEA) principles to product and service design.
FMEA can be used to anticipate and mitigate risks in both a process improvement context (where a process is already in place) and a design context (where the design does not yet exist). However, a process FMEA and a design FMEA have some significant differences. The term “FMEA” normally refers to a process FMEA.
See Failure Mode and Effects Analysis (FMEA).
Design for Assembly (DFA) – Design for manufacturing concepts applied to assembly.
See Design for Manufacturing (DFM).
Design for Disassembly – A set of principles used to guide designers in designing products that are easy to disassemble for re-manufacturing or repair operations.
Design for Disassembly enables a product and its parts to be easily reused, re-manufactured, refurbished, or recycled at end of life. In the long run, Design for Disassembly could make it possible to eliminate the need for landfills and incineration of mixed waste. Products would be designed so they never become waste, but instead become inputs to new products at the end of their useful lives. Design for Disassembly is a key strategy within the larger area of sustainable product design, which is concerned with a more proactive approach to environmentally responsible design. As environmental concerns grow in the world, re-manufacturing will continue to grow in importance. In Europe, this is already a major issue, with manufacturers, such as Vokswagen, designing products that can be easily disassembled.
See Design for Manufacturing (DFM), remanufacturing.
Design for Environment – See Design for Disassembly (DFD) and remanufacturing.
Design for Manufacturing (DFM) – A set of methodologies and principles that can be used to guide the design process so that product fabrication and assembly will have low cost, low assembly time, high labor productivity, low manufacturing cycle time, low work-in-process inventory, high conformance quality, low manufacturing ramp-up time, and short time to market. ![]()
DFM is the best known of the many DFx (“design-for”) acronyms. Boothroyd, Dewhurst, and Knight (2010) wrote what is probably the most popular reference on DFM and DMA.
See Design for Assembly (DFA), Design for Disassembly, Design for Reliability (DFR), value engineering.
Design for Manufacturing and Assembly (DFMA) – See Design for Manufacturing (DFM).
Design for Quality – See Design for Manufacturing (DFM).
Design for Reliability (DFR) – A concurrent engineering program where the reliability engineer is part of the product development team working with the design engineers to design reliable products with low overall lifecycle costs.
See Design for Manufacturing (DFM), quality management, reliability.
Design for Six Sigma (DFSS) – An extension of six sigma tools and concepts used for developing new products.
The rationale for DFSS is that it is much easier to design quality into a product than it is to fix problems after the design is complete. Instead of using the lean sigma DMAIC framework, DFSS uses IDOV (Identify, Design, Optimize, and Validate) or DMADV (Define, Measure, Analyze, Design, and Verify). More detail on DMADV follows:
• Define the project goals and customer (internal and external) deliverables.
• Measure and determine customer needs and specifications.
• Analyze the process options to meet the customer needs.
• Design the process to meet the customer needs.
• Verify the design performance and ability to meet customer needs.
DMAIC and DFSS have the following in common:
• Lean sigma methodologies are used to drive out defects.
• Data intensive solution approaches require cold, hard facts.
• Trained project leaders (black belts and green belts) lead projects with support from master black belts.
• Projects are driven by the need to support the business and produce financial results.
• Champions and process owners oversee and support projects.
The DFSS methodology is used for new product development, whereas the lean sigma (formerly called six sigma) DMAIC methodology is used for process improvement. The DMAIC methodology should be used instead of DMADV when an existing product or process is not meeting customer specification or is not performing adequately. The DMADV methodology should be used instead of the DMAIC methodology when (1) a product or process does not exist and needs to be developed, or (2) the existing product or process exists and has been optimized and still does not meet customer specifications.
Design for Six Sigma does not replace the stage-gate process, but enhances it by providing additional statistical rigor to the gate criteria. Teams are required to bring facts and analytic data to the gate reviews to validate that the tools, tasks, and deliverables are met.
Cpk is a measure of how well the product performance meets the customer needs. This is a key DFSS metric throughout the development cycle and is used to ensure that quality is designed into the product.
See deliverables, DMAIC, lean sigma, New Product Development (NPD), process capability and performance, Pugh Matrix, quality management, stage-gate process.
Design of Experiments (DOE) – A family of statistical tools designed to build quality into the product and process designs so the need for inspection is reduced.
DOE achieves this by optimizing product and process designs and by making product and process designs robust against manufacturing variability. Experimental designs are used to identify or screen important factors affecting a process, and to develop empirical models of processes. DOE techniques enable teams to learn about process behavior by running a series of experiments. The goal is to obtain the maximum amount of useful information in the minimum number of runs. DOE is an important and complex subject beyond the scope of this book. The reader is referred to a linear models text, such as Kutner, Neter, Nachtsheim, and Wasserman (2004).
See Analysis of Variance (ANOVA), Gauge R&R, lean sigma, robust, Taguchi methods.
design quality – See product design quality.
Design Structure Matrix (DSM) – A compact matrix representation showing the precedence relationships and information flows in a system/project.
DSM contains a list of all constituent subsystems/activities and the corresponding information exchange and dependency patterns. That is, what information pieces (parameters) are required to start a certain activity and where does the information generated by the activity feed into (i.e., which other tasks within the matrix utilize the output information)? The DSM provides insights about how to manage a complex system/project and highlights issues of information needs and requirements, task sequencing, and iterations.
In the DSM, the tasks for a project are listed on the rows and then repeated for the columns. An X indicates the existence and direction of information flow (or a dependency in a general sense) from one activity in the project to another. Reading across a row reveals the input/dependency flows by an X placed at the intersection of that row with the column that bears the name of the input task. Reading across a column reveals the output information flows from that activity to other activities by placing an X as described above. A green mark below the main diagonal represents a forward flow of information. The red marks above the main diagonal reveal feedback from a later (downstream) activity to an earlier (upstream) one. This means that the earlier activity has to be repeated in light of the late arrival of new information.
See project management, upstream.
devil’s advocate – The role of providing an opposing and skeptical point of view in a discussion.
The devil’s advocate role is taken by a person (or assigned to a person) in a group discussion, debate, or argument. This person’s role is to provide a test of the prevailing argument even though the person with this role may not actually believe in the opposing argument. According to Wikipedia, the term “devil’s advocate” was a contrarian role that the Catholic Church assigned to a person in the process of evaluating someone for sainthood.
See brainstorming.
DFA – See Design for Assembly (DFA).
DFD – See Design for Disassembly.
DFM – See Design for Manufacturing.
DFMA – See Design for Manufacturing and Assembly.
DFMEA – See Design Failure Mode and Effects Analysis (DFMEA).
DFSS – See Design for Six Sigma (DFSS).
die – See die cutting.
die cutting – The process of using metal to shape or cut material.
A die is a metal plate or block used to make parts by molding, stamping, cutting, shaping, or punching. For example, a die can be used to cut the threads of bolts. Wires are made by drawing metal through a die that is a steel block or plate with small holes. Note the plural of die is “dies.”
See manufacturing processes, stamping.
digital convergence – A technological trend where a number of technologies, such as entertainment (movies, videos, music, TV), printing (books, newspapers, magazines), news (TV, newspapers, radio), communications (phone, mobile phone, data communications), computing (personal computers, mainframe computers), and other technologies, merge into a single integrated technology.
The term “convergence” implies that these technologies will become more integrated and will tend to radically change each other. For example, cable TV operators are offering bundles of high-speed Internet, digital telephone, and other services. The lines between the technologies that offer entertainment, data transfer, and communications are becoming less clear over time.
digital supply chain – The process of delivering digital media, such as music or video, by electronic means to consumers.
A physical supply chain processes materials through many steps and across many organizations. Similarly, a digital supply chain processes digital media through many stages before it is received by consumers.
dimensional weight – A method used by shippers to assign a price to a package based on volume and shape rather than just on weight; also called dim weight.
Carriers have found that some low-density and odd-shaped packages are unprofitable when they charge only on weight. The industry’s solution to this problem is to calculate the dimensional weight for setting prices. Dimensional weight is often based on a volume calculated in terms of the longest dimension. In other words, volume V = L3, where L = max(l, w, d) for package length l, width w, and depth d. (If the package is a cube, then V is the actual volume. However, if the package is oddly shaped, V is much more than the actual volume.) The dimensional weight is then DW = V/m, where m is the minimum density the shipper will use in calculating a price. The weight used to determine the price is the maximum of the dimensional weight and the actual weight.
See transportation.
direct cost – Expenses that can be assigned to a specific unit of production.
Direct costs usually include only the material and labor costs that vary with the quantity produced.
See cost of goods sold, direct labor cost, overhead.
direct labor cost – The labor cost that is clearly assignable to a part or product. ![]()
Direct labor cost is usually computed as the standard (or actual) hours consumed times the pay rate per hour. The pay rate per hour often includes fringe benefits, but does not include materials cost or other overhead.
See cost of goods sold, direct cost, overhead.
direct ship – See drop ship.
direct store shipment – See drop ship.
directed RF picking – See picking.
discounted cash flow – See Net Present Value (NPV).
discrete demand – See demand.
discrete lotsize – See lot-for-lot.
discrete order picking – An order picking method where a stock picker will retrieve (pick) all items on one order before starting another.
discrete probability distribution – See probability mass function.
discrete manufacturing – A process that creates products that are separate from others and easy to count.
Good examples of discrete manufacturing include building a computer or an automobile. In contrast, a continuous process deals with materials, such as liquids or powders. Examples of continuous processes include oil refining, chemical processing, or paper manufacturing.
See assembly line, batch process, continuous flow, continuous process, job shop.
discrete uniform distribution – See uniform distribution.
discriminant analysis – A statistical technique that predicts group membership; also called linear discriminant analysis.
See linear regression, logistic regression.
diseconomy of scale – The forces that cause organizations to have higher unit costs as volume increases; also called diseconomies of scale. ![]()
Most business managers are familiar with the concept of economy of scale, where the unit cost decreases as the volume increases. The less-familiar concept of diseconomy of scale is where the unit cost increases as the volume increases. In many industries, firms will have economies of scale until they grow to be quite large.
For example, it is said that the optimal hospital size is roughly 400 beds10 and that larger hospitals tend to become less efficient due to the complexity of the operation, which is a function of the number of employees and the distance people have to travel. This is also true for high schools, where the optimal school size is probably between 400 and 600 students11. A watch factory in Moscow once had 7,000 people making watches and a U.S. defense factory was so large that workers had to ride bicycles to travel within the plant12. These factories were not very competitive due to their size. The reasons why unit cost might increase with volume include:
• Coordination and communication problems – As firm size increases, coordination and communication becomes much more difficult and often leads to the creation of a large bureaucracy. The number of unique pairs in an organization with n units or individuals is n(n - 1)/2, which grows with n2.
• Top-heavy management – As firm size increases, management expense tends to increase.
• Insulated managers – As firms increase in size, managers are less accountable to shareholders and markets and are more insulated from reality. Therefore, they tend to seek personal benefits over firm performance.
• Lack of motivation – As firms grow, workers tend to be more specialized, have a harder time understanding the organization’s strategy and customers, and are more likely to be alienated and less committed to the firm.
• Duplication of effort – As firm size increases, it is common for firms to waste money on duplicate efforts and systems. It is reported that General Motors had two in-house CAD/CAM systems and still purchased other CAD/CAM systems from outside firms.
• Protection from consequences – In a small firm, most managers immediately see and experience the consequences of their decisions. In many large firms, managers are transferred every few years and rarely have to live with their bad decisions very long. Therefore, they do not learn from their mistakes.
• Inertia – It is often very hard for a large organization to change directions. A VP of MIS for a large bank in Seattle reported that it was nearly impossible for his bank to make any significant changes. It was just too hard to understand all the linkages between the more than ten million lines of code.
• Self-competition – The managing directors for a large paper products firm in Europe identified their biggest problem as competition with the other operating companies within the same firm.
• Transportation – If output for a national or international market is concentrated at a single large plant, transportation costs for raw materials and finished goods to and from distant markets may offset scale economies of production at the large plant.
Canbäck et al. (2006) found empirical support for many of the above statements. Some of the ideas above were adapted from http://en.wikipedia.org/wiki/Diseconomies_of_scale.
See economy of scale, flexibility, pooling.
disintermediation – Removing a supplier or distributor from a supply chain; also called “cutting out the middleman.”
A distributor is an intermediary between a manufacturer and its customers. When a firm removes a distributor between it and its customers, it is said to have disintermediated the distributor and has practiced disintermediation. This is common when a manufacturing firm replaces distributors with a website that sells directly to customers. Reintermediation occurs when the distributor finds a way to re-insert itself into the channel, possibly by offering its own website and better service.
See channel conflict, dot-com, supply chain management.
dispatch list – See dispatching rules.
dispatching rules – Policies used to select which job should be started next on a process; sometimes called job shop dispatching or priority rules.
For example, a manager arrives at work on a Monday morning and has 20 tasks waiting on her desk. Which task should she handle first? She might take the one that is the most urgent (has the earliest due date), the longest one, or the one that has the most economic value. In a very similar way, a shop supervisor might have to select the next job for a machine using the same types of rules.
The best-known dispatching rules include First-In-First-Out (FIFO), shortest processing time, earliest due date, minimum slack time, and critical ratio, which are factors of the arrival time, processing time, due date, or some combination of those factors. Other factors to consider include value, customer, and changeover cost or time. The FIFO rule may be the “fairest” rule, but does not perform well with respect to average flow time or due date performance. It can be proven that the shortest processing time rule will minimize the mean (average) flow time, but does poorly with respect to on-time delivery. MRP systems backschedule from the due date and therefore are essentially using a minimum slack rule, which has been shown to perform fairly well in a wide variety of contexts. The critical ratio (Berry and Rao 1975) for a job is equal to the time remaining until the due date divided by the work time remaining to complete the job13. A critical ratio less than one indicates the job is behind schedule, a ratio greater than one indicates the job is ahead of schedule, and a ratio of one indicates the job is on schedule. (Do not confuse the critical ratio rule with the critical ratio in the newsvendor model.)
Dispatching rules are used to create a daily dispatch list for each workcenter. This is a listing of manufacturing orders in priority sequence based on the dispatching rule.
See expediting, First-In-First-Out (FIFO), heijunka, job shop, job shop scheduling, Last-In-First-Out (LIFO), on-time delivery (OTD), operation, service level, shop floor control, slack time.
disruptive technology – A term coined by Professor Clayton Christensen (Christensen 1997; Christensen and Raynor 2003) at Harvard Business School to describe a technological innovation, product, or service that eventually overturns the existing dominant technology in the market despite the fact that the disruptive technology is radically different than the leading technology and often has poorer performance (at least initially) than the leading technology.
The disruptive technology often starts by gaining market share in the lower price and less demanding segment of the market and then moves up-market through performance improvements and finally displaces the incumbent’s product. By contrast, a sustaining technology provides improved performance and will almost always be incorporated into the incumbent’s product.
Examples of displaced and disruptive technologies

In some markets, the rate at which products improve is faster than the rate at which customers can learn and adopt the new performance. Therefore, at some point the performance of the product overshoots the needs of certain customer segments. At this point, a disruptive technology may enter the market and provide a product that has lower performance than the incumbent technology, but exceeds the requirements of certain segments, thereby gaining a foothold in the market.
Christensen distinguishes between “low-end disruption” (that targets customers who do not need the full performance valued by customers at the high end of the market) and “new-market disruption” (that targets customers who could previously not be served profitably by the incumbent). The disruptive company will naturally aim to improve its margin and therefore innovate to capture the next level of customers. The incumbent will not want to engage in a price war with a simpler product with lower production costs and will move upmarket and focus on its more attractive customers. After a number of iterations, the incumbent has been squeezed into successively smaller markets. When the disruptive technology finally meets the demands of its last segment, the incumbent technology disappears. Some of the above information was adapted from http://en.wikipedia.org/wiki/Disruptive_technology (November 16, 2006).
See market share, nanotechnology, New Product Development (NPD), technology road map.
distinctive competence – See core competence.
distribution – (1) In the logistics context, management of the movement of materials from the supplier to the customer; also called physical distribution. (2) In the statistics context, a description of the range of values that a random variable can attain and information about the probability of each of these values. ![]()
In the logistics context, distribution involves many related disciples, such as transportation, warehousing, inventory control, material handling, and the information and communication systems to support these activities.
For information regarding the statistics context, see the probability distribution entry.
See distribution center (DC), distribution channel, distribution network, DRP, inventory management, logistics, reverse logistics.
distribution center (DC) – A location used to warehouse and ship products.
See Advanced Shipping Notification (ASN), cross-docking, distribution, Distribution Requirements Planning (DRP), distributor, logistics, warehouse, Warehouse Management System (WMS), wave picking.
distribution channel – The way that a product is sold and delivered to customers. ![]()
For example, a product, such as 3M sandpaper, might be sold through big box retailers, such as Home Depot, or through national distributers, such as Granger. Other products might be sold through retail grocery stores (e.g., Kroger), national grocery wholesalers (e.g., SuperValu), a company-employed national salesforce (e.g., IBM), or a company-owned Web-based channel (e.g., www.BestBuy.com). Firms in the channel are sometimes called channel partners, even though technically the business relationships are rarely partnerships.
See big box store, channel conflict, channel integration, channel partner, distribution, distribution network, distributor, logistics, supply chain management.
distribution network – The organizations, facilities, means of transportation, and information systems used to move products from suppliers of suppliers to customers of customers.
See distribution, distribution channel, logistics.
Distribution Requirements Planning (DRP) – A planning system for managing inventory in a distribution network; also called Distribution Resource Planning.
DRP is an extension of MRP for planning the key resources in a distribution system. According to Vollmann, Berry, Whybark, and Jacobs (2004), “DRP provides the basis for integrating supply chain inventory information and physical distribution activities with the Manufacturing Planning and Control system.”
DRP performs many functions such as:
• Managing the flow of materials between firms, warehouses, and distribution centers.
• Helping manage the material flows like MRP does in manufacturing.
• Linking firms in the supply chain by providing planning records that carry demand information from receiving points to supply points and vice versa.
DRP can use a Time Phased Order Point (TPOP) approach to plan orders at the branch warehouse level. These orders are exploded via MRP logic to become gross requirements on the supplying source enabling the translation of inventory plans into material flows. In the case of multi-level distribution networks, this explosion process continues down through the various levels of regional warehouses, master warehouse, and factory warehouse and finally becomes an input to the master production schedule.
See distribution center (DC), Enterprise Resources Planning (ERP), logistics, Materials Requirements Planning (MRP), warehouse, Warehouse Management System (WMS).
distributor – A wholesaler that buys, stores, transports, and sells goods to customers.
Distributors usually sell products made by others. However, it is common for distributors to conduct some limited “value-adding” operations, such as cutting pipes or packaging potatoes. Although distributors are considered customers for the manufacturer, they are not the end customer or consumer. It is wise for manufacturers to hear the voice of the customer from the consumer’s perspective and not just the distributor’s.
See broker, channel conflict, cross-docking, distribution center (DC), distribution channel, inventory management, logistics, supply chain management, wholesaler.
division of labor – Dividing a job into small, simple, standard steps and assigning one worker to each step.
Frederick Taylor (1911) promoted the concept of dividing work into small pieces so workers could quickly learn jobs without much training. Division of labor and standardization of parts led to rifles made by several people in the 1800s and the Model T Ford in the 1900s. Division of labor is the opposite of job enlargement, a practice that has workers take on more tasks rather than fewer.
In the last thirty years or more, many managers have found that taking division of labor too far can lead to boredom, does not develop the whole person, and does not build a learning organization. Division of labor also creates many queues and waits and requires more coordination and supervision. Thus, many process improvement projects enlarge jobs to remove queues and reduce cycle time.
On the other hand, some organizations report situations where processes can be improved by dedicating individuals or teams to certain process steps. For example, Mercy Hospital in Minnesota found that having a team of two people dedicated to the receiving process improved both quality and cost. Both vendor managed inventories and outsourcing can be viewed as examples of division of labor, where the work is divided into pieces that are done internally and other pieces that are done by other organizations. Division of labor is similar to value chain analysis that evaluates outsourcing and insourcing alternatives.
See delegation, human resources, job design, job enlargement, scientific management, standardized work, value chain.
diversion – The practice of selling products in unauthorized markets; also called parallel trade.
Gray (or grey) market resellers often acquire unwanted merchandise, overstocked products sold at a discount, obsolete products sold at a discount, and products intended for another market (such as an international market) and “divert” them to another market unintended by the manufacturer. In some cases, the practice is legal, but in other cases resellers engage in theft, counterfeiting, diluting, and misrepresenting the products. This is an issue for a wide variety of consumer products, such as health and beauty (hair products, cosmetics), pharmaceuticals, consumer packaged goods, beverages, music, auto, and electronics. In many cases, service is not available or the product warranty is invalid for gray market goods.
See gray market reseller.
DMADV – See Design for Six Sigma (DFSS), lean sigma.
DMAIC – A lean sigma problem-solving approach with five steps: Define, Measure, Analyze, Improve, and Control.
Lean sigma projects are usually managed with a five-step problem-solving approach called DMAIC (pronounced “Dee-MAY-ic”). These steps are described in the table below.

In many firms, the DMAIC process is “gated,” which means that the project team is not allowed to progress to the next step until the master black belt or sponsor has signed off on the step. In the new product development literature, this is called a phase review or stage-gate review. This author asserts that many DMAIC projects have too many gates that slow the project down. This author and many consultants now recommend having only two gates for a process improvement project: a midterm report to ensure that the team is on track and a final report when the project is complete (or nearly complete).
Most DMAIC projects find a number of “quick hits” early in the project. These should be implemented immediately and should be documented so the project sponsor and the program champion can capture and compare all project benefits and costs.
See deliverables, Design for Six Sigma (DFSS), Gauge R&R, kaizen workshop, lean sigma, PDCA (Plan-Do-Check-Act), phase review, quick hit, sigma level, sponsor, stage-gate process.
dock – A door and platform used to receive and ship materials, usually from trailers; also called a loading dock or receiving dock.
See cross-docking, dock-to-stock, logistics, trailer, warehouse.
dock-to-stock – The practice of moving receipts from the receiving dock directly to inventory without inspection.
Dock-to-stock eliminates the customer’s incoming inspection cost and reduces handling cost. However, it requires that suppliers assure good quality products.
See dock, incoming inspection, logistics, point of use, receiving, supplier qualification and certification, Warehouse Management System (WMS).
DOE – See Design of Experiments (DOE).
dollar unit sampling – An auditing technique for stratified sampling transactions that allows the auditor to make statistically reliable statements about the misspecification error.
The auditing profession has considered the problem of how to make statistically reliable statements about an audit when some transactions are more important than others and when the probability of a defect is very small. The best approach is an extension of stratified random sampling called dollar unit sampling. In the auditing literature, dollar unit sampling is also known as probability proportionate to size sampling and monetary unit sampling. Roberts (1978, p. 125) stated, “When the proportion of population units with monetary differences is expected to be small and the audit objective is to test for the possibility of a material overstatement, dollar unit sampling is the best statistical technique.” A dollar unit sampling audit enables the auditor to make statistical statements about the results of an audit, such as “Based on this audit, we are 95% confident that the total overstatement amount for this population is no more than $500.”
See confidence interval, Poisson distribution, sample size calculation, sampling.
dot-com – An adjective used to describe companies that sell products or services over the Internet.
Dot-com companies usually do not sell products or services through “brick-and-mortar” channels. Products are typically ordered over the Internet and shipped from warehouses directly to the customer. Services are typically information services provided through the Internet. Amazon.com and eBay.com are two of the bestknown dot-com firms. Dot-com firms can be either business-to-business (B2B) or business-to-consumer (B2C) firms. In some cases, dot-com firms can disintermediate traditional distribution firms.
See B2B, B2C, click-and-mortar, disintermediation, supply chain management.
double exponential smoothing – See exponential smoothing.
double marginalization – An economics term that describes a situation in which two firms in a supply chain have monopoly power and each producer adds its own monopoly mark-up to the price.
The price of the finished product is higher than it would be if the two producers were vertically integrated.
See economics.
double sampling plan – See acceptance sampling.
downstream – See upstream.
downtime – Time that a resource (system, production line, or machine) is not working; called an outage in the power generation context and a crash in the computer context.
Downtime is often separated into planned and unplanned downtime. Causes of planned downtime include:
Set-up – Adjustments required to prepare a resource to produce.
Start-up – The time from the end of set-up until the first good units are produced.
Cleaning – All activities required to remove materials and sanitize a process.
Changeover – Time to change from making the last unit of one product to the first good unit of the next.
Operational downtime – Production stoppages imposed by the process for equipment and quality checks.
Maintenance – Scheduled (preventive) maintenance activities.
Personal Time – Line stoppage for meal breaks, shift changes, meetings, and personal time.
Construction – Downtime for re-layout or building construction.
Causes of unplanned downtime include machine failure (followed by emergency maintenance) and quality problems that require the machine or line to stop.
The opposite of downtime is uptime. Service level agreements (SLAs) often specify guaranteed uptimes.
See capacity, operations performance metrics, Overall Equipment Effectiveness (OEE), reliability, Service Level Agreement (SLA), setup time, Total Productive Maintenance (TPM).
DPMO – See Defects per Million Opportunities (DPMO).
DPPM – See Defective Parts per Million (DPPM).
drop ship – A logistics term for a shipment that goes directly from the supplier to the buyer without the seller handling the product; often spelled dropship; sometimes called direct store shipment (DSD) or direct ship.
When a seller (typically a distributor or retailer) has a supplier (often a manufacturer or distributor) send a shipment directly to a buyer (customer), the order is drop shipped to the customer. The seller does not handle the product or put it in inventory. The supplier has little or no communication with the buyer. The buyer pays the seller and the seller pays the supplier. Drop shipments reduce the customer’s leadtime and the seller’s inventory handling cost, but usually increase the distribution cost because a small shipment (less than truck load) must be made to the customer. The term “drop ship” is sometimes also used to describe a shipment to a different location than the customer’s normal shipping location. Drop ship can be used as either a noun or a verb.
See distribution center (DC), logistics.
DRP – See Distribution Requirement Planning (DRP).
Drum-Buffer-Rope (DBR) – A Theory of Constraints (TOV) concept that sends a signal every time the bottleneck completes one unit, giving upstream operations the authority to produce. ![]()
DBR is a production control system based on the TOC philosophy. Like other TOC concepts, DBR focuses on maximizing the utilization of the bottleneck (the constrained resource) and subordinates all non-bottleneck resources so they meet the needs of the bottleneck.
Drum – Completion of one unit at the bottleneck is the drum that signals (authorizes) all upstream workcenters to produce one unit. The unconstrained resources must serve the constrained resource.
Buffer – A time cushion used to protect the bottleneck from running out of work (starving).
Rope – A tool to pull production from the non-bottleneck resources to the bottleneck. The DRB concept is very similar to the “pacemaker workcenter” concept used in lean manufacturing.
See CONWIP, lean thinking, pacemaker, POLCA (Paired-cell Overlapping Loops of Cards with Authorization), Theory of Constraints (TOC), upstream.
DSI – See The Decision Sciences Institute.
DSD – See drop ship.
DSM – See Design Structure Matrix.
dual source – The practice of using two suppliers for a single component; also called multiple sourcing.
Multiple sourcing is the use of two or more suppliers for the same component. Some people use the term “dual source” to mean two or more suppliers. This is in contrast to sole sourcing, where only one supplier is qualified and only one is used, and single sourcing, where multiple suppliers are qualified, but only one is used.
See single source.
due diligence – A careful evaluation done before a business transaction.
A common example of due diligence is the process that a potential buyer uses to evaluate a target company for acquisition. Wikipedia offers a very thorough discussion of this subject.
See acquisition, purchasing.
dunnage – Fill material used to minimize movement within a container to protect products being shipped.
Dunnage can be any packing material, such as low grade lumber, scrap wood, planks, paper, cardboard, blocks, metal, plastic bracing, airbags, air pillows, bubble wrap, foam, or packing peanuts, used to support, protect, and secure cargo for shipping and handling. Dunnage can also be used to provide ventilation and provide space for the tines of a forklift truck.
See logistics.
DuPont Analysis – An economic analysis that can be used to show the return on investment as a function of inventory and other economic variables.
Operations managers can use the DuPont Analysis to analyze the impact of changes in inventory investment on Return on Investment (ROI). The DuPont Analysis can be used to show how much (1) the carrying cost goes down when inventory goes down, (2) profit (return) goes up when the cost goes down, (3) investment goes down when inventory investment goes down, and finally, (4) ROI goes up dramatically as the numerator (return) goes up while the denominator (investment) goes down at the same time. This assumes that revenue is not affected by inventory, which may not be true for a make to stock firm unless the inventory reduction is managed very carefully. From an inventory management point of view, the DuPont Analysis is less important when interest rates and carrying charges are low.
A DuPont Analysis shows the sensitivity of the firm’s ROI to changes in input variables (drivers), such as inventory. (Note: Many organizations change ROI to an EVA or economic profit calculation.) This analysis is similar to a strategy map and a Y-tree because it shows the drivers of higher-level performance metrics.
The following is an example of a DuPont Analysis for a hypothetical firm.
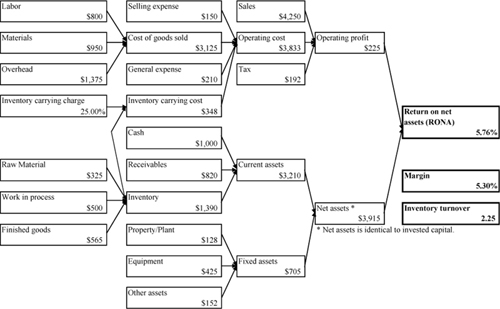
Source: Professor Hill’s Excel workbook DuPont.xls
See balanced scorecard, financial performance metrics, inventory turnover, Return on Net Assets (RONA), strategy map, what-if analysis, Y-tree.
DuPont STOP – A safety training program developed at DuPont.
The Safety Training Observation Program (STOP) is a widely used safety program that teaches workplace safety auditing skills, with steps to reinforce safe work practices and correct unsafe practices. STOP is based on the following principles:
• All injuries can be prevented.
• Employee involvement is essential.
• Management is responsible for safety.
• All operating exposures can be safeguarded.
• Safety training for workers is essential.
• Working safely is a condition of employment.
• Management audits are a must.
• All deficiencies must be corrected promptly.
• Off-the-job safety will be emphasized.
See Occupational Safety and Health Administration (OSHA), safety.
durability – A quality term used to refer to a product’s capability to withstand stress, wear, decay, and force without requiring maintenance; also called durable.
See durable goods, quality management, robust, service guarantee.
durable goods – Products that people keep for a long time and have useful lives of more than five years; also known as capital goods or hard goods.
Examples of durable products include cars, furniture, and houses. Durable goods can usually be rented as well as purchased. In contrast, non-durable goods are almost never rented.
See consumable goods, durability, Fast Moving Consumer Goods (FMCG), white goods.
Durbin-Watson Statistic – A statistical test for first-order autocorrelation (serial correlation) in time series data.
Autocorrelation is the correlation between a variable in one period and the previous period. For example, the weather temperature is highly autocorrelated, which means that the correlation between the weather in one day tends to vary with the weather on the previous day. If today is hot, then so is tomorrow.
The Durbin-Watson Statistic is used to test for first-order autocorrelation in time series data. It is most commonly used to test for autocorrelation in the residuals for regression models that deal with time series data. It is often also used to test for autocorrelation in the forecast error for a time series forecasting model. The term “error” (et) is used to mean either the residuals from a regression or the forecast error for a forecasting model.
The Durbin-Watson test compares the error in period t with the error in period t-1. The following equation is the Durbin-Watson test statistic  , where t is the time period, et is the residual in period t, and n is the total number of observations available. The statistic (d) is constrained to the range (0, 4) with a midpoint of 2. A value of d close to 2 suggests that the time series has no autocorrelation. A low value of d (close to zero) implies positive autocorrelation because the differences between et and et-1 are relatively small. A high value of d (close to four) implies negative autocorrelation because the differences between et and et-1 are relatively large.
The Durbin-Watson test can be used to test for both positive and negative autocorrelation. However, the null hypothesis is usually no significant autocorrelation and the alterative hypothesis is positive autocorrelation. Tables for the Durbin-Watson test can be found in many standard statistics texts, such as Kutner, Neter, Nachtsheim, and Wasserman (2004).
See autocorrelation, Box-Jenkins forecasting, linear regression, runs test, time series forecasting.
Dutch auction – An auction method where the price is lowered until a bidder is prepared to pay; also known as a descending bid auction.
In a Dutch auction, the auctioneer begins with the seller’s asking price and then lowers the price until a bidder is willing to accept the price or until a predetermined reserve price (the seller’s minimum acceptable price) is reached. The winning bidder pays the last announced price. The Dutch auction is named for the Dutch tulip auctions in the Netherlands.
See e-auction, e-business, e-procurement, reverse auction, sniping.
E
EAN (European Article Number) – See Universal Product Code (UPC).
earliness – See service level.
early detection – The quality management concept that it is better to find and fix defects early in a process.
See catchball, cost of quality, defect, Fagan Defect-Free Process, mixed model assembly, quality at the source, scrum, setup time reduction methods.
Early Supplier Involvement (ESI) – The collaborative product development practice of getting suppliers involved early in the product design process.
Good suppliers have core competences around their product technologies. Therefore, firms that involve their suppliers in product development at an early stage can take advantage of these core competencies and potentially reap financial and competitive rewards.
Companies that involve suppliers early report the following benefits: (a) reduced product development time, (b) improved quality and features, (c) reduced product or service costs, and (d) reduced design changes. Companies do best when they give suppliers the leeway to come up with their own designs rather than simply manufacturing parts to their customers’ specifications. Suppliers often have more expertise than their customers in their product technologies.
See concurrent engineering, JIT II, New Product Development (NPD).
earned hours – The labor or machine hours calculated by multiplying the actual number of units produced during a period by the standard hourly rate.
Efficiency is calculated as the ratio (earned hours)/(actual hours) during a period. For example, a workcenter has a standard rate of one unit per hour. It worked eight actual hours today, but earned ten hours (i.e., it produced then units). Therefore, the efficiency of this workcenter is (earned hours)/(actual hours) = 10/8 = 125%. Earned hours is similar to the practice of earned value management in project management.
See Earned Value Management (EVM), efficiency, productivity.
Earned Value Management (EVM) – A methodology used to measure and communicate the progress of a project by taking into account the work completed to date, the time taken to date, and the costs incurred to date.
Earned Value Management (EVM) helps evaluate and control task/project risk by measuring progress in monetary terms. EVM is sometimes required for commercial and government contracts. Under EVM, work is planned, budgeted, and scheduled in time phased “planned value” increments, constituting a cost and a schedule measurement baseline.
The description below applies EVM to a task; however, the same concept can easily be extended to an entire project. Time and material is spent in completing a task. If managed well, the task will be completed with time to spare and with no wasted materials or cost. If managed poorly, the task will take longer and waste materials. By taking a snap-shot of the task and calculating the Earned Value, it is possible to compare the planned cost and schedule with the actual cost and schedule and assess the progress of the task. When considering an entire project, it is possible to extrapolate the schedule and cost to estimate the probable completion date and total cost.
The basics of EVM can best be shown on an S-curve. In its simplest form, the S-curve is a graph showing how the task budget is planned to be spent over time. The three curves on the graph represent:
• Budgeted cost for work scheduled – The budgets for all activities planned.
• Actual cost of work performed – The actual costs of the work charged so far.
• Budgeted cost of work performed – The planned costs of the work allocated to the completed activities.
Earned Value is defined as the percentage of the project complete times the project budget. The schedule variance is the difference between the Earned Value and the budget. Cost variance is the difference between the Earned Value and the actual costs of the works.
The benefits for project managers of the Earned Value approach come from:
• Disciplined planning using established methods.
• Availability of metrics that show variances from the plan to generate necessary corrective actions.
See critical chain, earned hours, project management, work breakdown structure (WBS).
e-auction – A Web-based tool for making a market more efficient.
The best example of an electronic auction is the popular ebay.com. A reverse auction is where the buyer calls for bids for something from potential suppliers. For example, General Electric will notify a group of qualified suppliers that they are invited to participate in an electronic auction. The date and product specifications are defined by the buyer. At the time of the auction, the participating bidders assemble at a common Internet site and bid for the contract.
See Dutch auction, e-business, e-procurement, reverse auction, sniping.
EBITDA – Earnings Before Interest, Taxes, Depreciation, and Amortization; an indicator of a company’s financial performance calculated as revenue minus expenses (excluding tax, interest, depreciation, and amortization); sometimes called EBIDTA (Earnings Before Interest, Depreciation, Taxes, and Amortization).
EBITDA is an approximate measure of a company’s operating cash flow based on data from the company’s income statement. EBITDA is calculated by looking at earnings before the deduction of interest expenses, taxes, depreciation, and amortization. This measure of earnings is of particular interest in cases where companies have large amounts of fixed assets that are subject to heavy depreciation charges (such as manufacturing companies). Because the accounting and financing effects on company earnings do not factor into EBITDA, it is a good way to compare companies within and across industries. This measure is also of interest to a company’s creditors, because EBITDA is essentially the income that a company has free for interest payments. In general, EBITDA is a useful measure only for large companies with significant assets or a significant amount of debt financing. It is rarely a useful measure for evaluating a small company with no significant loans.
EBITDA is a good metric to evaluate profitability, but not cash flow. Unfortunately, however, EBITDA is often used as a measure of cash flow, which is a very dangerous and misleading thing to do because there is a significant difference between the two. Operating cash flow is a better measure of how much cash a company is generating because it adds non-cash charges (depreciation and amortization) back to net income and includes the changes in working capital that also use/provide cash (such as changes in receivables, payables, and inventories). These working capital factors are the key to determining how much cash a company is generating. If investors do not include changes in working capital in their analyses and rely solely on EBITDA, they may miss clues that indicate whether a company is losing money because it cannot sell its products.
See financial performance metrics, income statement.
e-business – The conduct of business over the Internet; sometimes used interchangeably with e-commerce.
Bartels (2000) defines e-commerce as using electronic network support for customer- and supplier-facing processes and e-business as using electronic network support for the entire business. Based on these definitions, he argues that e-business is more difficult that e-commerce because it involves integration e-commerce activities with back office operations such as production, inventory, and product development.
See B2B, B2C, back office, Dutch auction, e-auction, e-procurement, extranet, intranet, reverse auction, sniping.
ECO – See Engineering Change Order (ECO).
e-commerce – See e-business.
econometric forecasting – A forecasting method that considers a number of different leading economic indicators, such as disposable income and meals away from home, to make forecasts; also known as extrinsic forecasting.
Econometric models use leading indicators to make forecasts. For example, a sharp rise in the cost of gasoline may well be a good indicator (predictor) of an increased demand rate for fuel-efficient cars.
Most econometric studies use multiple regression models. For example, the Onan Division of Cummings Engine developed a regression model and found that fast-food sales and disposable income could be used to forecast the sales of recreational vehicles one quarter ahead.
See Box-Jenkins forecasting, forecasting, leading indicator, linear regression.
Economic Lot Scheduling Problem (ELSP) – A class of lotsizing problems that involves finding the optimal (or near optimal) order size (or cycle length) to minimize the sum of the carrying and ordering (setup) costs for multiple items that share the same capacity resource (the “bottleneck”).
Even though the problem has the word “scheduling” in its name, it is a lotsizing problem rather than a scheduling problem. This ELSP methodology can be implemented fairly easily for any manufacturing process that builds to stock and has a fairly level demand throughout the year. The procedure finds the optimal order intervals ni* (periods supply) for each item i. When the demand varies over time, it is better to use the periods supply than the order quantities. It may also be important to find the optimal safety stock for these order quantities, where the leadtime for each item is based on the order interval. The time phased order point system can then be used to determine order timing.
See algorithm, Economic Order Quantity (EOQ), lotsizing methods, run time, setup time.
Economic Order Quantity (EOQ) – The optimal order quantity (batch size or lotsize) that minimizes the sum of the carrying and ordering costs. ![]()
If the order quantity is too large, the firm incurs too much carrying cost; if the order quantity is too small, the firm incurs too much ordering (setup) cost. The EOQ model can help managers make the trade-off between ordering too much and ordering too little (Harris 1913, 1915; Wilson 1934). The EOQ finds the Fixed Order Quantity that minimizes the sum of the ordering and carrying costs.
Define D as the annual demand in units, Q as the order quantity in units, S as the order cost per order, i as the carrying charge per dollar per year, and c as the unit cost. A firm with a fixed order quantity of Q units and an annual demand of D units will have D/Q orders per year and a total annual ordering cost of (D/Q)S. The average cycle inventory14 is Q/2 units and the annual carrying cost is (Q/2)ic. Therefore, the total incremental annual cost is TIC = (D/Q)S + (Q/2)ic.
Taking the first derivative of the total incremental cost function and setting it to zero yields ![]() , which means that
, which means that ![]() . The second derivative of the TIC is 2DQ-3S, which is greater than zero for all Q > 0. This proves that the Economic Order Quantity
. The second derivative of the TIC is 2DQ-3S, which is greater than zero for all Q > 0. This proves that the Economic Order Quantity ![]() is the order quantity that has the global minimum total increment cost. Note that the optimal solution (the EOQ) will always be where the annual ordering and annual carrying costs are equal.
is the order quantity that has the global minimum total increment cost. Note that the optimal solution (the EOQ) will always be where the annual ordering and annual carrying costs are equal.
The graph below shows that the annual carrying cost increases with Q and the annual ordering cost decreases with Q. The optimal Q (the EOQ) is where the annual carrying cost and ordering cost are equal. In this example, the parameters are demand D = 1200 units, ordering cost S = $54, carrying charge i = 12%, and unit cost c = $50. The EOQ is 147 units and total annual carrying cost and total annual ordering cost are both $440.91, which means that the total incremental cost is $881.81.
The EOQ model is considered to be of limited practical value for three reasons. First, it is very difficult to estimate the four parameters in the model. As a joke, the EOQ can be written as ![]() . Second, even with perfect estimates of the four parameters, the total incremental cost function is usually flat near the optimal solution, which means that the total incremental cost is not sensitive to errors in the EOQ. Third, managerial intuition is usually good at finding the EOQ without the equation. It is fairly obvious to most managers that high-volume, expensive items should be ordered more often than low-volume inexpensive items.
. Second, even with perfect estimates of the four parameters, the total incremental cost function is usually flat near the optimal solution, which means that the total incremental cost is not sensitive to errors in the EOQ. Third, managerial intuition is usually good at finding the EOQ without the equation. It is fairly obvious to most managers that high-volume, expensive items should be ordered more often than low-volume inexpensive items.

On the positive side, the EOQ model has several benefits. First, it helps people get a better understanding of lotsizing issues and can help students and managers refine their thinking about the managerial economics of the lotsizing problem. Second, in some cases, the trade-offs can have significant economic impact, especially when accumulated over many items. Third, the EOQ model is the foundation for several other models, such as the quantity discount model and the Economic Lot Scheduling Problem (ELSP).
See ABC classification, aggregate inventory management, carrying charge, carrying cost, cycle stock, Economic Lot Scheduling Problem (ELSP), fixed order quantity, instantaneous replenishment, inventory management, lotsize, lotsizing methods, marginal cost, Period Order Quantity (POQ), quantity discount, safety stock, time-varying demand lotsizing problem.
Economic Value Added (EVA) – A financial performance metric for the true economic profit of an enterprise from the shareholders’ point of view; closely related to economic profit.
EVA is the net operating profit minus an appropriate charge for the opportunity cost of all capital invested in an enterprise. As such, EVA is an estimate of true “economic” profit, or the amount by which earnings exceed or fall short of the required minimum rate of return that shareholders and lenders could get by investing in other securities of comparable risk. The capital charge is the most distinctive and important aspect of EVA. Economic profit is similar to EVA, but is not adjusted in the same way as EVA.
Under conventional accounting, most companies appear profitable. As Drucker (1995) argues, “Until a business returns a profit that is greater than its cost of capital, it operates at a loss. Never mind that it pays taxes as if it had a genuine profit. The enterprise still returns less to the economy than it devours in resources ... Until then it does not create wealth; it destroys it.”
EVA corrects this error by explicitly recognizing that when managers employ capital, they must pay for it, just as if it were a wage. By taking all capital costs into account, including the cost of equity, EVA shows the dollar amount of wealth a business has created or destroyed in each reporting period. In other words, EVA is profit the way shareholders define it. If the shareholders expect, say, a 10% return on their investment, they “make money” only to the extent that their share of after-tax operating profits exceeds 10% of equity capital.
Stern Stewart & Company owns a registered trademark for the name EVA for a brand of software and financial consulting/training services. Their proprietary component makes adjustments related to amortization of goodwill, capitalization of brand advertising to convert economic profit to into EVA.
See financial performance metrics, goodwill.
economics – The social science that studies how people and groups (families, businesses, organizations, governments, and societies) choose to produce, distribute, consume, and allocate limited goods and services.
Economics deals primarily with supply and demand of scarce goods and services and how people and societies assign prices to these goods and services to allocate them in some rational way.
The word “economics” is from the Greek for house (![]() = oikos) and custom or law (
= oikos) and custom or law (![]() = nomos); in other words, economics is about the “rules of the house(hold).” (This definition from the Greek is adapted from http://en.wikipedia.org/wiki/Economics, February 26, 2008).
= nomos); in other words, economics is about the “rules of the house(hold).” (This definition from the Greek is adapted from http://en.wikipedia.org/wiki/Economics, February 26, 2008).
See demand, double marginalization, economy of scale, economy of scope, elasticity, opportunity cost, Pareto optimality, production function, sunk cost.
economy of scale – An economics principle that refers to situations where the cost per unit goes down as the production volume increases; also called economies of scale. ![]()
Stated in more precise terms from the field of economics, economies of scale is the decrease in the marginal cost of production as a firm’s scale of operations increases. Economies of scale can be accomplished because, as production increases, the cost of producing each additional unit falls. The increase in efficiency often comes by means of allocating the fixed costs over a larger number of units.
See big box store, commonality, core competence, cross-docking, diseconomy of scale, economics, economy of scope, marginal cost, mergers and acquisitions (M&A), network effect.
economy of scope – A concept from economics that states that the cost per unit declines as the variety of products increases. ![]()
In other words, economies of scope arise from synergies in the production of similar goods. A firm with economics of scope can reduce its cost per unit by having a wide variety of products that share resources. Scope economies exist whenever the same investment can support multiple profitable activities less expensively in combination than separately.
Economies of scope can arise from the ability to eliminate costs by operating two or more businesses under the same corporate umbrella. These economies exist when it is less costly for two or more businesses to operate under centralized management than to function independently. Cost savings opportunities can stem from interrelationships anywhere along a value chain.
See commonality, economics, economy of scale, mass customization.
ECR – See Efficient Consumer Response (ECR).
EDI – See Electronic Data Interchange (EDI).
effective capacity – See capacity.
effectiveness – Capability to produce a desired result, without respect to efficiency. ![]()
For example, the maintenance engineers in a milk plant found that a particular disinfectant was very effective in killing bacteria in a vat that was used to produce cottage cheese. However, if the disinfectant was very expensive and required significant time to apply, the firm might be able to find another more efficient approach that was equally effective. In summary, effectiveness is about getting the right job done and efficiency is about getting the job done using the minimum resources.
See efficiency, Overall Equipment Effectiveness (OEE).
effectivity date – The calendar date that an engineering change order for the bill of material (BOM) will come into effect; sometimes called the effective date.
Nearly ERP systems include software for managing the BOM. In addition to storing the current product structure, these systems are usually also able to store future product structures that will be implemented at some future date (the effectivity date). When the effectivity date is reached, the second structure comes into effect.
The effectivity date may be determined by the effectivity quantity. With an effectivity quantity, the engineering change comes into effect when the current inventory has fallen to zero or to a specified quantity. However, one problem with this approach is that the inventory position usually does not fall to zero instantaneously. When this is the case, the replenishment system may generate a new purchase order for the old item. A second problem is that the small quantity of remnant stock that remains may be uneconomical to use, leading to its scrap.
See bill of material (BOM), Engineering Change Order (ECO), Materials Requirements Planning (MRP).
effectivity quantity – See effectivity date.
efficiency – (1) Industrial engineering: The ratio of the standard processing time to the average actual processing time; a process that can perform at a very low cost compared to some standard. (2) LEI’s Lean Lexicon (Marchwinski & Shook 2006): Meeting exact customer requirements with the minimum amount of resources. (3) Economics: The amount of resource products per unit of resource consumed. (4) Finance: An efficient market is one that quickly and accurately incorporates information into prices. ![]()
The industrial engineering definition is the most widely accepted definition in the operations field. Efficiency is calculated as the ratio (earned hours)/(actual hours) during a period. For example, a workcenter has a standard time of one hour per unit. It worked eight actual hours today and earned ten hours (i.e., it produced then units). Therefore, the efficiency of this workcenter is (earned hours)/(actual hours) = 10/8 = 125%. Earned hours is similar to the practice of earned value management in project management.
The above economics definition is indistinquishable from the definition of productivity.
See 8 wastes, earned hours, effectiveness, operations performance metrics, Overall Equipment Effectiveness (OEE), productivity, standard time, utilization.
Efficient Consumer Response (ECR) – A consumer goods initiative aimed at reducing inefficient practices and waste in the supply chain.
Efficient Consumer Response (ECR) is an application of lean thinking to retail distribution, primarily in fast moving consumer goods supply chains. ECR is defined by the Joint Industry Project for Efficient Consumer Response (1994) as follows:
A strategy in which the grocery retailer, distributor, and supplier trading partners work closely together to eliminate excess costs from the grocery supply chain. ECR focuses particularly on four major opportunities to improve efficiency:
1. Optimizing store assortments and space allocations to increase category sales per square foot and inventory turnover.
2. Streamlining the distribution of goods from the point of manufacture to the retail shelf.
3. Reducing the cost of trade and consumer promotion.
4. Reducing the cost of developing and introducing new products.
See Collaborative Planning Forecasting and Replenishment (CPFR), continuous replenishment planning, Fast Moving Consumer Goods (FMCG), lean thinking, Quick Response Manufacturing.
eight wastes – See 8 wastes.
eighty-twenty rule – See Pareto’s Law.
e-kanban – See faxban.
elasticity – An economics term used to describe the sensitivity of the demand to a change in price.
For example, Target is a major discount retailer in North America. When the inventory analysts at Target want to clear (dispose) end-of-season inventory, they want to know the elasticity (sensitivity) of the demand to a reduced price. They use a linear model based on percentages that relates the percent increase in demand to a percent decrease in price (e.g., a 5% decrease in price will result in a 10% increase in the average demand).
The three main approaches for modeling the price-elasticity of demand include the linear model, the power model, and the exponential model. The linear model is D(p) = α − βp, where D(p) is the demand at price p and α and β are the parameters of the model to be estimated from historical data. The power model is D(p) = αp−β. The exponential model is D(p) = αe-βp. The β parameter is the elasticity parameter for all three models. All three models show that the demand decreases as the price increases. The linear model is the easiest to use, but the power and exponential models generally make more sense. For the power model, the demand is infinite when price is zero; for the exponential model, the demand is α when the price is zero. Therefore, the exponential model makes the most sense for most operations/inventory/pricing models.
See booking curve, demand, economics, forecasting.
Electronic Data Interchange (EDI) – A system and related set of standards that firms can use to communicate routine business transactions between computers without human intervention.
EDI transactions can include information for inquiries, planning, purchasing, acknowledgments, pricing, order status, scheduling, test results, shipping and receiving, invoices, payments, and financial reporting. The simplest form of EDI is to send purchase orders to suppliers. More advanced forms of EDI include sending invoices, electronic payments, and planned orders (requirements). The advantages of EDI include:
• Reduced transaction cost – Electronic transactions are cheaper than manual/paper ones.
• Reduced transaction time – Electronic ordering is nearly simultaneous, versus days or weeks for a manual/paper transaction sent via mail.
• Improved forecast accuracy – Forward visibility of the customer’s requirements can dramatically improve forecast accuracy. For many firms, this is the most important benefit.
• Improved data quality – Sending information electronically can improve quality because it eliminates almost all the human data entry from the process.
With the rapid growth of e-commerce, many expect that the phrase “EDI” will soon die. E-commerce will, of course, serve the same purposes as EDI and will have to include the same functionality.
See Advanced Shipping Notification (ASN), Enterprise Resources Planning (ERP), firm order, forward visibility, invoice, Over/Short/Damaged Report, purchase order (PO), purchasing, Transportation Management System (TMS), XML (eXtensible Markup Language).
Electronic Product Code (EPC) – A number used to identify products using RFI technology in a supply chain.
Like the Universal Product Code (UPC), the EPC is used to identify item numbers (SKUs) for products moving through a supply chain. Unlike the UPC, the EPC uses radio frequency (RFID) technology rather than Optical Character Recognition (OCR) technology and provides a serial number that can be referenced in a database. The serial number enables the specific item to be tracked as it moves through the supply chain.
The EPC number can be from 64 to 256 bits and contains at least the (1) EPC version, (2) company identification number assigned by EPCglobal, (3) product number (object class), and (4) unique serial number. A 96-bit EPC is capable of differentiating 68 billion items for each of 16 million products within each of 268 million companies. For example, an EPC can differentiate between the first and the thousandth can in a shipment of cans of soup.
See barcode, Optical Character Recognition (OCR), part number, Radio Frequency Identification (RFID), traceability, Universal Product Code (UPC).
Electronics Manufacturing Services (EMS) – See contract manufacturer.
emergency maintenance – See maintenance.
empathy – A service quality term that refers to the amount of caring and individualized attention shown to customers by the service firm.
According to Parasuraman, Zeithaml, and Berry (1990), empathy involves the provision of caring and individualized attention to customers that includes access, communication, and understanding the customer.
See service quality, SERVQUAL.
employee turnover – The average percentage of employees who exit a firm per year. ![]()
For example, the turnover for hotel staff is very high, often on the order of 100%. This means that the number of employees exiting a firm in a year (voluntarily or involuntarily) equals the number employed. Employee turnover can be greater than 100% (e.g., 200% employee turnover means an average tenure of six months). Employee turnover is a surrogate measure of employee satisfaction.
See inventory turnover, turnover.
empowerment – The practice of granting decision rights to subordinates.
Empowerment often helps people build confidence, develop self-reliance, and derive greater job satisfaction. In a service context, empowerment often results in better customer service because the workers closest to the customer can make better decisions on the customer’s behalf. Empowerment can also increase the absorptive capacity of an organization.
See absorptive capacity, customer service, High Performance Work Systems (HPWS), human resources, jidoka, job design, job enlargement, service quality.
EMS (Electronics Manufacturing Services) – See contract manufacturer.
energy audit – The process of inspecting and analyzing the energy use in a facility with the intention of reducing energy consumption, cost, and pollution while increasing safety and comfort.
An energy audit might consider issues such as repairing or replacing heating and cooling systems, insulation and weatherization, location of heating/cooling losses, safety, and comfort. These audits are often conducted by qualified inspectors who use benchmark data to support engineering analyses. Opportunities are often found with new lighting, better control systems, more efficient systems, and better use of solar and wind energy.
See carbon footprint, green manufacturing, sustainability.
engineer to order (ETO) – A customer interface strategy with engineering done in response to a customer order; sometimes called design to order. ![]()
Examples of engineer to order (ETO) products include custom-built homes, the space shuttle, plastic molds, and specialized capital equipment. With an ETO customer interface, engineering work usually needs to be done before any specialized components can be purchased or fabrication can begin. This means that ETO customer leadtime is the sum of the engineering, procurement, fabrication, assembly, packing, and shipping time.
Although some assemblies and components may be standard items stored in inventory, some items may be designed specifically to the customer’s order. Standard items do not need to be stocked unless their procurement leadtime is longer than the leadtime for the engineering effort. Purchase orders may be pegged (assigned) to specific customer orders. The ERP system may treat the engineering organization as a workcenter in the factory. Actual costing is used because many items are purchased or manufactured just for that one customer order.
In an ETO system, the main challenges are often in (1) making reasonable promise dates and keeping them up to date as the situation changes (ask any owners of a custom-built home if their home was completed on time), (2) managing Engineering Change Orders (ECOs) to support design changes, and (3) developing modular designs, where many of the components are standard with standard interfaces with other components that can be “mixed and matched” to meet a wide variety of customer requirements and reduce engineering time and effort.
See commonality, configurator, Engineering Change Order (ECO), make to order (MTO), mass customization, respond to order (RTO).
Engineering Change Order (ECO) – A request for a change in a product design; also called an engineering change request.
The Engineering Change Order (ECO) should include the reason for the change, level of urgency, affected items and processes, and an evaluation of the costs and benefits. The engineering change review board, with representatives from engineering, R&D, manufacturing, and procurement, evaluates the cost, benefits, and timing before an ECO is implemented. Improving the ECO process can be a good opportunity for improvement in many firms. ECOs tend to be complicated and error-prone. Most ERP systems allow the system to implement an ECO when the inventory position of the older component goes to zero.
See bill of material (BOM), effectivity date, engineer to order (ETO), Integrated Product Development (IPD), Materials Requirements Planning (MRP), version control.
engineering change review board – See Engineering Change Order (ECO).
Enterprise Resources Planning (ERP) – Integrated applications software that corporations use to run their businesses. ![]()
ERP systems typically handle accounts payable, accounts receivable, general ledger, payroll, Materials Requirements Planning (MRP), purchasing, sales, human resources, and many other interrelated systems. One of the key concepts for an ERP system is that the firm stores data in one and only one location. In other words, the organization has only a single database that all departments share. SAP and Oracle are the two main ERP systems vendors currently on the market.
ERP systems grew out of Materials Requirements Planning (MRP) systems that were developed in the 1970s and 1980s. The Materials Requirements Planning module in an ERP system supports manufacturing organizations by the timely release of production and purchase orders using the production plan for finished goods to determine the materials plan for the components and materials required to make the product. The MRP module is driven by the master production schedule (MPS), which defines the requirements for the end items. The three key inputs to the MRP module are (1) the master production schedule, (2) inventory status records, and (3) product structure records.
See Advanced Planning and Scheduling (APS), bill of material (BOM), Business Requirements Planning (BRP), Distribution Requirements Planning (DRP), Electronic Data Interchange (EDI), human resources, implementation, legacy system, Materials Requirements Planning (MRP), SAP, turnkey.
entitlement – A lean sigma term used as a measurement of the best possible performance of a process, usually without significant capital investment.
Entitlement is an important process improvement concept that is particularly useful in project selection. It is usually defined as the best performance possible for a process without significant capital investment. However, some firms define it as the performance of the perfect process. As the term implies, the organization is “entitled” to this level of performance based on the investments already made.
Knowing the entitlement for a process defines the size of opportunity for improvement. If entitlement is 500 units per day and the baseline performance is 250 units per day, the process has significant room for improvement. If higher production rates are needed, a search for a totally new process may be in order (i.e., reengineering or DFSS).
Entitlement should be determined for all key process performance measures (yield, cost of poor quality, capacity, downtime, waste, etc.). Entitlement may be predicted by engineering and scientific models, nameplate capacity provided by the equipment manufacturer, or simply the best prolonged performance observed to date.
Entitlement can also be predicted from empirical relationships. In one instance, it was observed that a process operating at a cost of $0.36/unit had at one time operated at $0.16/unit (correcting for inflation). This suggests that the process entitlement (as determined by best prolonged performance) should be $0.16/unit. On further investigation, it was observed that there was a linear relationship between defects and cost/unit of the form: Cost = $0.12 + 3(defects)/1,000,000. Therefore, if defects could be reduced to very low levels, the true process entitlement may be as low as $0.12/unit.
The following steps should be followed when using entitlement for project selection:
1. Look at the gap between baseline performance (current state) and entitlement (desired state).
2. Identify a project that will close the gap and can be completed in less than four to six months.
3. Assess the bottomline impact of the project and compare it to other potential projects.
The gap between the baseline and entitlement is rarely closed in the course of a single project. It is common for several projects to be required.
Keep in mind that process entitlement can, and often does, change as more is learned about the process. After a few lean sigma projects, processes are sometimes performing beyond the initial entitlement level.
See benchmarking, lean sigma.
EOQ – See Economic Order Quantity (EOQ).
EPC – See Electronic Product Code (EPC).
e-procurement – A Web-based information system that improves corporate purchasing operations by handling the specification, authorization, competitive bidding, and acquisition of products and services through catalogs, auctions, requests for proposals, and requests for quotes.
See acquisition, Dutch auction, e-auction, e-business, purchasing, reverse auction.
ergonomics – The scientific discipline concerned with the understanding of interactions among humans and other elements of a system and the profession that applies theory, principles, data, and methods to design to optimize human well-being and overall system performance; ergonomics is also called human factors. ![]()
Source: This is the approved definition of the International Ergonomics Association, www.iea.cc, representing 19,000 ergonomists worldwide, and was provided by Jan Dul, Professor of Ergonomics Management, Department of Management of Technology and Innovation, Rotterdam School of Management, Erasmus School of Business, Erasmus University, Rotterdam.
See error proofing, human resources, job design, process design.
Erlang C formula – See queuing theory.
Erlang distribution – A continuous probability distribution useful for modeling task times.
The Erlang is the distribution of the sum of k independent identically distributed random variables each having an exponential distribution with mean β.
Parameters: The shape parameter (k), which must be an integer, and the scale parameter (β).
Density and distribution functions: The Erlang density and distribution functions for x > 0 are:
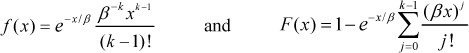
Statistics: Range [0, ∞), mean kβ, variance kβ2, and mode (k − 1)β.
Graph: The graph below is the Erlang density function with parameters β =1 and k = 1, 2, and 3.
Parameter estimation: Given the sample mean (![]() ) and sample standard deviation (s), the k parameter can be estimated as
) and sample standard deviation (s), the k parameter can be estimated as ![]() , where
, where ![]() is the sample coefficient of variation.
is the sample coefficient of variation.

Excel: In Excel, the density and distribution functions are GAMMADIST(x, k, β, FALSE) and GAMMADIST(x, k, β, TRUE).
Excel simulation: In an Excel simulation, Erlang random variates can be generated with the inverse transformation method using x = GAMMAINV(1-RAND(), k, β, TRUE). Alternatively, Erlang random variates can be generated by taking advantage of the fact that the Erlang is the sum of k independent exponential variates, i.e., 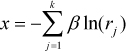 , where rj is a random number.
Relationships to other distributions: The exponential is a special case of the Erlang with k = 1. The Erlang distribution is a special case of the gamma distribution with parameters k and β, where k is an integer.
History: The Erlang distribution was developed by Danish mathematician A. K. Erlang (1878-1929) to examine the waiting times for telephone calls.
See coefficient of variation, exponential distribution, gamma distribution, inverse transform method, probability density function, probability distribution, random number.
ERP – See Enterprise Resources Planning (ERP).
error function – A mathematical function that is useful for dealing with the cumulative distribution function for the normal and lognormal distributions; also called the Gauss error function.
The error function is defined as error function is defined as  or
or  and of the complementary error function is defined as erfc(x) = 1 − erf(x). The normal distribution CDF is then
 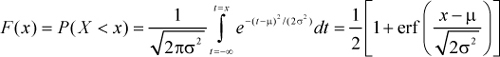 and the lognormal distribution CDF is
 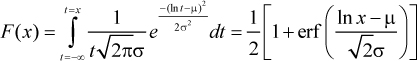 . Excel offers the functions ERF(z), ERF(z0,z1), and ERFC(z). The error function has no closed form, but numerical methods are available with as much precision as allowed by the computer. Winitzki (2003) developed useful closed-form approximations for both erf(x) and its inverse. The error function can also be computed from the gamma function.
See gamma function, lognormal distribution, normal distribution.
error proofing – The process of identifying likely causes of a failure and preventing the failure or at least mitigating the impact of the failure; also known as mistake proofing, fool proofing, idiot proofing, and fail safing, making fault tolerant and robust; the Japanese phrase “poka yoke” (![]() ) means to avoid mistakes.
) means to avoid mistakes. ![]()
Error proofing principles can improve both product and process design in all types of organizations. Ideally, error proofing devices are (1) simple and cheap, (2) deployed close to where the work is being done, and (3) result in what Shingo calls “100%” inspection and zero errors.
Product design – An error-proof product design can reduce errors to improve quality, efficiency, and safety in the manufacturing process and in the use of the product by the customer. For example, the gas fueling system in a typical automobile integrates different error proofing devices (see the photo below). The plastic tether keeps the gas cap from getting lost, the gas cap has a ratchet to signal proper tightness and prevent over-tightening, the filler hole is too small for the leaded-fuel nozzle, the gas cap has warning messages on it, and the fuel pump will shut off when the tank is full15.

Source: Professor Arthur V. Hill
Process design – An error-proof process design prevents errors in the process that produces goods or services. Error proofing can be applied to all types of processes to improve safety, which is a major issue in nearly all industries in all countries. In 2006, in the U.S., OSHA recorded 4,085,400 non-fatal workplace injuries and 5,703 fatal workplace injuries (source: www.bls.gov/iif/home.htm#News, December 7, 2007). Application of error proofing principles is the key to improving these sad statistics. Error proofing can also be applied to assembly operations to improve efficiency.
Error proofing methods can also be classified as either prevention or detection/warning. Whereas, prevention makes it impossible (or nearly impossible) for the error to occur, detection/warning only signals that an error is about to occur or has already occurred. For example, a microwave will not work if the door is open (a prevention device) and many cars will sound an alarm if the key is left in the ignition (a detection/warning device). Prevention methods can be further broken into three types:
1. Control – An action that self-corrects the problem, such as an automatic spell-checker that automatically corrects a misspelled word.
2. Shutdown – A device that shuts down the process when the error condition occurs, such as a home iron that shuts off after ten minutes of non-use.
3. Human factors – Use of colors, shapes, symbols, sizes, sounds, and checklists to simplify a process to make it less error-prone for human operators. An example is a shadow board for a tool, which is an outline of the tool painted on a pegboard to signal to the worker where the tool belongs. Another example is the use of symbols for hazardous materials. For example, the symbol on the right is for radioactive materials.

Detection/warning methods detect a problem and warn the operator when an error is about to occur or has already occurred. Unlike prevention methods, detection/warning methods do not control or shut down the system. A car’s oil light is a good example. Prevention is almost always better than detection/warning because detection/warning relies on human intervention and warnings can be ignored, whereas prevention is automatic without any human intervention.
Failure Mode and Effects Analysis (FMEA) is a more formal approach to error proofing and risk management. FMEA is a process used to identify possible causes of failures (failure modes) and score them, helping establish which failure modes should be addressed first. Business continuity planning applies error proofing concepts at a more strategic level.
See 5 Whys, adverse event, andon light, autonomation, Business Continuity Management (BCM), Business Process Re-engineering (BPR), checklist, ergonomics, fail-safe, Failure Mode and Effects Analysis (FMEA), fault tree analysis, Hazard Analysis & Critical Point Control (HACCP), inspection, jidoka, muda, multiple-machine handling, Murphy’s Law, Occupational Safety and Health Administration (OSHA), Pareto’s Law, prevention, process, process design, process improvement program, quality management, risk mitigation, robust, Root Cause Analysis (RCA), safety, sentinel event, service recovery, shadow board, stamping, work simplification.
ESI – See Early Supplier Involvement (ESI).
ethnographic research – An approach for gathering qualitative cultural and behavioral information about a group of people.
Ethnography is based almost entirely on fieldwork where the ethnographer goes to the people who are the subjects of the study. Ethnography studies what people actually say and do, which avoids many of the pitfalls that come from relying on self-reported, focus group, and survey data. Ethnographers sometimes live among the people for a year or more, learning the local language and participating in everyday life while striving to maintain objective detachment. Ethnographers usually cultivate close relationships with informants who can provide specific information on aspects of cultural life. Although detailed written notes are the mainstay of fieldwork, ethnographers may also use tape recorders, cameras, or video recorders. Ethnography is closely related to anthropology.
Businesses have found ethnographic research helpful in understanding how people live, use products and services, or need potential products or services. Ethnographic research methods provide a systematic and holistic approach so the information is valued by marketing researchers and product and service developers.
See voice of the customer (VOC).
ETO – See engineer to order.
Euclidean distance – See Minkowski distance.
EurOMA – See European Operations Management Association.
European Operations Management Association (EurOMA) – Europe’s leading professional society for operations management scholars and practitioners.
EurOMA was formed in the UK in 1984 and rapidly grew into Europe’s leading professional association for those involved in operations management. The Europe-wide European Operations Management Association was founded in October 1993. EurOMA is an international network of academics and managers from around the world interested in developing operations management. It is a European-based network, with rapidly developing international links, where people can get together to communicate experience and ideas. It is also a network that bridges the gap between research and practice. EurOMA publishes the International Journal of Operations & Production Management (IJOPM). The website for EurOMA is www.euroma-online.org.
See operations management (OM).
EVA – See Economic Value Added (EVA).
Everyday Low Pricing (EDLP) – A pricing strategy and practice designed to create a more level (more stable) demand by keeping prices at a constant low price rather than using sporadic temporary pricing promotions; closely related to value pricing.
EDLP often promises customers the lowest available price without coupons, pricing promotions, or comparison shopping. This practice tends to reduce the seller’s administrative cost to change prices and process coupons, reduce safety stock inventory (due to lower variability of demand), and increase customer loyalty.
See bullwhip effect, forward buy, safety stock.
executive sponsor – See champion.
expatriate – (1) Noun: A person who has taken residence in another country; often shortened to expat. (2) Verb:
To force out or move out a country.
The word “expatriate” comes from the Latin expatri![]() tus (from ex “out of”) and patri
tus (from ex “out of”) and patri![]() (“country, fatherland”). An expatriate is any person living in a country where he or she is not a citizen. The term is often used to describe professionals sent abroad by their companies. In contrast, a manual laborer who has moved to another country to earn money is called an “immigrant” or “migrant” worker.
(“country, fatherland”). An expatriate is any person living in a country where he or she is not a citizen. The term is often used to describe professionals sent abroad by their companies. In contrast, a manual laborer who has moved to another country to earn money is called an “immigrant” or “migrant” worker.
See offshoring, repatriate.
expedite – See expediting.
expediting – The process of assigning a higher priority to a job (order or task) so it gets started and done sooner; de-expediting is the process of assigning a lower priority to a job.
When priorities for jobs change, some jobs should be given higher priority. However, when all jobs are given a higher priority, expediting has no value. Schedulers should realize that expediting one job will de-expedite all other jobs. For example, when an ambulance comes down a highway with its lights and sirens on, all other vehicles must move to the side. Expediting the ambulance, therefore, de-expedites all other vehicles on the road at that time.
See buyer/planner, dispatching rules, job shop scheduling.
experience curve – See learning curve.
experience economy – See experience engineering.
experience engineering – The process of understanding and improving customer sensory and emotional interaction and reaction to a service or a product.
Two quotes highlight the main point of experience engineering:
• “Consumer preference and motivation are far less influenced by the functional attributes of products and services than the subconscious sensory and emotional elements derived by the total experience.” – Professor Gerald Zaltman, Harvard University, Procter & Gamble’s Future Forces Conference, Cincinnati, Ohio 1997 (Berry, Carbone, & Haeckel 2002).
• “We need to look at our business as more than simply the building and selling of personal computers. Our business is the delivery of information and lifelike interactive experiences.” – Andrew Grove, Chairman, Intel, 1996 COMDEX computer show (Pine & Gilmore 1998).
Joe Pine and James Gilmore, founders of the management consulting firm Strategic Horizons, wrote many of the early articles on this subject (Pine & Gilmore 1998). Pine and Gilmore used the term “experience economy” rather than the term “experience engineering.” They argue that economies go through four phases:
Producers can use each phase to differentiate their products and services. As services become commoditized, organizations look to the next higher value (experiences) to differentiate their products and services. Although experiences have always been at the heart of the entertainment business, Pine and Gilmore (1998, 1999) argue that all organizations stage an experience when they engage customers in personal and memorable ways. Many of the best organizations have learned from the Walt Disney Company and have found that they can differentiate their services by staging experiences with services as the stage and goods as the props. The goal is to engage individuals to create memorable events.
Pine and Gilmore (1999) offer five design principles that drive the creation of memorable experiences:
1. Create a consistent theme that resonates throughout the entire experience.
2. Reinforce the theme with positive cues (e.g., easy-to-follow signs).
3. Eliminate negative cues, which are visual or aural messages that contradict the theme (e.g., dirty floors).
4. Offer memorabilia that commemorate the experience for the user (toys, dolls, etc.).
5. Engage all five senses (sight, sound, smell, taste, and touch) to heighten the experience and make it more memorable (e.g., the fragrant smell of a great restaurant).
The website for Pine and Gilmore’s consulting firm, Strategic Horizons, is www.strategichorizons.com.
Carbone (2004), who coined the term “experience engineering,” presents two types of clues customers pick up in their customer experience – functional clues and emotional clues. These are compared in the table below.

Carbone argues that emotional clues can work synergistically with functional clues to create customer value. He further proposes that customer value is equal to the functional benefits plus the emotional benefits less the financial and non-financial costs. He concludes that organizations should manage the emotional component of their products and services with the same rigor that they bring to managing product and service functionality. Carbone’s firm, Experience Engineering, has a website at http://expeng.com.
See facility layout, mass customization, service blueprinting, service management, service quality.
expert system – A computer system that is designed to mimic the decision processes of human experts.
An expert system uses knowledge and reasoning techniques to solve problems that normally require the abilities of human experts. Expert systems normally have a domain-specific knowledge base combined with an inference engine that processes knowledge from the knowledge base to respond to a user’s request for advice.
See Artificial Intelligence (AI), knowledge management, turing test.
exponential distribution – A continuous probability distribution often used to model the time between arrivals for random events, such as a machine breakdown or customer arrival to a system; also known as the negative exponential distribution.
Parameter: The exponential distribution has only one parameter ( β ), which is the mean.
Density and distribution functions: The density and distribution functions for x > 0 are f(x) = (1 / β)e−x/β and F(x) = 1 − e−x/β.
Statistics: Range [0, ∞), mean β, variance β2, mode 0, and coefficient of variation c = 1. An indicator of an exponentially distributed random variable is a sample coefficient of variation (sample mean/sample standard deviation) close to one.
Graph: The graph below is the exponential density function with a mean of 1.
Estimating the parameter: The parameter (β) can be estimated as the sample mean.
Excel: In Excel, the exponential density and distribution functions are EXPONDIST(x, β, FALSE) and EXPONDIST(x, β, TRUE) and the equivalent Excel formulas are (1 / β)EXP(−x / β) and 1 − EXP(−x / β), respectively. Excel does not have an inverse for the exponential, but the Excel function GAMMAINV(p, β, 1) and the Excel formula −βln(RAND()) can be used for the inverse. In Excel 2010, EXPONDIST has been replaced by EXPON.DIST.
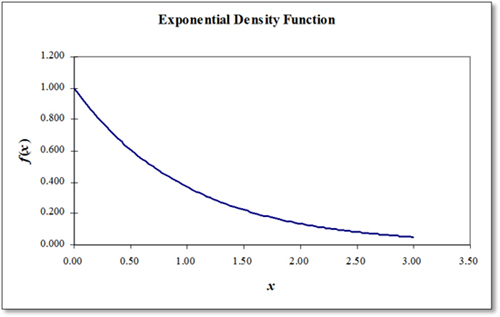
Excel simulation: In an Excel simulation, exponentially distributed random variates X can be generated with the inverse transform method using X = −βln(1 − RAND()). Note that the negative sign in this equation is correct because the natural log of a random number in the range (0,1] is negative. Note that RAND() is in the range [0,1), but 1 − RAND() is in the range (0,1], which avoids the possibile error of taking the natural log of zero.
Relationships to other distributions: The exponential distribution is a special case of the gamma, Erlang, and Weibull. The exponential distribution is the only continuous distribution that has the memory-less property (i.e., P(X > t + s | X > t) = P(X > s) for all t, s > 0).
See coefficient of variation, Erlang distribution, gamma distribution, inverse transform method, Poisson distribution, probability density function, probability distribution, queuing theory, random number, Weibull distribution.
exponential smoothing – A time series forecasting method based on a weighted moving average, where the weights decline geometrically with the age of the data; a graphical procedure that removes much of the random variation in a time series so that the underlying pattern is easier to see. ![]()
Exponential smoothing is a popular time series extrapolation forecasting technique. It can also be used as a data smoothing technique. The focus here is the use of exponential smoothing for forecasting.
An exponentially smoothed average is a weighted moving average that puts more weight on recent demand data, where the weights decline geometrically back in time. (Note: Technically, exponential smoothing should have been called geometric smoothing16.) With simple exponential smoothing, the smoothed average at the end of period t is the forecast for the next period and all other periods in the future. In other words, the one-period-ahead forecast is Ft+1 = At and the n-period-ahead forecast is Ft+n = At. Exponential smoothing can be extended to include both trend and seasonal patterns.
Simple exponential smoothing – The most basic exponential smoothing model uses a simple equation to update the exponentially smoothed average at the end of period t. The exponentially smoothed average at the end of period t is the exponentially smoothed average at the end of period t − 1 plus some fraction (α) of the forecast error. The constant α (alpha) is called the smoothing constant and is in the range 0 < α < 1. The updating equation can be written as At = At-1 + αEi, where the forecast error is Et = Dt − Ft and Dt is the actual demand (sales) in period t. The updating equation can be rewritten algebraically as At = At−1 + αEt = At−1 + α(Dt − At−1) = αDt + (1 − α)At−1.
This suggests that the new exponentially smoothed average is a linear combination of the new demand and the old average. For example, when α = 0.1, the new average is 10% of the new demand plus 90% of the old average. The At−1 term in the above equation can be defined in terms of the average at the end of period t − 2, i.e., At−1 = αDt−1 + (1−α)At−2. The equation for At−2 can be further expanded to show that At = αDt + (1 − α)At−1 = αDt + α(1 − α)Dt−1 + α(1 − α)2 Dt − 2 +...+ α(1 − α)k Dt − k. This means that the exponentially smoothed average at the end of period t is a weighted average with the weight for demand at lag k of α(1 − α)k. For example, when α = 0.1, the weight for the demand k = 5 periods ago is 0.1(1 − 0.1)5 = 0.059. These weights decline geometrically as the time lag k increases, which suggests that exponential smoothing should have been called geometric smoothing17.
Exponential smoothing with trend – When a trend component is included, the one-period-ahead forecast is Ft+1 = At + Tt, where Tt is the exponentially smoothed trend at the end of period t. The n-period-ahead forecast is then Ft+n = At + nTt. The apparent trend in period t is the change in the exponentially smoothed average from period t − 1 to period t (i.e., At − At − 1). The trend, therefore, can be smoothed in the same way as the average demand was smoothed using the equation Tt = β(At − At−1)+(1 − β)Tt−1, where β (beta) is the smoothing constant for the trend with 0 < β < 1. When a trend component is included, the updating equation for the exponentially smoothed average should be At = αDt + (1 − α)(At−1 + Tt−1). Exponential smoothing with trend is called double exponential smoothing because it is smoothing the difference between the smoothed averages.
Dampened trend – Gardner (2005) and others suggest that the trend be “dampened” (reduced) for multiple-period-ahead forecasts because almost no trends continue forever. The dampened one-period-ahead forecasting equation is then Ft−1 = At + ϕTt, where 0 ![]() ϕ
ϕ ![]() 1 is the dampening factor. For n-period-head forecasts, the equation is
1 is the dampening factor. For n-period-head forecasts, the equation is ![]() where ϕ < 1. The dampening parameter ϕ can be estimated from historical data.
where ϕ < 1. The dampening parameter ϕ can be estimated from historical data.
Exponential smoothing with seasonality – Exponential smoothing can be extended to handle seasonality by using a multiplicative seasonal factor. The one-period-ahead forecast is the underlying average times the seasonal factor (i.e., Ft+1 = At · R, where R is the multiplicative seasonal factor). The seasonal factors are generally in the range (0.3, 3.0), indicating that the lowest demand period is about 30% of the average and the highest demand period is about 300% of the average.
The one-period-ahead forecast is defined as Ft+1 = AtRt+1−m, where At is the underlying deseasonalized average and the multiplicative seasonal factor (Rt+1−m) inflates or deflates this average to adjust for seasonality. The seasonal factor for the forecast in period t+1 has the subscript t+1−m to indicate that it was last updated m periods ago, where m is the number of periods in a season. For example, m = 12 for monthly forecasts. The seasonal factor for a forecast made in January 2012 for February 2012 uses the seasonal factor that was last updated in February 2011. The n-period-ahead forecast with seasonality is then Ft+n = AtRt+1−m, where Ft+n is the forecast n periods ahead and Rt+n−m is the exponentially smoothed multiplicative seasonal factor for period t + n.
The updating equation for the deseasonalized smoothed average is At = αDt / Rt−m+(1 − α)At−1. Multiplying by Rt+n−m inflates or deflates for seasonality, so dividing by Rt+n−m deseasonalizes the demand. Therefore, the term Dt / Rt−m is the deseasonalized demand in period t. Seasonal factors can be smoothed using the equation Rt = γDt / At + (1 − γ)Rt−m, where Dt / At is the apparent deseasonalized demand in period t and γ (gamma) is the smoothing constant for seasonality with 0 < γ < 1.
Exponential smoothing with trend and seasonality – Exponential smoothing with trend and seasonality is known as the Winters’ Model (Winters 1960), the Holt-Winters’ Model, and triple exponential smoothing. The forecast equation is Ft+n = (At + nTt)Rt+n−m, where Ft+n is the forecast n periods ahead, Tt is the exponentially smoothed trend at the end of period t, and Rt+n−m is the exponentially smoothed multiplicative seasonal factor for period t + n. The equations for the Winters’ Model must be implemented in this order:
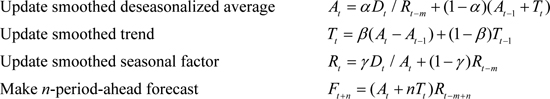
Forecasting lumpy demand – Exponential smoothing does a poor job of forecasting when the demand is “lumpy” (i.e., has many zeros between demands). A good rule of thumb is that an item with a coefficient of variation of demand greater than 1 has “lumpy” demand and therefore should not be forecasted with exponential smoothing methods. Croston (1972) suggests a method for forecasting the time between “lumps” and the size of the lumps, but few firms have used this approach. The best approach for lumpy demand is often to increase the size of the time buckets to avoid zero demand periods.
See Box-Jenkins forecasting, centered moving average, coefficient of variation, Croston’s Method, dampened trend, demand, demand filter, forecast error metrics, forecasting, geometric progression, lumpy demand, Mean Absolute Percent Error (MAPE), moving average, Relative Absolute Error (RAE), reorder point, seasonality, time bucket, time series forecasting, tracking signal, trend, weighted average.
eXtensible Markup Language – See XML.
external failure cost – See cost of quality.
external setup – Activities done to prepare a machine to run a new job while the machine is still running the current job; also called an off-line or running setup.
Whereas external setups are done while a process is running, internal setups are done while a machine is idle. Therefore, moving the setup time from internal to external reduces downtime for the process and reduces cycle time for work in process.
See internal setup, lean sigma, setup, setup time reduction methods.
extranet – The use of Internet/Intranet technology to serve an extended enterprise, including defined sets of customers or suppliers or other partners.
An extranet is typically behind a firewall, just as an intranet usually is, and closed to the public (a “closed user group”), but is open to the selected partners, unlike a pure intranet. More loosely, the term may apply to mixtures of open and closed networks.
See corporate portal, e-business, intranet.
extrinsic forecasting model – See forecasting.
extrusion – (1) A manufacturing process that makes items by forcing materials through a die. (2) An item made by an extrusion process.
Materials that can be extruded include plastic, metal, ceramics, foods, and other materials. Many types of products are created through an extrusion process, including tubes, pipes, noodles, and baby food. Most materials that pass through extruders come out in a long uniform solid or hollow tubular shape. Extrusions often require additional machining processes, such as cutting. The three types of extrusion processes are hot (850-4000F, 454-2204C), warm (800-1800F, 427-982C), and cold at room temperature (70-75F, 21-24C). Cracking is the most common problem with extrusion and can be caused by improper temperature, speed, or friction.