Word Lesson 5: Working with Tables

You can use the table design features in Word to build everything from a gridded web page layout to a 3˝ square monthly calendar. The Themes and quick formatting tools available in Office provide enormous flexibility in designing flexible, readable presentations of tabular data.
What you’ll learn in this lesson:
- • About several methods for drawing tables in your document
- • Entering, editing, and sorting alphanumeric table data
- • Formatting text in and around tables
- • Using AutoFit to create elegant table layouts automatically
Starting up
You will work with files from the Word05lessons folder. Make sure that you have loaded the OfficeLessons folder onto your hard drive from www.digitalclassroombooks.com/Office2013. If you need further instructions, see “Loading lesson files” in the Starting up section of this book.
The uses of tables
A table in Word is a matrix of rows and columns with optional column and row headings. There are two kinds of tables you might use: invisible grids used to line up elements of a design (such as the implied grid of a newspaper page), and visible grids meant to highlight a collection of structured data, such as a list of phone numbers appearing in a report. Gridded layout is a popular topic in graphic design, particularly web design, where rendering a page in an ever-changing browser window presents a variety of interesting technical and aesthetic problems; but graphic design is beyond the scope of this book. In this lesson, we’ll focus solely on tables that are meant to look like tables.
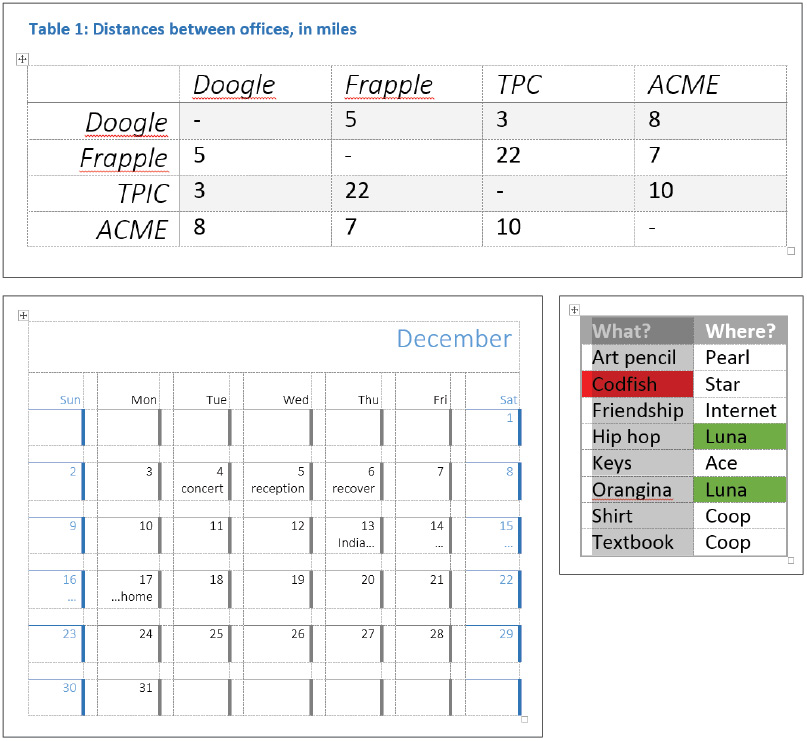
Examples of Word’s table formatting.
Table basics
Navigating tables fluently is a useful skill for anyone working with technical documents. We’ll create a few tables from scratch to practice maneuvering through them and making basic edits.
Inserting and navigating tables
A table is an object that can be placed, formatted, and moved just like any other object in Word 2013. But its internal dynamics make it a little more complicated than the average image or text box. We’ll start with the commands to insert and navigate tables.
1 Open Word 2013 and create a new blank document.
2 Choose File > Save As and navigate to the Word05lessons folder. Name the document word05_work and click Save.
3 Click Insert > Table. A drop-down grid appears. Drag your mouse over the grid until a 4 × 4 box is highlighted, and then click.
4 Place the cursor in one of the inner cells of the table and type This is a test of cell spacing. See how the cell stretches to fit?
5 Place the cursor in a different cell of the table. Insert a second 4 × 4 table inside the cell.
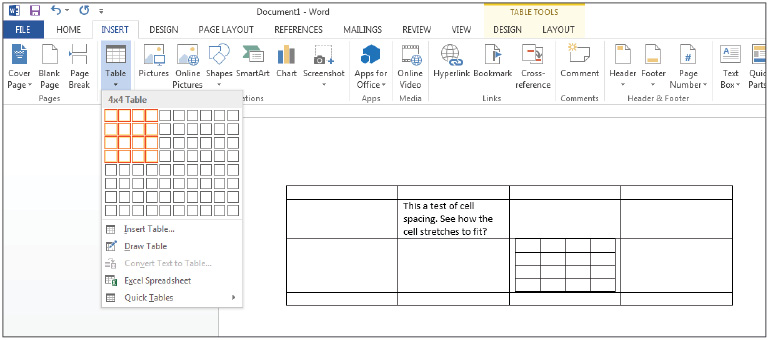
Live Preview lets you see the result of the Insert > Table command before you commit to adding the table.
6 Use the arrow keys to move right/left and up/down within the tables; then click in the smaller table and use the Tab key (and Shift+Tab) to navigate instead. Note that pressing Tab in the bottom-right corner of the table adds another row at the bottom.
This is an important but subtle difference: the arrow keys are for traveling around a table, while Tab is assumed to be used for editing the table.
Placing one table inside another is called nesting; if you insert a 3 × 3 table into a particular cell of a table, there will still be space within that cell but outside the nested table. You can create a similar structure by splitting one cell, which doesn’t create a new table as such, just a more complex region within the outer table.
Split cells and table styles
One key feature of a split cell, as opposed to a nested table, is that the contents of the split cell still inherit the formatting of the surrounding table. A nested table is formatted separately from the table where it’s embedded, as the following steps will demonstrate.
1 Click one of the cells of your nested table.
2 Click Table Tools > Layout > Merge > Split Cells. Set both columns and rows to 4, and click OK. The entire split cell, subdivided now into a 4 × 4 matrix, will be selected.
3 Click Table Tools > Design and select Grid Table 5 Dark - Accent 5 from the Table Styles gallery.
As you can see, the Table Style is applied not just to the selected cells (within the split cell), but to the nested table; yet the outermost table, the one you originally inserted into the blank document, doesn’t inherit this formatting.

Applying a Table Style to a nested table doesn’t affect the outer table.
4 Finally, select the cell where you inserted text (This is a test…) and split the cell into a 3 × 3 matrix.
The text is pushed into the upper left cell of the 3 × 3 matrix: our first exposure to the interaction of table and text, which we’ll explore in the next section.
5 Choose File > Save and then File > Close.
Working with text in and around tables
You can format text within a table just as you would in the wider space of your document. But the interaction between tables and text can be a little finicky. By default, a table placed with the Insert Table command sits in line with text, but by moving it on the page (or by placing text around it) you turn the table into a floating object, like an absolutely positioned image. The following steps will illustrate this change in behavior.
1 Open word05a.docx in your Word05lessons folder.
2 Choose File > Save As and navigate to the Word05lessons folder. Name the file word05a_work and click Save.
3 If you haven’t already done so, select Home > Paragraph > Show Hidden Characters.
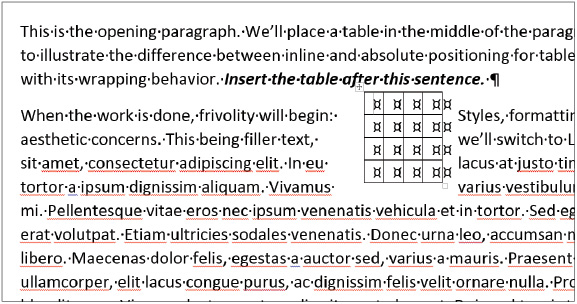
4 Place the cursor after the boldfaced sentence in the first paragraph. Insert a 4 × 4 table at that spot.
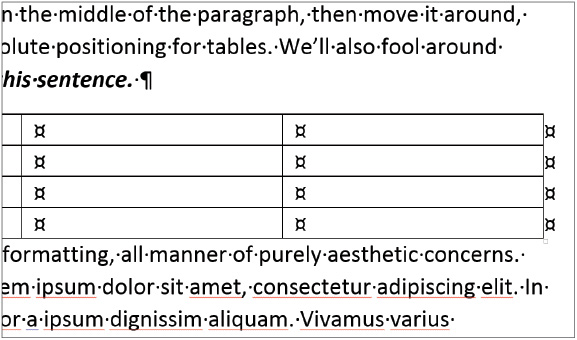
Inserting a table into a paragraph also adds a line break.
5 Drag the lower-right handle on the table to resize it; make it as small as possible.
Resizing the table has no effect on word wrapping; it’s in line with the text, and Word automatically leaves space below the table. But moving the table turns it into a floating object.
6 Select the table, either by mousing over it to reveal the Select Table handle in the upper left, or by clicking in one of the cells and then clicking Table Tools > Layout > Table > Select > Select Table. Drag it down and to the right, placing it in the center of the page.
Once a table has been moved, Word applies absolute positioning to it, like a floating text box or image.
Now that the table is a float, you can move it around the page much as you would any image or text box. To return it to inline layout, make a change in the Table Properties dialog:
1 Select the table, and then click Table Tools > Layout > Table > Properties.
2 In the dialog box, set Alignment to Left and Text Wrapping to None. Click OK.
Text alignment and merged cells
After learning how to move a table in the page and move around inside it, we’ll look at the tools Word has for altering a table’s internal geography. You’ve seen how to split cells; it’s easy to merge them as well, to create complex cell layouts.
1 Open word05a_work.docx if it is not already open and resize the table you inserted so that it’s about as wide as the text block using the handles that appear in the corner of the table when selected.
2 Click within the upper left cell, and drag to the right to select the first three cells in the top row.
3 Click Table Tools > Layout > Merge > Merge Cells.
4 Do the same with the four cells in the bottom right corner of the table: click and drag to select, and then Merge Cells.
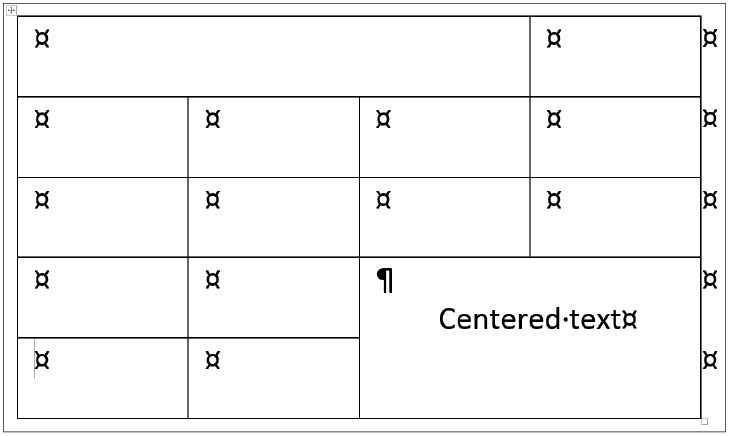
5 Place the cursor in the new large cell. Type Centered Text. Then open the Table Tools > Layout tab.
In the Alignment group is a 3 × 3 grid of icons, each corresponding to a different text alignment: top center, bottom right, and so on. Remember that text alignment is a paragraph formatting option; you can click inside the cell and set the text alignment without selecting individual characters.
6 Click the center text alignment icon, place the cursor in the first cell in row four, then slowly press Tab six times. Carefully observe how the cursor moves.
Merged cells sometimes behave a little oddly: you can reach the merged cell by tabbing in from the fourth or fifth row.
Remember that pressing Tab moves the cursor sequentially through the cells, left to right and top to bottom, until the last cell is reached, at which point Tab inserts a new row. (It doesn’t insert a Tab character as it would in a normal paragraph.) Word assigns the newly merged cell the position Row 4, Column 3; as you press Tab repeatedly, the cursor moves along the bottom row, back through the merged cell, then on to a brand new row. When you turned the 2 × 2 region into one cell, Word created an entity that’s a single column wide, but resides in two different rows.
Merging cells with the Eraser tool
There’s another way to merge cells: the Eraser tool, which eliminates cell borders unless it can’t, in which case it simply renders them invisible.
1 Select the Eraser tool (Table Tools > Layout > Draw > Eraser).
2 Click and drag from the large merged cell upward into the cell directly above it on the left. The top border of the merged cell becomes dotted, meaning it’s now a non-printing (invisible) border.

The Eraser tool merges cells if possible, but it can’t merge cells of different sizes, so it hides their shared border instead.
3 Now click and drag the eraser across the vertical line between the two cells above the Centered Text cell. These cells will merge and if they had content, it would be lost.
4 Finally, erase the dotted line between the two merged cells, creating a single empty cell the size of a 3 × 2 region.

The Eraser tool knocks down the walls between table cells.
As you can see, you can’t merge cells in a table unless their dimensions match; cells must merge horizontally to create a shared two-column southern border before they can merge vertically with the big cell below them.
5 Deselect the Table Eraser and choose File > Save or press Ctrl+S to save your changes.
Presenting and sorting tabular data
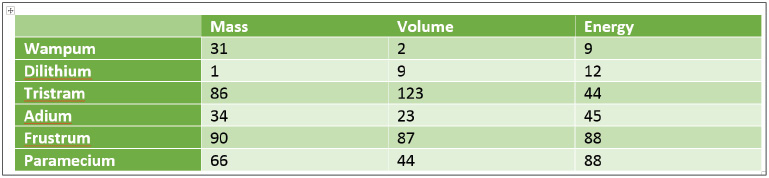
The most common use for tables is for presenting tabular data. Word treats the contents of a table as a kind of miniature database; it will handle each row as a single record, for instance, and can distinguish between records and column/row headings. Our current document contains a small table at the bottom of Page 1 that demonstrates these features: a list of fake chemical elements, along with (fake) Volume/Mass/Energy numbers for each.
The formatting applied to the table is another example of the difference between Word’s internal model of an object and its user-friendly visual presentation: this is a 4 × 7 table with a mix of text and numeric data, but because of the formatting, we immediately read it as six records, each of which attaches three data points to a name or label. Word’s table formatting tools let you approach a table either way.
Adding, deleting, and moving columns and rows
Since you can’t insert a single cell into the middle of a table without repositioning the columns and rows around it, Word provides hooks to let you manipulate tables by row and by column. We’ll alter our chemical data in a handful of ways to see how these tools work: we’ll reorder the columns, delete a record, and insert another.
1 Click the upper border of the Volume column; the entire column is selected. (As you mouse over the top border, the pointer should change to a downward-pointing arrow.)
2 Click and drag the column heading to the right and place it in the space between the Mass and Energy columns. The new column order is: Mass, Volume, Energy.
3 Click inside the margin to the left of the Beryllium cell; the entire row is selected. Press Delete; the data in the row will vanish, but the empty cells will remain.
4 Press Ctrl+Z to Undo, restoring the Beryllium data. Then, with the row still highlighted, press Backspace. The row itself will vanish.
Word splits the functions of the Backspace and Delete keys to make a distinction, respectively, between altering the table itself (the size of the database) and altering the contents of a single record. The same behavior occurs when you select a single cell by triple-clicking inside it: you can Delete the data within the cell or Backspace to alter the table grid itself.
Now let’s add a replacement record: you can squeeze a record into a table in a couple of ways.
5 Click the word Paramecium. Note that the Table Tools > Layout tab offers a number of icons to Insert Rows and Columns next to the selected cell.
6 Instead, mouse over a space just below and to the left of the Paramecium cell. A small icon with a plus sign appears.

Inserting a row into a table.
7 Click the Add Row icon to add an empty row. The entire row is automatically selected; if you begin typing, Word will insert text into the first cell of the row. Type Wampum (press tab), 31 (press tab), 2 (press tab), 9 to populate the row.
Sorting data in a table
As with a database, you can sort the entire contents of a table using one or more columns as keys; for instance, sorting a list of phone numbers by last name, and then first name. We’ll sort our table by Energy value (lowest to highest), and then sort Volume from highest to lowest within that ordering.
1 Change the Energy value of the Frustrum record to 88.
2 Click anywhere in the table, and then click Table Tools > Layout > Data > Sort.
3 In the dialog box, Sort By: Energy (Ascending), and Then By: Volume (Descending). Click OK.
Sorting our chemical info; the sorted data.
If you wanted to sort a single column of data without altering the entire table (in other words, if the table did not contain records as such, just discrete columns) you could do so by selecting the whole column, clicking the Options button in the Sort dialog box, and then selecting the Sort column only check box. Note that after doing so, you could treat the resulting table as a database again; be sure to keep track of the changes you’ve made to your data!
Designing tables
Word 2013 provides a large assortment of Table Styles available from a gallery in the Table Tools > Design tab. Word stocks the gallery with Styles based on the features you select in the Table Style Options group: you decide how your table should be structured, and Word suggests combinations of cell shading, border design, font choices, and so forth. Best of all, once you’ve chosen a Table Style, Word will modify it if you change the Style Options you want.
Table style options
The Table Style Options group includes six check boxes. You can mouse over each check box to get a Tooltip explaining what it does. To see how the various options affect a table’s design, start with very basic formatting and iterate through a series of changes.
1 Click anywhere in the chemical data table and navigate to the Table Tools > Design tab. Open the Table Styles gallery and choose Clear (at the bottom of the gallery).
2 Uncheck all six boxes in the Table Styles Options group. Your table appears without any formatting.
3 From the Styles gallery, select Grid Table 2 (in the Grid Styles section).
4 Click the various Table Styles Options in turn, in various combinations; in particular, try combining Banded Rows and Banded Columns to see how those options conflict.
Our chemical data table suggests a specific set of options: the row and column labels should be set off, and since we’re treating the data in terms of records, it makes sense to differentiate table rows rather than columns.
5 Select the chemical data table. Check only the Header Row, First Column, and Banded Rows boxes. Open the Table Styles gallery and notice the styles change to reflect the Style options.

The Table Styles gallery repopulates to reflect our choice of Style Options.
Applying a table style
After choosing the right Table Styles Options for our data set, we can select a Table Style from the gallery to provide the right visual emphasis. The Grid and List Table Styles vary widely in the intensity of their row/column highlighting and how much emphasis they place on row/column labels. You can experiment with a variety of Table Styles to see how they respond to the constraints you applied in the Table Styles Options group.
1 Select Grid Table 3 – Accent 2 from the Table Styles Gallery.
Choosing a Table Style affects the selected table’s fonts, colors, shading, and borders. You can change these features individually by right-clicking the Table Style in the gallery and choosing Modify Table Style from the drop-down menu. The options on this screen should be familiar by now, with the exception of the border design options, which we’ll cover in the next section.

The Modify Table Style dialog lets you alter the Table Style using your document’s Theme Colors.
One thing to note on this screen: the border and cell color options are inherited from the document theme; this is another example of how Office 2013 strives for visual consistency across applications and documents. You can now click Cancel to close this dialog box.
Setting cell and table borders
A cell has three parts: its fill (background color), content (text/images), and border. A cell border is actually four individual segments; you can specify visibility, style, and color for each segment, or handle them all together, cell by cell. Cell borders are set by column/row according to the Table Style, but you can customize them easily.
1 Place the cursor in the Volume cell of the Dilithium row.
2 Open the Borders drop-down menu (Table Tools > Design > Borders > Borders) and select No Border.
3 Click and drag to select the Volume cells for Adium and Frustrum; click the Borders icon, which is still set to its last use (No Border).
The borders of the cells you’ve selected fall away. As you can see in the Borders drop-down menu, you can choose from a variety of border shapes, including diagonal lines.
4 Click and drag to select the data cells (excluding the row/column labels). From the Borders menu, select No Border, and then click to enable Inside Borders. The outer edges of the table will lose their borders, but inter-cell borders remain.
The terms outside and inside refer to your current selection; if you select multiple contiguous cells, Word can differentiate between the outer border of the shape they make together, and the borders between the region’s individual cells. If you click within a single cell, there is no inside to speak of, so for that cell alone, the All Borders and Outside Borders options are equivalent.
Resizing a cell (or rather, its entire row or column) is straightforward: just drag the border in question.
Using the Border Painter tool
You can also use the Border Painter tool (the opposite of the Eraser tool) to draw in individual borders; the Painter takes its color and line information from the options you select in the Borders group.
1 Open the Table Tools > Design tab.
2 From the Line Style drop-down menu, select the double squiggly line style.
3 Select Purple from the Pen Color palette, under Standard Colors.
4 Make sure the Border Painter icon is selected, then click and drag various cell and table borders to paint those borders in the selected style, weight, and color.
5 Change the Line Style to a double line style and apply this border style to various cells.
Unlike the Eraser tool, the Border Painter requires precise placement: you drag along a border to paint, rather than across it, so your initial click has to land right on the border to be recognized. For that reason, it’s good to use the Zoom slider, on the Status Bar, when painting cell or table borders.

The Border Painter lets you add lines in a variety of styles, colors, and weights.
Editing cell contents
After playing with cell and table borders, we can move on to fills and text. Fills are straightforward: they’re just background colors. To change the background color of a cell, select it, and then click Table Tools > Design > Shading. The drop-down palette includes the usual theme colors; clicking the paint icon fills the cell with the selected color.
Cell text and manual cell sizing
Text formatting within tables is also straightforward; you still use the paragraph/character formatting tools in the Home tab, combined with the cell sizing, alignment, text direction, and margin tools in the Table Tools > Layout tab. We’ll add some text to our chemical info table and do some basic formatting.
1 Continue using word05a_work.docx and click to drag the border between the Volume and Energy columns to the left, until the Volume cell is just big enough to contain its heading.
2 In the Dilithium Volume cell, type the words 9 cubic liters, measured by ANS. The column will stretch horizontally to fit the word measured, and will stretch vertically to include the full entry.
3 Triple-click the new text and chose Italics from the formatting popup. Then click Bullets in the pop-up menu.
The formatting commands work just as usual, with the added wrinkle of the cell borders shifting slightly around the text. Word started by trying to evenly distribute the four columns, but the column distribution changed when we resized the Volume column.
4 Right-click within the cell you just edited and choose Table Properties. Click Column and if not already selected, choose Percent in the Measure in drop-down menu. Word is currently trying to apportion 10% of the table’s width to Column 3 (Volume). Click OK.
 If you need a given column or row to have a specific absolute size (for example, 2˝ wide), you can set its size in this dialog box.

Setting absolute and relative column/row sizes in the Table Properties dialog box.
5 With the same cell selected, click Table Tools > Layout > Alignment > Text Direction three times to cycle through the possible orientations for table text.
Note that Word doesn’t stretch the column to fit the sideways text entirely into the cell.
6 With the Volume Dilithium cell still selected, type 9. Remove the italics and bullet point.
7 Finally, click Cell Size > Distribute Rows and Distribute Columns to even out the cell spacing.
Distribute Rows and Distribute Columns space the table’s rows and columns evenly; if you select multiple rows and Distribute Rows, Word will apportion their current vertical space evenly, but won’t even out the whole table.
All these commands involve working within a rigid table shape and size. But how do we adjust size and proportions dynamically to the table’s contents? By using the AutoFit feature of Word.
8 Choose File > Save or press Ctrl+S to save your work.
Using AutoFit and Fit Text
The AutoFit tool aims to let you specify general table-sizing behavior without fiddling with absolute sizes or manually tweaking column proportions. By default, a new table will AutoFit Window; it’ll stretch between the left and right margins, and stretch and squeeze internally (without changing width) as you change the number of columns. If you manually resize the table, you disable that behavior.
1 Click anywhere in the table, and select Layout > Cell Size > AutoFit > Autofit Window. The table stretches to full width.
2 Click Autofit Contents. The left-hand column will be widest, then Volume. The Mass column, with its short header, will be narrowest.
3 Click Distribute Columns found in the same Cell Size section of the Layout tab. The left-hand column becomes a jumble, as the labels no longer fit.
4 Click Autofit Contents again to fix the row labels. Select the Mass, Volume, and Energy columns, and click Distribute Columns; now the column headings are too big.
5 Finally, click AutoFit Contents once more.
AutoFit Contents chooses the same optimally efficient spacing every time; because Distribute Columns applies to a subset of the columns, it can produce variable results.
 It’s possible to evenly distribute only the data cells in our table—in which case the headings will be out of sync with the data columns. Reverting to AutoFit Contents will fix this error.
6 Choose File > Save or press Ctrl+S to save your work.
It’s worth mentioning one last table text formatting option: Fit Text, which is enabled from the Table Properties dialog box, Cell tab, behind the Options button. Enabling Fit Text will fix the cell’s size, and progressively squash or stretch the text to fit inside it. It tends to adversely affect readability, which is occasionally necessary to fit data to a table’s structure.

Using Fit Text forces the contents of a cell to squash and stretch.
Images in tables
Images in tables behave exactly like images outside of tables. You can even drag an image in and out of a table as if moving it around the page’s object layer. To avoid complications, always choose the In Line with Text layout option (enabled by default when you Insert Image).
Self study
1 Experiment with restructuring, reformatting, and repopulating a table.
2 Try generating a blank chessboard using a table and some smart cell shading; then download clip art of the pieces in a chess set and create a diagram of a game in progress, resizing the cells to the clip art.
Review
Questions
1 Which Ribbon groups contain tools to format text within a table?
2 Which command changes the background color of a table cell?
3 What happens when you select some (not all) of the columns in a table and click Distribute Columns?
Answers
1 Table text formatting tools are found under Home > Font and Paragraph, and Table Tools > Layout > Alignment.
2 You can change the cell background with Table Tools > Design > Table Styles > Shading.
3 When you select some (not all) of the columns in a table and click Distribute Columns, the selected columns are resized to have equal widths, without affecting the size of the table.