
Creating Your First Dashboard
As explained earlier, a PPS Dashboard is a container for displaying reports and scorecards, organized in a meaningful way that makes sense to business users and decision-makers. Hence the creation of a dashboard effectively involves planning and creating individual dashboard elements (that is, reports and scorecards) and deploying the dashboard to SharePoint.
At a higher level, to create a PPS dashboard, you need to perform the following tasks, in this sequence:
1. Create a new data source; say, pointing to the Adventure Works cube.
2. Create one or more scorecards and/or reports.
3. Create a dashboard and add the scorecards and reports to it.
4. Deploy the dashboard to SharePoint.
The Try It Yourself section next explores these steps further, by creating a dashboard based on the Adventure Works cube deployed earlier.
Try It Yourself: Create a PerformancePoint Services Dashboard
1. Launch the Dashboard Designer and make sure that you are connected to the BI Center site by examining the URL displayed in the bottom left corner of the Dashboard Designer. You can connect to a different site by clicking the URL and entering the new URL in the Options dialog box, as shown in Figure 23.9.

Figure 23.9. Connecting to the Business Intelligence Center site
2. Create a new data source by right-clicking on the Data Connection folder and selecting the New Data Source option, as shown in Figure 23.10.

Figure 23.10. Creating a new data source
3. Select Analysis Service from the next screen and configure the values for the Server, Database, and Cube properties, as illustrated in Figure 23.11. This creates a new connection to the Adventure Works cube you downloaded and deployed earlier as a part of the Adventure Works database samples.

Figure 23.11. Configuring the new data source
4. Click the Test Data Source button to verify the connectivity.
5. Rename the New Data Source to Adventure Works.
6. Now that the data source is created, create a scorecard. Right-click the PerformancePoint Content and select Scorecard from the various options under the New button, as shown in Figure 23.12.

Figure 23.12. Creating a new scorecard
7. Select Analysis Services as the scorecard template and click OK.
8. Select the Adventure Works data connection from the next screen and click Next.
9. Select the Create KPIs from SQL Server Analysis Services Measures from the next screen.
10. Click the Add KPI button a couple of times to add KPIs to your scorecard, as shown in Figure 23.13, and click Next.

Figure 23.13. Adding KPIs to a scorecard
11. Do not check the Add Measure Filters check box and click Next.
12. Do not check the Add Column Members check box and click Next.
13. Leave the location for KPI creation as the default.
14. Click Finish to complete the scorecard creation wizard.
15. Rename your scorecard to AdventureWorksScorecard. Your scorecard should be similar to the one shown in Figure 23.14, depending on the number of KPIs you added to it.

Figure 23.14. Adventure Works Scorecard
16. Next create a new Report. Again right-click PerformancePoint content and select Report from various options under the New button.
17. Select Analytic chart as the report template and click OK. Again select the Adventure Works Data Connection and click Finish. Wait for the new report to be created.
18. Rename the report to Analytic Chart Report, as illustrated in Figure 23.15.

Figure 23.15. Creating the Analytic Chart Report
19. As indicated by the message in red, next you need to drag and drop measures, dimensions, or named sets from the Details window on the right to generate the chart. Drag and drop the Customer dimension into the series area, the Geography dimension into the Bottom Axis area, and the Internet Sales measure into the Background area to generate a bar chart, as illustrated in Figure 23.16.

Figure 23.16. Adding dimensions and measures to generate the bar chart
20. You can drill down the bar chart by either clicking the blue bar or right-clicking and selecting the drill down option. Drilling down generates a chart for different countries, as shown in Figure 23.17.

Figure 23.17. Drilling down to view the analytic chart for countries
If you are not happy with the bar chart and want a different chart type, right-click an empty area in the chart. You can select a different chart type (say a pie chart) from the Report Type context menu option. Further, you can specify the location of the legend or whether to display the legend under the Format Report context menu option.
21. Finally create a dashboard, add the analytic chart and report to it, and deploy the dashboard to SharePoint.
22. Right-click the PerformancePoint Content and select the New Dashboard option.
23. From the Dashboard Page Template Selection screen, select the 2 Columns template, as shown in Figure 23.18 and click OK.

Figure 23.18. Selecting a template for the PPS dashboard
24. Rename the dashboard to Adventure Works Dashboard.
25. Drag and drop the Adventure Works Scorecard and Analytic Chart Report on to the dashboard as shown in Figure 23.19.

Figure 23.19. Adding the scorecard and report to the dashboard
26. Now right-click the dashboard and select the Deploy to SharePoint option, as shown in Figure 23.20.

Figure 23.20. Deploying the dashboard to SharePoint
Select the dashboard to be deployed in the Dashboards folder, using the default master page. The PPS Dashboard Designer does the rest of the work for you. Once the dashboard is deployed, you should be able to view it in the web browser, as shown in Figure 23.21.
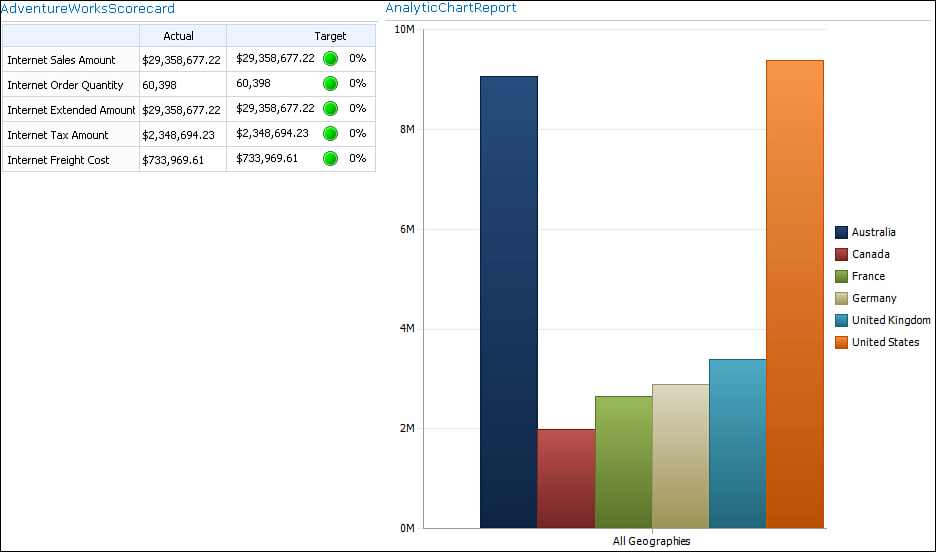
Figure 23.21. Dashboard opened in the web browser
Next have a look at a new feature in SharePoint 2010 called decomposition tree. A decomposition tree provides an interactive way to explore hierarchies and contribution relationships. For example, right-click any bar in the analytic chart and select the Decomposition Tree option, as shown in Figure 23.22.

Figure 23.22. Viewing the decomposition tree
This brings up a new dialog window with an arrangement of horizontal bar charts, as shown in Figure 23.23. You can click the + symbol next to any of the bars to further drill down to the next level interactively or perform root cause analysis.

Figure 23.23. Exploring a decomposition tree