Troubleshooting and Monitoring Performance with the Developer Dashboard
Hour 3 talked about the usefulness of the developer dashboard for diagnosis and troubleshooting server side code. The developer dashboard provides a number of performance counters and diagnostic information sections and can be set up in few simple steps. This section looks at some of the advanced concepts related to the developer dashboard, including creating custom monitored scopes and working with performance counters.
Try It Yourself: Troubleshoot with the Developer Dashboard
1. Create a web part called DevDashBoardDemo to demonstrate some of the advanced debugging and monitoring features provided by the developer dashboard.
2. Add the following code to the web part:
private void UsingDisposedObject()
{
SPList list = null;
using (SPSite site = new SPSite("http://splearn"))
{
using (SPWeb web = site.RootWeb)
{
list = site.RootWeb.Lists[0];
}
}
// Attempting to access the list title when
// SPWeb and SPSite objects have been disposed
string listTitle = list.Title;
}
Clearly, we are trying to get the list title, after the parent SPWeb and SPSite objects have been disposed.
3. Deploy the web part and enable the developer dashboard on the page.
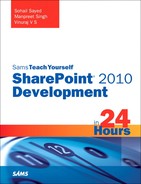
4. Once the developer dashboard is enabled, we receive an Unexpected General error message in the Asserts and Critical Events section, as shown in Figure 7.10.
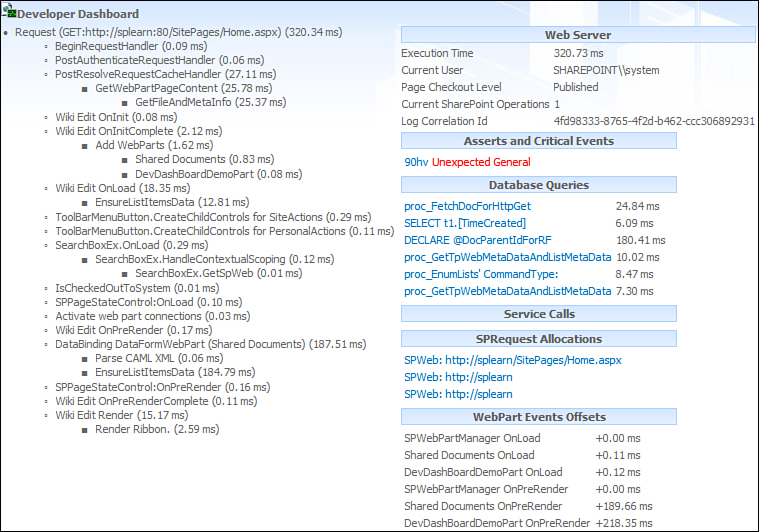
Figure 7.10. Developer dashboard warning on accessing a disposed object
5. Click the error message to view more details, as illustrated in Figure 7.11. The detailed message “Please close SPWeb objects when you are done with all objects obtained from them, but not before” clearly indicates our attempt to get the list title after the parent SPWeb has been disposed.
Figure 7.11. Detailed error message on accessing a disposed object
Next let’s look at a common scenario, where as a developer you want to monitor usage statistics for your code to determine any performance bottlenecks. SharePoint 2010 introduces the SPMonitoredScope class to assist you with this.
Using the SPMonitoredScope class you can create your own monitored scopes to get usage statistics and performance counters for your custom code. All you need to do is wrap the section of code to be monitored in an SPMonitoredScope block, as shown in the following code:
// Using SPMonitoredScope to monitor performance
using (SPMonitoredScope monitoredScope =
new SPMonitoredScope("My Monitored Scope"))
{
TimeConsumingOperation();
}
Redeploy the web part and examine the developer dashboard contents. You should now have the My Monitored Scope being displayed on the dashboard, as shown in Figure 7.12.

Figure 7.12. Creating a custom monitored scope
There are a number of performance counters that you can use with the SPMonitoredScope class to measure execution time (via the SPExecutionTimeCounter class), number of SPRequest objects (via the SPRequestUsageCounter class), and the number of SharePoint SQL Server queries (via the SPSqlQueryCounter class).
For example, the following code uses the SPExecutionTimeCounter class to display a critical message to the user if the TimeConsumingOperation takes more than 2 seconds to execute:
// Using SPMonitoredScope to monitor performance with performance counters
SPExecutionTimeCounter timeCounter = new SPExecutionTimeCounter(2000);
using (SPMonitoredScope monitoredScope =
new SPMonitoredScope("My Monitored Scope", 2000, timeCounter))
{
TimeConsumingOperation();
if (timeCounter.ValueIsExcessive)
{
string message = String.Format(
"Operation TimeConsumingOperation"+
"expected to take {0}ms time"+
"took {1}ms time.",
timeCounter.MaximumValue,
timeCounter.Value);
SPCriticalTraceCounter.AddDataToScope(
1,
"Performance Monitoring",
1,
message);
}
}
Since the TimeConsumingOperation takes around 5 seconds to execute, the developer dashboard displays the Critical Performance Monitoring message in the Asserts and Critical Events section, as shown in Figure 7.13.

Figure 7.13. Using performance counters
On clicking the Critical Performance Monitoring message, you get further details related to the event, as shown in Figure 7.14.

Figure 7.14. Logging to the developer dashboard using the SPCriticalTraceCounter.AddDataToScope method
To write the performance monitoring related information to the developer dashboard’s Asserts and Critical Events section, we use the SPCriticalTraceCounter class’s AddDataToScope method in the preceding code. The method requires a TagID, Category, TraceLevel, and Message as parameters.