
10.4 Performances of Video Transmission in Inter-networked Systems
An MPEG-4 encoder and decoder pair are implemented in real time at the mobile terminals. The connection setup is based on IP/UDP/RTP transport protocols [23]. Video frames are segmented if the video frame size exceeds the specified maximum transfer unit (MTU) size, before being encapsulated into IP packets for transmission. At the receiving end, if IP/UDP/RTP headers are found to be corrupted, data encapsulated within those packets is dropped at the network layer.
The aim of the QoS mapping emulation system is to obtain the optimal bearer configurations for the EGPRS network and the UMTS network. Experiments are carried out to investigate the influences of different bearer configurations on an EDGE-to-UMTS system. First, video transmission is emulated in both EDGE and UMTS systems separately. Second, encoded video is transmitted over the joint EDGE-to-UMTS system. The transmission is emulated over the EDGE system. Then the output data from the EDGE emulator is forwarded to QoS mapping emulator, where the appropriate radio resources are allocated for transmission over the UMTS system. After transmission over the UMTS system, received data is forwarded to the receiving terminal emulator for decoding and display.
10.4.1 Experimental Setup
At first, video transmission emulations are made in both the EGPRS emulator and the UMTS emulator. The MPEG-4 decoder will record the received video data and write to a YUV file. The peak signal-to-noise ratio (PSNR) of the received data used for present objection quality will be calculated. Next, the video should be transmitted to the EGPRS emulator, and then the encapsulated output data from the EGPRS emulator should be forwarded to the QoS mapping emulator. The UMTS emulator will receive the output data from the QoS mapping emulator. The output video data from the UMTS emulator will also be recorded to a YUV file by the MPEG-4 decoder. The PSNR of the data will be calculated and compared with the PSNR calculated in the first step. A 300 frame video (suzie.cmp) with a frame rate of 10 fps is selected for the test.
Full error-resilience-enabled MPEG-4-coded video transmission is considered in the experiments discussed. In addition, the TM5 rate-control algorithm, together with an adaptive intra-refresh algorithm [24], is used to stop temporal error propagation and to achieve a smoother output bit rate. ITU test sequences Suzie, Foreman, and Carphone are used as the source signals. QCIF (176 by 144 pixels) sequences are coded at 10 fps. The received video quality is measured in terms of average frame PSNR. The video encoder parameter settings used in the experiment are listed in Table 10.8.
Table 10.8 Parameters and performance of the sample video
| Parameter | Settings |
| Source rate | 64 kbps |
| Frame rate | 10 fps |
| Error resilience | Enabled |
| Video packet size | 600 bits |
| Adaptive intra refresh | 10 intra-coded MBs per frame |
| Cyclic intra refresh | 2 intra-coded MBs per frame |
Table 10.9 EDGE multislotting capacity for video (kbps). Reproduced by Permission of ©2005 IEEE

10.4.2 Test for the EDGE System
The throughput allocation per timeslot at the application level (as seen by the video codec) in the EDGE system is shown in Table 10.9 for different modulation coding schemes.
Simulations are carried out for different propagation environments; the results for the typical urban (TU) environment are shown in Figure 10.19. Ideal frequency hopping is assumed for 3 kmph mobile speed. It is seen that MCS-1 gives better performance than MCS-2 at all C/I values up to around 20 dB. At this value, however, MCS-5 begins to provide a superior video quality to either of these schemes. MCS-6 does not match this performance until at least a C/I value of 30 dB.
Further tests were conducted for different timeslot operations. An operating frequency of 1800 MHz in TU50 multipath fading channel environment is considered. Two channel coding schemes are selected for test: MCS-1 and MCS-5. The C/I ratio settings for MCS-1 vary from 9 to 18 dB, while the C/I ratio settings for MCS-5 vary from 12 to 24 dB, since MCS-1 has better performance against interferences. The original video source rate is 64 kbps. In the experiment, the number of timeslots allocated for RLC blocks using MCS-1 is set to five. Thus the source rate is limited to 8.8 kbps × 5 = 44kbps. The number of timeslots allocated for RLC blocks using MCS-5 is set to two in order to keep the same source rate (22.4 kbps × 2 = 44.8 kbps. The retransmission function is used, but with no resegmentation, which means the transmitter only uses the same coding scheme to perform the retransmission. Header corruptions are enabled. For each C/I ratio setting, the same test is taken 10 times in order to average out the effect of burst channel errors.
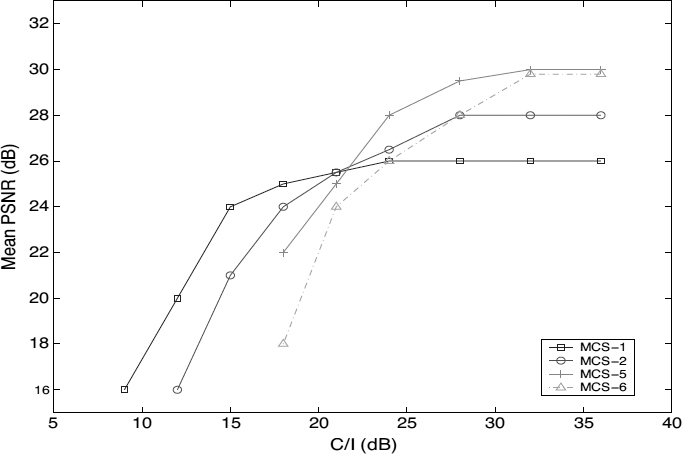
Figure 10.19 Video quality at TU1.5 IFH 1800 MHz
Table 10.10 PSNR of the received video (MCS-1, EGPRS, five timeslots)


Figure 10.20 MPEG-4 performance over EGPRS, MCS-1, five timeslots
From Table 10.10 and Figure 10.20 it can be seen that the mean PSNR is very low when the C/I radio is set to 9 dB. Hence, for video communication the channel quality should be above 9 dB. In the following QoS mapping test, the C/I ratio setting in the EGPRS module of the QoS mapping emulator will not be 9dB when the channel coding scheme is MCS-1.
From Table 10.11 and Figure 10.21 it can be seen that the PSNR is very low when the C/I radio is set to 12 dB. Thus, in the following QoS mapping test, the value of the C/I ratio in the EGPRS module of the QoS mapping emulator will not be set to 12 dB when the channel coding scheme is MCS-5.
Compared with MCS-1, with same source rate, MCS-5 has worse performance.
Table 10.11 PSNR of the received video (MCS-5, EGPRS, two timeslots)


Figure 10.21 MPEG-4 performance over EGPRS, MCS-5, 2 timeslots. Reproduced by Permission of ©2005 IEEE
10.4.3 Test for the UMTS System
The actual information data rate in a UMTS system is a function of spreading factor (SF), rate-matching ratio, channel coding scheme, CRC attachment, operation mode, and transport block (TB) size. The calculated information data rates according to the different simulation parameter settings are shown in Table 10.12.
The received video qualities for different spreading factor realizations are depicted in Figure 10.22. Video sequences are coded at the appropriate rates listed in Table 10.12. As expected, allocation of SF 32 provides slightly better performance than others in poor channel conditions, due to the better channel-protection capability of higher spreading factors. In better channel conditions, allocation of SF 16 provides superior video quality. SF 8 considerably underperforms compared to all other schemes, even in good conditions. This is due to the inter-symbol interference experienced in multipath channels. The channel coding algorithm tends to mitigate the inter-symbol interference effect. But significant performance degradation is still visible for low spreading factors (such as 8). Results are shown only for convolutional coding, as similar performances are achieved with turbo coding.
10.4.4 Tests for the EDGE-to-UMTS System
10.4.4.1 Tests for EGPRS MCS-1, UMTS CC 1/3, SF 32
The EGPRS emulator chooses MCS-1 as the channel coding scheme, while the UMTS emulator selects 1/3 convolutional code as its channel coding scheme, and the SF is set to 32. The results are listed in Table 10.13.
Table 10.12 Source throughput (kbps) capacity in UMTS. SF, spreading factor; CC, convolutional code; TC, turbo code. Reproduced by Permission of ©2005 IEEE

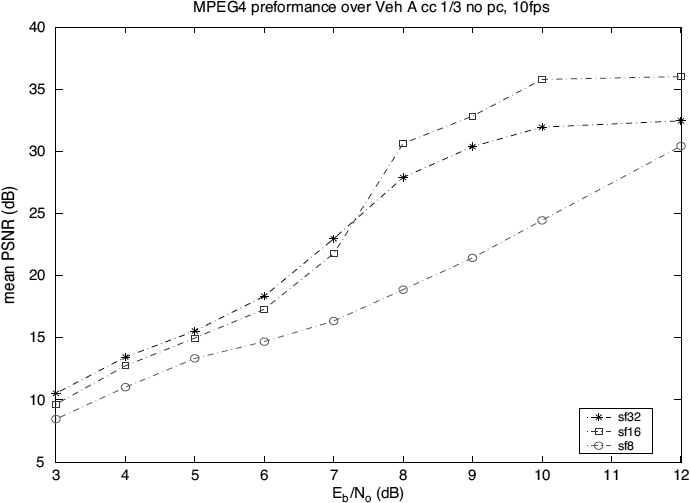
Figure 10.22 Effect of spreading factor
The performance results are compared to those over a single network connection. For the results shown in Figures 10.23–10.25, C/I of the EDGE channel is set to 18 dB (good channel), 15 dB (moderate channel), and 12 dB (poor quality channel), respectively, while the channel condition for the UMTS link is varied from Eb/No = 6dB to Eb/No = 10 dB. When channels on both connections are in good condition, video performance gets better. However, the video quality is always less than that over the single UMTS network. This is due to the QoS parameter mismatch in the two networks.
Figure 10.25 shows the video performance when the channel conditions on the EDGE link change from good to poor. Here C/I over EDGE is 12 dB. The results are 5–7 dB lower than the quality received over a single UMTS network. This is because when the received quality over the first link is poor it is impossible to achieve better quality even when the second link is in good condition. This illustrates that it is necessary to perform joint QoS optimization over heterogeneous networks for efficient resource utilization and improved end-user quality.
Table 10.13 PSNR of the received video (EGPRS MCS-1, UMTS CC 1/3, SF 32)

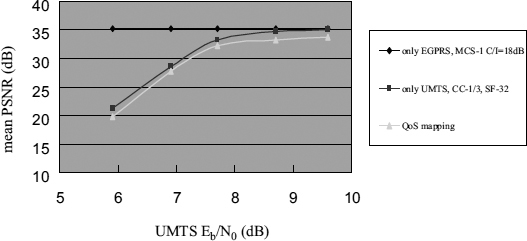
Figure 10.23 MPEG-4 performance in QoS mapping: EGPRS MCS-1, C/I = 18 dB (fixed), UMTS CC 1/3, SF 32 (variable)

Figure 10.24 MPEG-4 performance in QoS mapping: EGPRS MCS-1, C/I = 15 dB (fixed), UMTS CC 1/3, SF 32 (variable)

Figure 10.25 MPEG4 performance in QoS mapping: EGPRS MCS-1, C/I = 12 dB (fixed), UMTS CC 1/3, SF 32 (variable)
Table 10.14 PSNR of the received video (EGPRS MCS-1, UMTS CC 1/2, SF 16)

10.4.4.2 Tests for EGPRS MCS-1, UMTS CC 1/2, SF 16
From Figures 10.26–10.28, it can also be seen that the PSNR value in QoS mapping emulation is lower than the PSNR values in either EGPRS network emulation or UMTS network emulation. The results are listed in Table 10.14. The PSNR values here are low, which shows that an improper setting (channel coding scheme, spreading factor, etc.) may result in a significant drop in video quality.
10.4.4.3 Tests for EGPRS MCS-5, UMTS CC 1/2, SF 16
The results obtained are listed in Table 10.15. Figures 10.29–10.31 show very low PSNR in this experiment. It is obvious that MCS-5 gives worse QoS performance than MCS-1. If the UMTS network also uses a low QoS performance channel coding scheme (in the experiments, CC 1/2, SF 16 has shown much lower performance than CC 1/3, SF 32), the final received video quality of QoS mapping cannot be accepted.
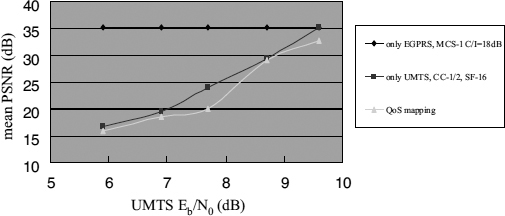
Figure 10.26 MPEG4 performance in QoS mapping: EGPRS MCS-1 C/I = 18 dB (fixed), UMTS CC 1/3, SF 16 (variable)

Figure 10.27 MPEG4 performance in QoS mapping: EGPRS MCS-1 C/I = 15 dB (fixed), UMTS CC 1/3, SF 16 (variable)
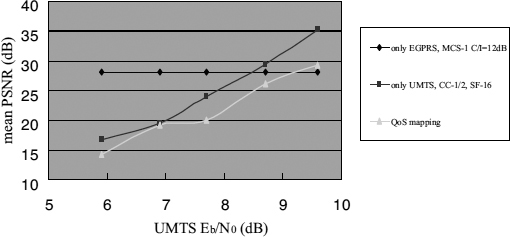
Figure 10.28 MPEG4 performance in QoS mapping: EGPRS MCS-1 C/I = 12 dB (fixed), UMTS CC 1/3, SF 16 (variable)
Table 10.15 PSNR of the received video (EGPRS MCS-5, UMTS CC 1/2, SF 16)

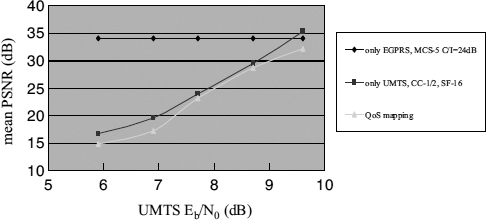
Figure 10.29 MPEG4 performance in QoS mapping: EGPRS MCS-1 C/I = 24 dB (fixed), UMTS CC 1/2, SF 16 (variable)
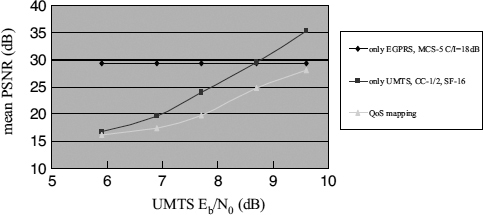
Figure 10.30 MPEG4 performance in QoS mapping: EGPRS MCS-5 C/I = 18 dB (fixed), UMTS CC 1/2, SF 16 (variable)

Figure 10.31 MPEG4 performance in QoS mapping: EGPRS MCS-5 C/I = 15 dB (fixed), UMTS CC 1/2, SF 16 (variable)
Table 10.16 PSNR of the received video (EGPRS MCS-5, UMTS CC 1/2, SF 32)

10.4.4.4 Tests for EGPRS MCS-5, UMTS CC 1/2, SF 32
The results obtained are listed in Table 10.16. It can be seen from Figures 10.32–10.34 that in most conditions, the UMTS module of the QoS mapping emulator will give better performance when the spreading factor is increased and the coding scheme kept the same. But if the PSNR values are already very low in an EGPRS network, changing the spreading factor will provide a significant improvement.

Figure 10.32 MPEG4 performance in QoS mapping: EGPRS MCS-5 C/I = 24 dB (fixed), UMTS CC 1/2, SF 32 (variable)

Figure 10.33 MPEG4 performance in QoS mapping: EGPRS MCS-5 C/I = 18 dB (fixed), UMTS CC 1/2, SF 32 (variable)

Figure 10.34 MPEG4 performance in QoS mapping: EGPRS MCS-5 C/I = 15 dB (fixed), UMTS CC 1/2, SF 32 (variable)