
Chapter 1: Getting Started with Analytics
In This Chapter
![]() Seeing the differences between reports and analytics
Seeing the differences between reports and analytics
![]() Setting expectations
Setting expectations
![]() Discovering how analytics software works
Discovering how analytics software works
![]() Setting up Google Analytics
Setting up Google Analytics
You build your site, launch it, and wait. And wait. And wait some more. Is it working? Are you getting visitors? Are they doing what you want them to do? How will you know?
Enter the traffic report. A traffic report is a list of numbers and information about how folks are using your site, as shown in Figure 1-1. It is also the foundation for web analytics.
Figure 1-1: A traffic report.

Web analytics comprises using a traffic report to draw conclusions and adjust your marketing strategy. So, if a traffic report is the pencil and paper, web analytics is the process of putting pencil to paper and creating a blueprint for your next steps.
 The distinction between traffic reports and web analytics is critical: Many traffic-reporting packages — including the popular Google Analytics — refer to themselves as web analytics packages. They are not, however. Only one web analytics tool exists: your brain. Don’t forget it.
In this chapter, you find an introduction to web analytics and traffic reports. You discover what’s possible with analytics but also what’s beyond its reach. You find out how traffic-reporting tools work and receive guidance on choosing one from the options available as this book goes to press. The chapter wraps up with a step-by-step explanation of getting set up with Google Analytics.
 This entire minibook takes a very high-level look at analytics. It gives you the bare essentials to monitor and improve your site. It does not teach statistics. If you want to read about statistical analysis, rolling averages, and so on, take a look at Statistics For Dummies or Statistics Workbook For Dummies, both by Deborah Rumsey (published by John Wiley & Sons, Inc.).
If you want to get a more in-depth look at web analytics, check out Web Analytics For Dummies, by Pedro Sostre and Jennifer LeClaire (published by John Wiley & Sons, Inc.).
Knowing What’s Possible (Or Not)
Traffic reports are useful tools, but a reality check is helpful as you begin venturing into the world of web analytics. Specifically, you need to understand what you can and can’t do when determining your key performance indicators (KPIs) — sales, leads, or other statistics that directly affect your business — and that’s the first step in any web analytics plan.
The following sections offer an overview of what data traffic reports can collect and what you can glean from that data. You discover the limits of that data and what effect your data collection has on your visitors’ privacy. (Hint: Not much, unless they agree to it.) Read on for details.
Ultimately, the purpose of analytics is to establish a narrative so that you can tell which changes have a positive or negative effect on your site and on your business over time. That helps you figure out what works and what doesn’t, which leads to improved results.
Collecting data and what it can tell you
Traffic reports, at a minimum, show you
• How many times people visit your website
• Which pages are most popular
• What sites send you visitors
• How much time visitors spend on your site
Those are the basics. Additionally, most traffic-reporting tools now provide more powerful features, including
• E-commerce sales tracking
• Conversion goal tracking (more on this later)
• Search-keywords reports that show which keywords folks use to find you
• Campaign performance measurements so that you know which e-mail marketing pieces, banners, and other ads generate traffic
• “Attribution,” showing how different traffic sources work together to generate conversions
With most traffic-reporting tools, you can
• Find out your best sources of traffic and business — such as search engines, a specific website, the e-mail you just sent, or something else that you didn’t expect — so that you know where to focus your advertising dollars and effort.
• See which pages on your site get the most or least attention so that you understand what your site visitors like — and give them more of it.
• Figure out which parts of your shopping cart (that one login form, for example, or an intimidating billing information page) drive away visitors so that you can tweak it to improve checkout rates.
• Discover which pay-per-click (PPC) advertising campaign generates the best return on investment (ROI) so that you can spend more on the keywords and ads that deliver the best results.
Understanding the limits of reporting
Traffic reporting isn’t black magic. You can’t peek at your visitors through their monitors and discover every detail of their lives. Nor should you.
However, most traffic-reporting tools cannot
• Tell you someone’s identity: Virtually all (99 percent) traffic reporting is anonymous. Although most reporting tools know that person A visited your site at 12 noon on Thursday, looked at four pages, signed up for the e-mail newsletter, and then left, they don’t know who person A actually is. That’s a good thing. Paranoia about traffic reporting is bad enough without that kind of intrusion.
• Accurately determine where someone lives: They can sometimes do this, but not consistently.
• Deliver 100 percent accuracy: And this is okay. See the section “Choosing Your Reporting Tool,” later in this chapter.
Minding visitors’ privacy
You’ll find a lot of hysteria about traffic reporting, analytics, and privacy. Folks are horrified that websites might be tracking where they came from, which pages they clicked on, and how long they stayed on a particular site.
Humbug.
The data that web servers collect is anonymous and aggregated. That is, if you visit an online store, the store owner knows someone came and looked around. The owner doesn’t know it was you unless you already created an account on the site, logged in, and gave him permission to watch you.
Compare this with the many security cameras, credit card reports, and phone records kept by every retail company on the planet, and you can see that web statistics tracking is just not much of an intrusion.
As a website owner, though, you must act responsibly:
• Have a clear privacy policy on your site explaining what, if anything, you do with the data you collect.
• Never collect and store personal information unless you’re capable of protecting it — and then, only if necessary.
• If you’re using a traffic-reporting service, stick with a reputable provider, such as Google Analytics or Adobe SiteCatalyst. Research all of them, and make sure that if a security breach has ever occurred, the provider properly handled it.
✦ Never, ever, ever provide your analytics data to a third party unless you were granted permission by your audience.
Knowing How Reporting Tools Work
When you know a little bit about how reporting tools work, it’s easier to understand what a specific reporting tool can or can’t do for you. Reporting tools have two ways of collecting data:
• Processing log files
• Receiving data from JavaScript-based web bug reporters
Geekery ahead! But it’s helpful to understand the basics of reporting technology, so don’t skip this section. Although you’ll come across techy-sounding words like JavaScript, you don’t need to actually understand log files or JavaScript code. You just need to know what’s going on behind the scenes in your traffic reports.
Log file reporting
When someone visits your website, your web server records basic information in a file called a log. Exactly what your server records might vary, but it usually includes
• When the visitor arrived
• What pages the visitor looked at
• Where the visitor came from
• Possibly, a unique identifier so that the server knows when that visit ended
Log file–reporting tools crunch through the thousands (or millions!) of lines of the server log file and create understandable reports based on the data. Tools range from simple, free packages such as Analog (www.analog.cx) to sophisticated packages such as Splunk (www.splunk.com), a super-customizable log file analyzer.
This approach has some drawbacks:
• If you don’t control your server, you might not control what the server logs store. That can lead to poor reporting.
• Log files can get big — fast! — occupying a lot of space on a server.
• Web servers can have a lot of trouble distinguishing between different sessions: a single visit to a site by a single person. This can lead to inaccurate data.
Still, log files are simple, and if your web server is properly configured, the data is available when you need it. You don’t need to modify your site, either. If you don’t have much control over your site’s code, but you can easily install/enable new software on your server, using a log file analyzer may be your best bet.
Web bugs and JavaScript
Other tools require that you actually place either a web bug or special JavaScript snippet on each page of your site. See Figure 1-2 for an example. The JavaScript “fires” when someone visits your web page. It then sends back data to the analytics service about the visitor, the page the visitor is viewing, and where the visitor came from.
This approach allows greater precision: Reporting tools can use sophisticated JavaScript to more accurately measure when a session starts and ends. They can also interpret all sorts of additional campaign data, thereby giving you greater ability to track campaign performance.
However, web bugs require that you add code to every page of your site. And, because they use JavaScript, they can slow page performance or fail completely if the visitor’s browser doesn’t process JavaScript. This means that JavaScript-driven reporting tools typically don’t log search engine crawler traffic, and may miss some user visits as well.
Figure 1-2: A web bug in the source code of a web page.

While JavaScript solutions can give you sophisticated reporting with minimal work, log file solutions can give you basic reporting or the most complex, complete dataset, but very little in between. Keep that in mind when choosing: If you have a lot of control over your site’s code, but cannot install new software on your server, you’ll want the JavaScript solution.
Choosing Your Reporting Tool
You want to choose the right reporting tool from the start. Although switching to another tool is indeed possible, it’s not easy because all reporting tools deliver slightly different data. So, choose one and stick with it.
The following sections give you a few options, explain the pluses and minuses of different solutions, and help you prepare for your installation.
Deciding what you need
No web traffic–reporting tool is totally accurate. Different web browsers might generate different results for JavaScript web bugs, and log files might fall victim to server errors or privacy-blocking software. Thus, all traffic-reporting tools will overcount some items but undercount others.
The best you can hope for is consistent inaccuracy: By using the same tool, in the same manner, over time, you can ensure that your margin of error stays consistent, and that you have consistent metrics for proportional comparison, even if they’re not precise.
 Here’s the main lesson of consistent inaccuracy: Choose your traffic-reporting tool carefully so that you don’t have to change tools again later on. Data reported by different tools can vary by as much as 30 to 40 percent. It’s no fun trying to explain to your boss why page views suddenly fell by 30 percent. Stick with one reporting tool. If you do have to switch, run both tools side by side for a while so that you can figure out the differences and allow for them when you finally disable the old software.
The following tips can help you choose a reporting tool that you can hopefully stick with:
• A balanced approach is best. Use a JavaScript-based tool for quick, sophisticated tracking; use a log file–based tool for very basic tracking or ultra-sophisticated troubleshooting. If you can have tools in place that use both, even better.
• Consider what kind of data you’ll be collecting. See the earlier section “Collecting data and what it can tell you” for a list of possible data you’ll want.
• Convenience matters. Make sure that your reporting tool can do things such as e-mail you reports automatically so that you don’t have to constantly log in to review data. That takes time. The e-mailed report also acts as a reminder and ensures that you will regularly check your data.
• Clarity matters, too. When you look at the reports, do they make your head spin? If the answer is yes, either this isn’t the right tool for you or you need some training before you dive into the data.
• Flexibility is key. Look at the tool’s custom reporting capabilities. Can you export data to Excel? Generate your own reports? If you can’t, this tool will probably outlive its usefulness for you pretty quickly.
Surveying your options
As of this writing, at least a dozen very good web traffic–reporting tools are available. Some are free; some aren’t. Table 1-1 outlines examples of what you can find on the market as this book goes to press.

 You can, of course, build your own tool. But with as many options as are available, you’d need a really good reason. Start with one of these solutions or another out-of-the-box solution. You can add your own analytics tools later if you really need to. Chances are that you won’t.
The rest of this chapter uses Google Analytics for most of the examples. It offers a great feature set and is free. Plus, most of the procedures for using Google Analytics will work just as well in other packages.
Making Sure Your Server Is Set Up
If you’re using a log file–based solution, you need to make sure that your server will log the data you need. Even if you aren’t going to use a log file–based solution, you should ensure that your server is logging a complete dataset for emergencies. That includes
• Session time
• Referring cookie data
• IP address data
• HTTP status code
You don’t need to know what this is. If you record it, your reporting tool will do the rest.
The details of how these work is outside the scope of this book. Contact your webmaster to make sure that your server is configured to track all visit data, and you’ll be all set. If you don’t, though, and your server isn’t tracking everything, you can’t go back and get it later.
If you’re using a JavaScript web bug–based system, you don’t need to worry about this. But you still should. Your log files are your backup: If the JavaScript system fails or gets disabled, you can use the log files to collect data and fill the gaps.
Setting Up Google Analytics
After you choose your reporting tool, you have a setup process to follow. In the following sections, you set up Google Analytics. Google Analytics offers JavaScript-based reporting, so you then need to add that script to each page in your site. Tracking search terms your visitors type also takes a little up-front work. And of course, you don’t want people in your office skewing your results, so you find out how to exclude them from your traffic reports.
Google Analytics also offers goal and e-commerce tracking. Goal tracking reports the completed lead forms, purchases (but not dollar amounts), or views of any page on your site that, if viewed by a visitor, indicate you achieved one of your KPIs. E-commerce tracking is goal tracking plus specifics regarding items sold and dollars collected. For details on these, see Chapter 5 of this minibook.
Google is updating Google Analytics on a daily basis. Features and navigation change every month or two. This is great, because the toolset continues to expand and improve. However, it may mean that some of the screens and instructions in this minibook are out of date. Fear not! The basic structure of screens and features should remain the same. If you get lost, look around and find the relevant feature, or try the Google Analytics help documentation.
Create your account
To create your account, follow these steps:
1. Go to www.google.com/analytics.
2. Log in to your Google account or sign up for one.
If you don’t already have a Google account, you need to create one.
When you’re logged in, you see the Google Analytics setup screen.
3. Click the Sign Up button.
The next page lets you set up your account and create your first profile (see Figure 1-3).
Figure 1-3: Set up your account and your profile.

4. Enter a profile name you’ll remember and the domain you want to track and click the Create Profile button.
Google Analytics divides each account into profiles. A profile is a grouping of reports for a particular domain or subdomain. Think of it as a folder: It’s just an easy way to keep things organized.
5. Select the web protocol for your site.
If your web address begins with http:// select http:// as your web protocol, as shown in Figure 1-4. If your web address begins with https://, select https://.
Figure 1-4: Set up your web protocol.

6. Choose whether you’d like to share your analytics data.
If you choose yes, Google will use this data for anonymous benchmarking. Unless you have a strong objection, choose yes. It helps you and other businesses get comparison data without giving away any secrets.
7. Agree to the terms and conditions and click the Sign Up button.
On the next page, you can set up the tracking code you need to add to your website to enable tracking.
8. Select the number of domains you’ll be tracking.
Scroll down the page, and you’ll see options for the number of domains to track (see Figure 1-5).
• Single domain: Choose this if you’re tracking one domain.
• One domain with multiple subdomains: If you want to track multiple subdomains (for example, mine.site.com and your.site.com) with the same Google Analytics report, select this option.
• Multiple top-level domains: If you want to track multiple, unique top-domains with the same Google Analytics report (for example, www.mysite.com and www.yoursite.com), select this option.
Figure 1-5: Select domain tracking options.

9. If you’re going to track AdWords campaigns, check that box.
10. Copy the code and paste it into a text editor so that you have it available for installation on your site.
11. Click Save.
It may look like nothing happened. You’ll see a small success callout at the top of the page (see Figure 1-6).
Figure 1-6: Success, oh-so-subtle.

You can set options around dynamic content, and custom tagging/tracking using the Advanced tab. That’s beyond the scope of this book. Take a look at Web Analytics For Dummies if you want to set up advanced options.
The code is slightly different for each site in your profile. Don’t reuse the same code among multiple sites.
12. Click Property Settings.
13. If you have Google Webmaster Tools set up, choose Webmaster Tools Settings⇒Edit. Select the Webmaster Tools profile that matches your site.
This is strictly a convenience: Google Analytics imports Webmaster Tools search query data so that you can view it in a single report. This saves you from having to open Google Webmaster Tools whenever you want to view this data. See Book II for more information on Webmaster Tools.
14. Click Apply again.
Your account is added, and you have the tracking code.
If you look at the accounts list, you’ll see the profile you added, as shown in Figure 1-7. Click that, and you’ll see your website.
Figure 1-7: Your website listed in the accounts list.

Installing the tracking code
Remember that tracking code you copied in the last step? You need to install it on your website so that it can start sending data to Google Analytics.
 This procedure varies depending on whether you have a blog site, a traditional site, or a CMS-driven site. (CMS stands for content management system.)
1. Access your site with whatever editing tool you’re using.
If you have a blog, you’ll want to look at the Templates or Design tool. If you have a traditional site, you’ll probably use a File Transfer Protocol (FTP) tool. If you’re using a CMS, you’ll want to edit your site template.
2. Copy the Google Analytics tracking code to your Clipboard by first selecting all the code and then choosing Edit⇒Copy in the text editor where you pasted it.
3. In your editing tool, paste the tracking code right before the closing </head> tag on each page of your site:
• If you’re using a blogging tool or a CMS, you might have to paste the code only once.
• If you’re using a traditional website, you might need to paste the code into each page. It’s worth the effort, though.
4. Save the edited code to your website.
5. If necessary, republish the site to update your code.
See Figure 1-8 for properly installed Google Analytics code.
6. Wait a half hour or so. Log back in to Google Analytics and look for the profile you added.
It should now read Receiving data. It may be 3-4 hours before you see any actual data, but your code is properly installed.
Figure 1-8: Properly installed Google Analytics code.

Tracking site search
If you have a search box on your website, it makes sense to track what folks type into it. You can find out a lot about your audience. Chapter 4 of this minibook talks about analyzing site searches.
To set up a site search, follow these steps:
1. Log in to Google Analytics.
2. Select the website for which you want to track site search.
3. Click Admin at the upper-right of the page.
4. Click the Profile Settings tab and scroll down to Site Search Settings.
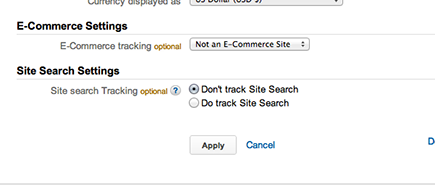
5. Select the Do Track Site Search radio button (see Figure 1-9).
Figure 1-9: Search tracking, set up in Google Analytics.
6. Leave this page open in your browser. Open a separate browser window for the next few steps.
7. In the new browser window, go to your website.
8. Search for buggy bumpers, using your site’s search tool.
9. Look at the address of the search result page.
You should find the words buggy bumpers in the address, as shown in Figure 1-10, as well as a query attribute (such as q= or search=).
10. Enter the query attribute into the Query Parameter field in Google Analytics.
11. Click Apply.
You’re done. Within a few hours, you’ll start seeing the phrases people search for on your site.
Figure 1-10: The search query attribute.

Excluding your office
Your analytics package won’t distinguish between customers and folks at your company unless you tell it to. Because you want the most accurate numbers, set up a filter to exclude everyone who works at your organization.
That kind of filter depends on the IP addresses used by your office. If you don’t know what that means, it’s best not to fiddle with it. Instead, contact your webmaster or your Internet Service Provider for help in finding the IP address.
Then you set up the filter, as follows:
1. Log in to Google Analytics.
2. Select the website for which you want to set up a filter.
3. Click Admin at the upper-right of the page.
4. Click the Filters tab.
5. Select + New Filter.
6. Give the filter a name you’ll remember, such as Exclude IPs.
7. Under Filter Type, choose Exclude Traffic from an IP Address.
8. Type your IP address.
See Figure 1-11 for a completed filter.
9. Click Save.
You might need to exclude multiple addresses. You can create a separate filter for each one, or you can use regular expressions (also called regex). regex is beyond the scope of this book and involves very high-level development expertise.
Figure 1-11: A completed IP filter.
