
Chapter 2: Tracking Traffic Volumes
In This Chapter
![]() Avoiding hits
Avoiding hits
![]() The five basic metrics
The five basic metrics
![]() How to interpret basic data
How to interpret basic data
All the fancier metrics for tracking traffic and user behavior that you can read about later in this book are built on the five basic ones covered in this chapter. You need to understand these five metrics — and how to interpret them — if you’re going to do more advanced analysis and know how to use that data to improve your site.
 This chapter uses Google Analytics. The reports are much the same from one reporting package to another, though. Follow along with these examples, and you’ll be able to apply what you glean here to any reporting toolset.
Seeing Why Hits Are a Lousy Metric
First off, though, you need to avoid one metric when tracking traffic and user behavior: hits.
You probably hear a lot of folks talk about hits. “I got a million hits last month!!” is a claim you hear a lot.
That’s great, but hits are almost meaningless when it comes to measuring audience or marketing performance. Simply defined, a hit is any one file downloaded from your website, any one time. Every image, script, and stylesheet linked to a page counts as one file — and thus, one hit. Seeing as how one page can contain 1 file or 1,000 files, hits don’t tell you much from a marketing viewpoint.
Look at Figure 2-1, which shows a single web page. That page, though, holds dozens of images. Do the math, and you can see that a single view of that page generates about 80 hits. Take it a step further: If ten people visit the page, that’s 800 hits. Wow!
Figure 2-1: One page, 80 hits. Ten visitors, 800 hits.
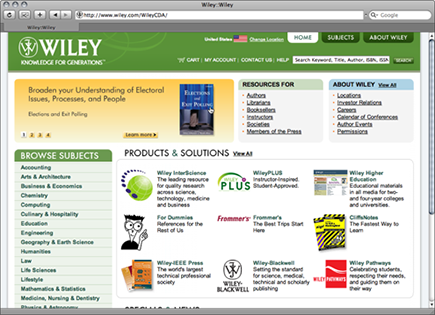
On the other hand, a simpler page — such as the Google homepage — contains only a few files. Do the math again to see why these base numbers are important: A view of one of your simpler pages might be just as important to your business as a view of a more complex page — but the simpler page generates fewer hits.
Having laid out the preceding argument to why hits aren’t necessarily the end-all–be-all metric that people assume, hits are indeed a valuable measure. They’re great for measuring server load and also a good way to figure out how to speed page load times. But because they’re a lousy marketing metric, avoid relying on them.
Understanding the Five Basic Traffic Metrics
Traffic, in terms of web visitors, actually comprises five different ingredients:
• Sessions (also called visits): A session is any one person visiting your website any one time. If someone visits your site ten times in a week, those visits count as ten sessions, whether she stayed on the site for 5 minutes or 50.
• Unique visitors (called uniques if you want to sound terribly professional): A unique visitor is any one person visiting your website any number of times during a defined period. If someone visits your site ten times in a week, she still counts as only one unique visitor.
• Page views: A page view is any one visitor viewing one page of your site, one time. A page must have a unique address, or URL. If someone visits your homepage but then clicks a link to your Contact page, those are two page views.
• Time on site: This is the total amount of time one visitor spends on your site in the course of a single session. Average time on site is an invaluable measure of visit quality and visitor interest.
• Referrers: If someone clicks a search result link at Google and lands on your site, Google is known as the referrer.
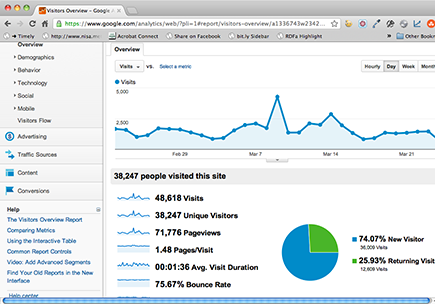
Any traffic-reporting toolset — even the most basic — must provide these five metrics. If yours doesn’t, replace it. These five metrics typically show up right on the first page — the dashboard — of your traffic-reporting package, as shown in Figure 2-2.
Figure 2-2: The five metrics in Google Analytics.
Tracking sessions (visits)
Because a session is defined as any one visit to your site, sessions are a good general measure of site use and load (more on this in a moment). Think of sessions as foot traffic in a traditional retail store: The same people might go in and out of the store, but that doesn’t matter. If the store’s full, it’s full.
In your traffic-reporting tool, you’ll find sessions either under a section called Sessions (surprise!) or Visits, as shown in Figure 2-3.
Don’t use sessions to measure the following:
• Audience size: If someone visits, leaves, and then returns to your site many times, one person can generate multiple sessions in any time period. So, sessions can be far higher than unique visits (a more accurate measure of audience).
• Ad performance: Advertising — whether pay-per-click ads, e-mail, banners, or other creative elements — is created to bring you new customers. Because sessions don’t differentiate between new and repeat visitors, they’re not a good measure of ad performance. Counting unique visitors (see the next section) is far better.
Figure 2-3: The Visits report in Google Analytics.

• Site activity in the broadest possible terms: More sessions mean more traffic, which may also mean a higher load on your web server. Sessions are a good way to judge how much strain your site is under.
• Conversion rate based on foot traffic to your site: If you want to know how many visits it takes to get a sale or lead, you need to know how many sessions you get in a given time period.
• General interest in your site: Even though one person can generate many sessions, sessions are still a great way to see how much interest you’re generating. At a high level, whether five or ten people generated those 100 sessions isn’t critical. The average level of interest remains the same.
• Peak times of the day, month, or year: Many businesses are cyclical by day or season. Peaks or lows in sessions might fit a pattern that tells you your customers are more active at a specific time of day or year. In Figure 2-4, the session graph of one day shows a common cycle.
Figure 2-4: A typical daily traffic curve.

Among analytics experts, sessions can sometimes get a bad reputation. Folks will skip them and move on to unique visitors, which appear to provide better data. However, sessions do provide valuable information.
Tracking unique visitors
Unique Visitors reports are a good measure of audience size, ad performance, and the effect of blog mentions or other noise — news reports about you or a competitor, for example — on your site.
Don’t use unique visitors to measure the following:
• Per-visitor interest: Unique visitor data can tell you how many people come to your site. On its own, though, it tells you nothing about how much they liked the site. Combine this data with page views and time on the site to make that kind of analysis. (You can read about page views and time on the site earlier in this chapter.)
• Overall site activity: If 100 unique visitors come to your site in a week, that might seem like a small group. However, if they each come to the site 100 times, that’s 10,000 sessions. Use sessions to track site activity, not unique visitors.
Do use unique visitors to measure
• Audience size: Unique visitors are a great absolute measure of your audience in a given time period. After all, 10,000 sessions are great. If this represents only 100 unique visitors, though, your audience isn’t that big.
• Overall ad performance: If you just purchased an ad — say, on a blog — and your unique visitor count increases, that could mean the ad’s working for you. You want to dig deeper with page views and referrers, but unique visitor count is a good initial clue.
• Changes over time: Watch unique visitors over time. If your audience (unique visitor count) suddenly doubles in size after that local news coverage, you know that story had an impact.
• Comparison with sessions: A single visitor generating ten sessions in a week is still only one unique visitor. By comparing unique visits with sessions, you can see how many folks return to your site more than once. In many businesses, a high ratio of sessions to unique visits is good: It indicates visitor loyalty.
See how these metrics build on each other? Sessions alone are useful, as are unique visitors, but sessions compared with unique visitors are even better.
 Any traffic-reporting package can deliver a Unique Visitors report much like the one shown in Figure 2-5. However, log file analysis tools (such as older versions of Urchin or WebTrends) require additional setup to report unique visitors. Otherwise, they’ll report sessions only. Check your traffic reports to make sure that you’re measuring unique visitors. They’re a must-have metric.
Tracking page views
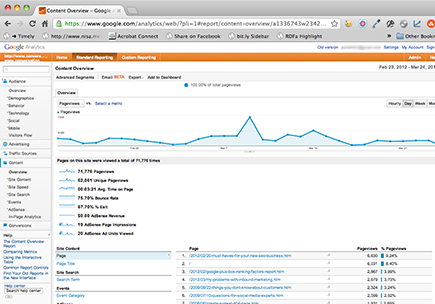
If unique visitors are the people, page views are their footprints. Page views are the measure of interest in specific areas of your site. Most traffic-reporting tools will give you a few different ways to look at page views, as shown in Figure 2-6:
• Overall page-view count for your entire site: Look for a Pageviews report to see the aggregate view.
• A page-by-page look at which pages get the most attention: Look for a report called Top Content or Top Pages to see a comparison of popular pages.
Figure 2-5: A Unique Visitors report.
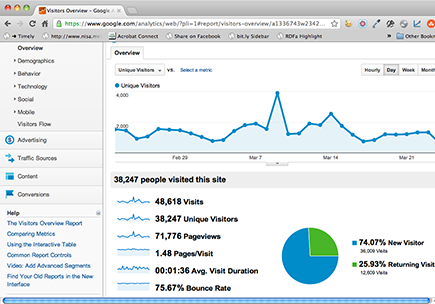
Figure 2-6: Aggregate and page-by-page reports.
Don’t use page views to measure audience size. One visitor may view 100 pages, while another may only look at 1. Having one customer who walks through your store and looks at every product isn’t as good as having ten who look at a few products each. The same holds true on the web. Page views are an awful measure of audience size.
Do use page views to measure
• Visitor interest: Combined with visitor data, page views are a great reflection of visitor interest. Page views per visit, as shown in Figure 2-7, are one indicator of just how interested your audience is in what you’re showing them. If someone stays on your website and looks at ten pages, chances are that visitor is more interested than someone who stays on your website and looks at only one page.
• Content performance: Pages that get more page views are better performers. They also tell you what your audience wants to hear. A page that gets 4,000 views in a month is probably drawing more interest than a page that gets 1,000.
• Ad performance: Most traffic-reporting tools show page views per visit generated by specific referrers. (See the section “Tracking Referrers,” later in this chapter.) Ads that generate more page views per visit are usually better performers.
Figure 2-7: Page views per visit in Google Analytics.

Again, see how the different metrics can be combined? Page views are a great measure of raw site usage. Page views per visit (per session) give you an added dimension: visitor interest.
Tracking time on site
Time on site is a useful metric when combined with page views, visits, sessions, and average time. Together, they give a more complete view of site performance and user interest. Consider the examples in the following sections.
Balancing page views with time on site
Time on site is the perfect balance for page views. Page views can be inaccurate. If someone comes to your site, looks at ten pages for five seconds each, hates what she sees, and then leaves, you might think you just got a quality visitor because she looked at ten whole pages. That’s a lot of page views for a single visitor.
But — and here’s the rub — she was on the site for only 50 seconds. Yikes.
If you track time on site, you can compare time on site with page views to make sure that you’re getting an accurate measure of visitor interest. Most web-traffic tools now show time on site and time on page right alongside page views and sessions.
Weighing sessions and unique visitors with time on site
You can use time on site to balance session or unique visitor counts, too. If your unique visitor count spikes suddenly because of a surge of traffic from a site like StumbleUpon (see Book VII on social media marketing), that’s great. However, also checking average time on site helps you assess how valuable that traffic surge really was.
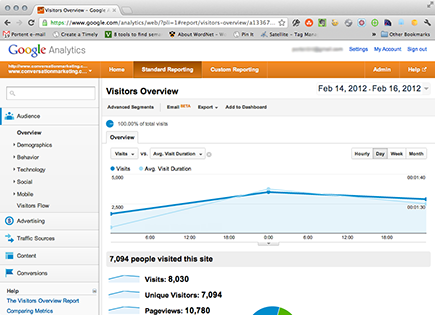
• If average time on site plunged, you might have gotten a lot of new visitors, but they were far less interested and probably won’t give you much long-term benefit. Figure 2-8 shows one instance where that happened: The average time on site plunged, which isn’t the direction you want to go in.
• If, on the other hand, your average time on site stayed consistent or improved, even when your number of visitors jumped, those additional visitors spent at least as much time on your site as the rest. That’s good: You added more quality members to your audience. Figure 2-9 shows one burst of traffic from StumbleUpon: Much better!
Figure 2-8: More visits, no attention.
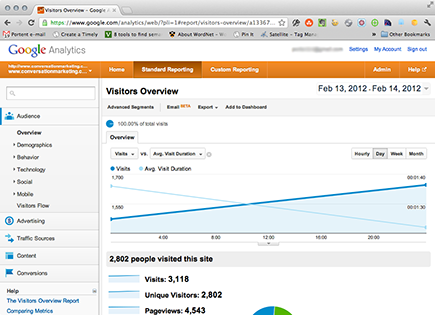
Figure 2-9: More visits, same or better attention.
Tracking Referrers
Referrers complete the basic traffic-reporting toolset. A referrer is a web page that points to your website. When someone clicks a link, that web page becomes a referrer. Referrers come in many flavors:
• A traditional web page that might have a link to your site
• A link in an e-mail that someone reads in a web-based e-mail reader, such as Hotmail or Gmail
• A search result on a search engine
So, a referrer tells you where visitors came from when they reached your site.
Think about it: If you ran a vegetable stand and every single person who walked up had a sign on their forehead that read, “I saw your ad in the newspaper” or “John at the corner store told me about you,” you’d immediately know which advertising worked and which marketing didn’t.
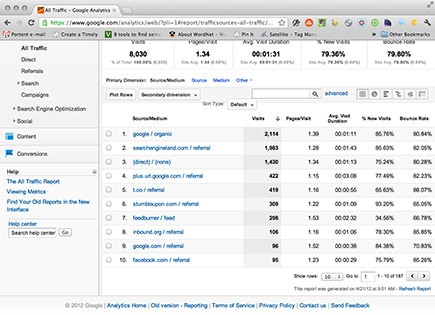
Referrers are like that kind of sign. Combine them with the other metrics in this chapter, and you can see which referrers generate quality traffic, as shown in Figure 2-10.
Figure 2-10: Time on site and page views per visit, by referrer.
Combine them with sales and conversion data (more on this later in this minibook), and you can actually measure return on investment (ROI) from many of your online marketing efforts.
That makes referrers a must-have in your analytics toolset. If your reporting tool doesn’t show referrers, get a new tool.
The following chapter is dedicated solely to referrers. They’re that important!