
Monitoring BizTalk Server for Performance
You will already have designed your BizTalk Server installation as detailed earlier in this chapter, separating the database servers, grouping the BizTalk servers, and scaling the computer and network hardware to meet the performance requirements of your expected workload. Now, to verify that you have provided adequate resources at every point and to identify any remaining bottlenecks, you can employ the Windows System Monitor to chart and log the performance of your servers and communications. Also, to avoid performance degradation in the disk subsystems, you can degfragment the disk volumes periodically and send alerts for inadequate free space on any disk volume.
Windows System Monitor
Several sets of performance counters are useful for monitoring performance of a BizTalk Server installation. We'll go through the setup of one counter set in detail, a combination useful for evaluating disk performance. Then we'll list the other counter sets and how to evaluate and apply each of them.
Open Windows System Monitor by choosing Start, Programs, Administrative Tools, Performance. Then follow these steps:
1. |
Expand Performance Logs and Alerts, right-click Counter Logs, choose New Log Settings, enter a name such as DiskLog for the counter set, and click Add (see Figure 21.10). Figure 21.10. Choosing PhysicalDisk counters to log performance.
|
2. |
Choose Performance Object: PhysicalDisk and Add in turn the counters % Disk Time, Current Disk Queue Length, Disk Reads/sec, and Disk Writes/sec (select
the _Total instance for each, or, if you have multiple physical drives, select each physical drive as a separate instance). |
3. |
Click Close after adding all the counters. |
4. |
For long-term logging, a sample interval of 1 minute should be adequate. |
5. |
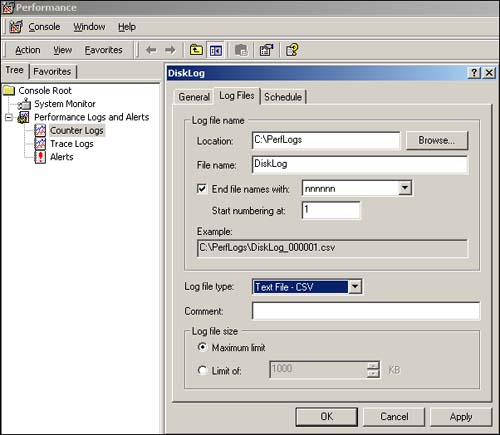
On the Log Files tab (see Figure 21.11), specify the location, filename, and suffix (serial number or date+time) for storing the log data. You also have the option to store the data as a comma-separated or tab-separated file to make it easier to import into Excel or another application for later analysis. Figure 21.11. Specifying performance log filename and type.
|
6. |
On the Schedule tab, select Start Log Manually and click OK to save the counter set and log-file definition for later use. |
7. |
To log data for the counter set, select Counter Logs in the left pane, right-click the name (for example, DiskLog) in the right pane, and choose Start (see Figure 21.12). Figure 21.12. Manually starting a performance counter log.
|
8. |
To change the sample interval or to schedule the log to start and stop at scheduled times, right-click the name and choose Properties. |
9. |
When you have sampled for the desired period, again right-click the name and choose Stop. |


To chart the data collected in the log, select System Monitor in the left pane, right-click in the right pane, choose Properties, and click the Source tab. Then follow these steps:
1. |
Select Log File and Browse to the most recent serial number or date+time of the desired log file. |
2. |
Click Time Range and use the slider to select the starting and ending times for
display, if desired. |
3. |
Click the Data tab and click Add. Select all Performance Counters (if more than one), select All Counters, and All Instances; click Add. Click Close and click OK (see Figure 21.13). Figure 21.13. Charting data from a counter log file.
|

The chart now displays the data from the sampled log file. To rescale any of the counters to make the results easier to interpret, right-click the right pane, choose Properties, click the Data tab, select the desired counter, and choose a new Scale from the drop-down list.
Counter Sets for Evaluating Performance
To evaluate disk performance (useful on all servers in your BizTalk installation), follow these guidelines:
PhysicalDisk\% Disk Time— Should be below 100 percent. If above, add more physical drives, use faster drives or faster disk controllers, or split the workload between two machines (for example, move a database to another server, or add an additional file-receiving server and move some of the receive functions to that server).
PhysicalDiskCurrent Disk Queue Length— Should be less than two times the number of drive spindles (each drive in a RAID array counts as a spindle). If above, add more physical drives, use faster drives or faster disk controllers, or divide the workload between multiple servers.
PhysicalDiskDisk Reads/sec and Disk Writes/sec— Sum should be well under the maximum capacity of the drive (determined from manufacturer's documentation or estimated by dividing drive RPM by 60 to calculate revolutions per second). If above, use same remedies as in the preceding items.
To evaluate processor and memory performance (on all servers), monitor the following:
MemoryAvailable Bytes— Should be above 10 MB. If not, add more physical memory or lower maximum memory setting for SQL Server.
MemoryPage Reads/sec and Pages Input/sec— Should be well below 100, usually below 20. If not, add more physical memory or lower maximum memory setting for SQL Server.
Processor\%Processor Time— Should be under 100 percent except for brief periods. If not, add faster processors, add more processors, or divide workload among more servers.
SystemProcessor Queue Length— Should be less than two times number of processors. If not, add faster processors, add more processors, or divide workload among servers.
To evaluate network performance (all servers), monitor the following:
Network InterfaceBytes Total/sec— Should be under 30 percent of rated speed of network segment. If not, install a faster network connection.
Network InterfaceOutput Queue Length— Should average well under 1, usually under 0.1. If not, network collisions are slowing communication. Add more network segments (with multiple adapters per server) or install smart switches to increase effective network capacity.
To evaluate Web server performance (for HTTP transport services), monitor the following:
Web ServiceGet Requests/sec and Post Requests/sec— Sum indicates number of documents being received via HTTP for submission to BizTalk Server.
Active Server PagesRequests Queued and Request Wait Time— Should be near zero except for brief periods. If not, distribute workload among additional Web servers.
ProcessPrivate Bytes (select inetinfo instance)— Steady increase indicates memory leak, possibly in a COM+ component, that will eventually crash the Web server.
To evaluate Message Queue server performance, monitor the following:
MSMQ ServiceIncoming Messages/sec, Total messages in all queues, and Total bytes in all queues— Allow monitoring of workload on queue servers. Limits depend on server memory, disk, and network capacity. Monitor to establish initial baseline and revisit periodically to detect large deviations that may warn of developing problems.
MSMQ QueueMessages in queue and Bytes in queue (select individual instances)— Use to monitor activity on individual queues. Establish initial baseline; monitor periodically for variations.
To evaluate BizTalk Server performance, monitor the following:
BizTalk ServerSynchronous Submissions/sec and Asynchronous Submissions/sec— Rate of submissions by Interchange object method calls. Note that one submission may contain multiple documents. However, on pass-through systems (with no document processing), these counters are the only measure of inbound performance.
BizTalk ServerDocuments Received/sec— Rate at which documents are being received—both documents that are added to the Work Queue in the Shared Queue database and documents that fail parsing and are added to the Suspended Queue.
BizTalk ServerDocuments Processed/sec— Rate at which a document-processing server is pulling documents from the Work Queue. Does not include documents that failed parsing.
SystemContext Switches/sec— A high number on a BizTalk Server indicates too many input/output tasks on the same machine or too many work-item processing threads. On a document-receive server, redistribute some receive functions to other server(s). On receive-and-processing servers, redistribute some or all receive functions to another server. On document-processing servers, reduce number of work-item processing threads.
Windows Defragmenter
Often overlooked in optimization of servers, fragmentation of disk files can cause significant loss of performance as the read/write heads make extra movements that would be unnecessary if all the files were contiguous on disk. Conversely, running the Windows Defragmenter regularly (or using third-party tools that allow automatic, scheduled defragmentation) can maintain efficient operation of the disk storage subsystem.
To check disk volumes for fragmentation, right-click My Computer (in Windows Explorer or on the Desktop), choose Manage, expand Storage, and select Disk Defragmenter (see Figure 21.14). Select a volume and click Analyze. The program will suggest whether the volume needs to be defragmented, but you can make your own choice whether to proceed and click Defragment if you choose. Defragmentation is more effective and will complete more quickly, when the volume is not being heavily used. However, it is possible, and safe, to defragment at any time.
Figure 21.14. Windows Defragmenter display.

Windows Alerts
An important cause of file fragmentation is running out of free space on a disk volume. When there is no single piece of contiguous free space large enough to contain a file, multiple smaller pieces (possibly far from each other on the physical disk) must be used. As a rule of thumb, an NTFS volume suffers increased fragmentation when its free space falls below about 15 percent. You probably already knew that it is not a good idea to stuff your disk volumes to capacity, to avoid unexpectedly running completely out of space. Now avoiding fragmentation offers another reason to keep your disks well below the “full” mark, to keep them performing efficiently for both read and write operations. You may have volumes right now that are below 15 percent, even below 10 percent or 5 percent, free space. If you open the Windows Defragmenter and Analyze those volumes, you will probably find them to be highly fragmented—and their performance has probably been reduced as a result.
For any BizTalk Server or SQL server machine, a Windows Alert should be created for each disk volume on the machine to notify an administrator when the free space falls below 15 percent. (You may want to set the threshold higher, 20 percent or 25 percent, to allow time to respond before free space falls well below 15 percent.) First to activate the LogicalDisk performance counters, choose Start, Run, cmd /k diskperf -YV, and click OK. Restart Windows to allow the logical disk performance driver to be installed.
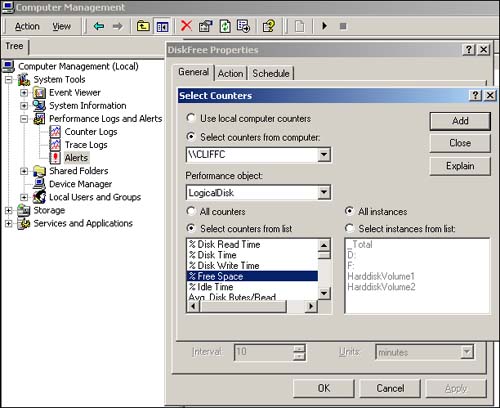
To create a free-space alert, again right-click My Computer, choose Manage, expand System Tools, expand Performance Logs and Alerts, right-click Alerts, choose New Alert Settings, enter a name for the alert, and click the Add button. There may be a delay the first time you click Add as all the available performance counters are being discovered and listed. On the Select Counters dialog (see Figure 21.15), choose Performance Object: LogicalDisk, select counter % Free Space, select All Instances, click Add, and click Close. (Note: The C:drive may appear as HardDiskVolumeN, as may any special boot volume for third-party disk imaging software.)
Figure 21.15. Choosing counters to monitor disk free space.
For each of the counters, set the alert to trigger when the value is under 15 (or higher value you choose). Sampling every 10 minutes provides a timely alert without imposing much system overhead. On the Action tab (see Figure 21.16), you can specify how the alert will be delivered. By default, the alert is recorded in the Application Log. In addition, you can specify a machine to be notified (via net send) when the alert occurs. And you can execute a program or command script to e-mail or page system operators to respond when the alert occurs.
Figure 21.16. Specifying actions when alert is triggered.
