XLANG Event Monitor
XLANG Event Monitor is a visual tool that displays current schedule execution activity and captures trace information for post-mortem review. This section describes the following capabilities of the monitor:
The monitor can display schedule execution activity on multiple servers and group managers. You can select the event sources that you want to record.
You can search for a specific schedule instance in the display by name.
You can filter the events that you want to view. Event history and event details for each monitored schedule can be reviewed.
You can selectively delete the trace data for a specific schedule execution.
You can start and stop the recording as needed, and the captured trace can be saved to a file for later review.
You can suspend, resume, or terminate a running schedule.
You can manually start new schedules.
Tip
A shortcut to the XLANG Event Monitor is not installed under the usual Start, Programs, BizTalk Server 2002 Windows menu. You can create a shortcut to it by locating the program XLANGMon.exe in the following location (or a similar location depending on your installation):
" Program FilesMicrosoft BizTalk ServerSDKXLANG ToolsXLANGMon.exe"
The documentation for the monitor is available as an HTML Readme file in the same directory. Note that the monitor is not a fully supported tool.
Note
Use Windows 2000 Service Pack 2 (or later); the service pack fixes some operational issues with the XLANG Event Monitor.
When you start the monitor, it immediately starts recording the activity of schedules. By default, it picks the local machine and the currently configured group managers on the local machine to start monitoring for running schedules. If the group managers on the local machine are not running, then these are started. Dehydrated schedules are rehydrated to monitor progress of all schedule instances. The rehydration, however, is usually only momentary, if in fact there is nothing for the schedules to do. In the activity recorded by the monitor, the prior execution history is not available for any schedule. This is true for the dehydrated schedules also, which are located but their prior history is not available.
Figure 11.9 shows various schedule instances in different states of execution. Two group managers are configured on the local machine. Under each group manager are two folders, one for running instances and the other for completed instances. An entry under either folder describes the state of an instance. This entry line consists of an icon (described later), the schedule name (also known as the module name), and the instance GUID (also known as the module ID).
Figure 11.9. XLANG Event Monitor.

The icon visually describes the state as follows:
Green dot— Running schedule instance. (In Figure 11.9, see ScheduleOne in group manager XLANG Two.)
Blue lines (as in a recorder pause button)— Suspended schedule instance. (In Figure 11.9, see ScheduleOne in the default group manager XLANG Scheduler under the Running folder.)
Black dot— Successfully completed schedule instance. (In Figure 11.9, see ScheduleThree in the default group manager.)
Red dot— Completed schedule instance, but with errors. (In Figure 11.9, see ScheduleOne in the default group manager, under the Completed folder.)
Blue snowflake— Dehydrated schedule instance. (In Figure 11.9, see ScheduleTwo under the group manager XLANG Two.)
Note that only the running and suspended schedules consume nontrivial system resources. Dehydrated schedules consume minimal resources. A suspended schedule cannot be dehydrated; it will continue to hold on to precious system resources until its operation is either resumed or stopped.
Note
Successful completion of a schedule does not imply that the underlying business process completed correctly. For example, if errors occurred in the business process, the schedule may have (based on how it was designed) successfully recorded the failure without necessarily completing the business process.
In the XLANG Event Monitor you can double-click on a schedule instance entry to see all the recorded events for the schedule. For example, if you could double-click on the completed schedule SchedThree shown in Figure 11.9, you would see what's shown in Figure 11.10.
Figure 11.10. Events for schedule SchedThree.skv.

As you can see in Figure 11.10, the event window has been maximized. It is split into a top half and a bottom half. The top half contains a chronological list of events that occurred during the execution of the schedule. The event ComSourceReturn is highlighted. The other two columns list the shapes and messages from the process flow drawing.
The bottom half contains the detailed attributes of this event. The first five attributes listed are common to all events; the remaining are event-specific. Note the following items:
The Event Time is listed.
The EventName is listed. This determines what event-specific properties are listed. The event shown is OnBTAComSourceReturn. This is a COM method call that originated from the XLANG schedule and is now returning. The EventID is a GUID identity for this event.
The InstanceID is the same GUID as the schedule instance ID shown in Figure 11.9 for the SchedThree schedule.
Other attributes (such as ActivityId, PortId, and others that follow) are specific to this event (ComSourceReturn) being that for a COM method call. If you select another method in the top pane, you will see a different set of attributes.
Although not shown in Figure 11.10, the ScheduleStart and ScheduleDone events also list the ModuleName, which is the name of the compiled schedule file, and the ModuleId, which is the GUID identity that you would see as a property of your Begin shape in the visual drawing of your process flow. With this information, you know exactly which schedule ran.
You can correlate these events with what SchedThree.skv actually contains, shown in Figure 11.11.
Figure 11.11. XLANG schedule SchedThree.skv.

The schedule shown in Figure 11.11 is simple. It consists of making a single call to a COM component, TestXLANG's Dbg class. This class has a single interface with a single method, called DisplayMsg, which really does nothing. When the schedule is started, Action 1 makes the call through Port_1, and the schedule terminates.
The events shown in Figure 11.10 were shown without filtering out any events.
You can filter what events are shown in the display, as shown in Figure 11.12.
Figure 11.12. Events View filtering.

The full set of options is described in Table 11.8. If you check View All Event Data, then you also will see the event time and the event name. This event name can be logged into the BizTalk tracking database as described in the next section and viewed using BizTalk Document Tracking Web application.
| Event Category | Events |
|---|---|
| Schedule State | Events relating to starting, stopping, suspension, resumption, and completion of schedules. |
| Persistance (sic.) | Events relating to persistence to database, dehydration, and rehydration of schedules. |
| Schedule Actions | Events related to flow chart shapes as the schedule is being run. There is a separate event for a shape (or a port) that is being entered and exited. |
| Transactions | Events for both short-lived and long-lived transactions and for the transaction contexts. |
| XLANG Hosts | Events for the shutdown and startup of group managers. |
| Errors | Events associated with reported errors. (Also see the system event log.) |
| COM Binding | Events associated with the control flow of COM component method calls. The entry and exit of the method call can be traced, whether it is initiated by the schedule instance or by an external application. |
| Not traced by default. | |
| MSMQ Binding | Events associated with message delivery or receipt. Applies to both the BizTalk messaging and for MSMQ. |
| Not traced by default. |
You can control what event sources are captured.
If you want to change the event sources to monitor, you must first stop the current recording. Do this from the Recording menu. When stopped, the Event Sources menu is enabled. Figure 11.13 shows the dialog box for changing the event sources.
Figure 11.13. Select Event Sources.

In the dialog box shown in Figure 11.13, you can add or remove servers and group managers to monitor. To start monitoring, you must start a new recording session; you cannot change your selections for the existing recording. However, you can save the old recording if necessary. You save a recording in the usual manner, using the File menu.
After capturing a lot of trace data, over some period, you may want to save event information for only a subset of the instances recorded. You can search for specific named instances using the Edit, Find menu command. You can also selectively delete trace histories of unwanted instances by first selecting an instance and then using the Delete Instance Data menu.
Tip
Use the XLANG monitor to see when a schedule is in fact dehydrated or not. The rehydration process completes asynchronously, whether it is initiated programmatically using the SysMgr.StartUp method or interactively using the XLANG tab of the group manager's properties. Hence, it may not be immediately apparent when the status of the schedule changes.
You can start new instances or suspend, resume, or terminate existing schedule instances from the Instance menu. The schedule instances can be run on any chosen group manager by first selecting the desired group manager folder in the display and then starting the new instance.
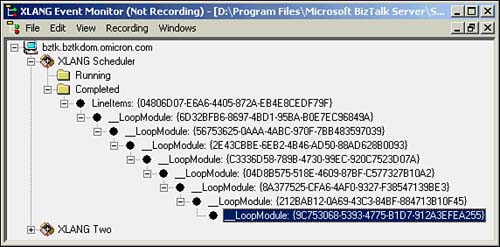
Before leaving this section, take a look at the execution trace for a less trivial schedule containing a While loop. This trace is generated from the sample provided with the SDK. The XLANG schedule is located at Program FilesMicrosoft BizTalk ServerSDKXLANG SamplesIterationLineItemsAppLineItems.skx. You need to set up the sample as described in the readme file provided with the sample before running the schedule.
Figure 11.14 shows that the LineItems schedule instance ran to completion. The instance contained a While loop that executed eight times. Each execution of the body of a While loop is treated as a child subschedule. You can view the execution history for each of these executions by double-clicking on it. The last entry in the chain depicts that the Rule in the While shape returned False.
Figure 11.14. Event trace for a schedule with iteration.