
14.1 States and State Probabilities
States are used to identify all possible conditions of a process or a system. For example, a machine can be in one of two states at any point in time. It can be either functioning correctly or not functioning correctly. We can call the proper operation of the machine the first state, and we can call the incorrect functioning the second state. Indeed, it is possible to identify specific states for many processes or systems. If there are only three grocery stores in a small town, a resident can be a customer of any one of the three at any point in time. Therefore, there are three states corresponding to the three grocery stores. If students can take one of three specialties in the management area (let’s say management science, management information systems, or general management), each of these areas can be considered a state.
In Markov analysis, we also assume that the states are both collectively exhaustive and mutually exclusive. Collectively exhaustive means that we can list all of the possible states of a system or process. Our discussion of Markov analysis assumes that there is a finite number of states for any system. Mutually exclusive means that a system can be in only one state at any point in time. A student can be in only one of the three management specialty areas and not in two or more areas at the same time. It also means that a person can be a customer of only one of the three grocery stores at any point in time.
After the states have been identified, the next step is to determine the probability that the system is in each state. Individually, this probability is known as a state probability. Collectively, these state probabilities can be placed into a vector of state probabilities.
where
When we are dealing with only one item, such as one machine, it is possible to know with complete certainty what state this item is in. For example, if we are investigating only one machine, we may know that at this point in time the machine is functioning correctly. Then the vector of states can be represented as follows:
where
This shows that the probability the machine is functioning correctly, state 1, is 1 and the probability that the machine is functioning incorrectly, state 2, is 0 for the first period. In most cases, however, we are dealing with more than one item.
The Vector of State Probabilities for Grocery Store Example
Let’s look at the vector of states for people in the small town with the three grocery stores. There could be a total of 100,000 people that shop at the three grocery stores during any given month. Forty thousand people may be shopping at American Food Store, which will be called state 1; 30,000 people may be shopping at Food Mart, which will be called state 2; and 30,000 people may be shopping at Atlas Foods, which will be called state 3. The probability that a person will be shopping at one of these three grocery stores is as follows:
These probabilities can be placed in the vector of state probabilities:
where
You should also notice that the probabilities in the vector of states for the three grocery stores represent the market shares for these three stores for the first period. Thus, American Food Store has 40%, Food Mart has 30%, and Atlas Foods has 30% of the market in period 1. When we are dealing with market shares, the market shares can be used in place of probability values.
Management of these three groceries should be interested in how the market shares change over time. Customers do not always remain with one store; they may go to a different store for their next purchase. In this example, a study has been performed to determine how loyal the customers have been. It is determined that 80% of the customers who shop at American Food Store one month will return to that store next month. However, of the other 20% of American’s customers, 10% will switch to Food Mart, and the other 10% will switch to Atlas Foods for their next purchase. For customers who shop this month at Food Mart, 70% will return, 10% will switch to American Food Store, and 20% will switch to Atlas Foods. Of the customers who shop this month at Atlas Foods, 60% will return, but 20% will go to American Food Store and 20% will switch to Food Mart.
Figure 14.1 provides a tree diagram to illustrate this situation. Notice that of the 40% market share for American Food Store this month, 32% will return, 4% will shop at Food Mart, and 4% will shop at Atlas Foods. To find the market share for American next month, we can add this 32% of returning customers to the 3% that leave Food Mart to come to American and the 6% that leave Atlas Foods to come to American. Thus, American Food Store will have a 41% market share next month.
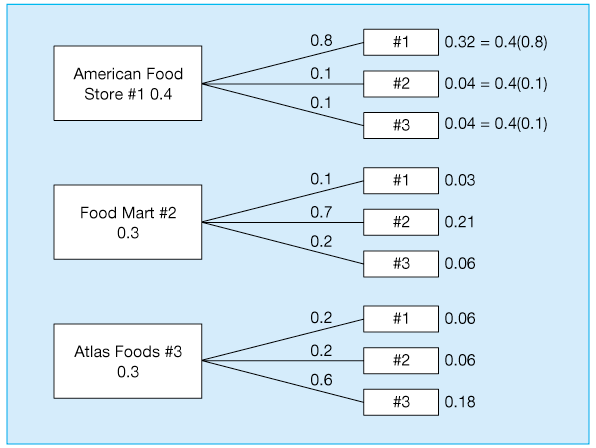
Figure 14.1 Tree Diagram for Grocery Store Example
Although a tree diagram and the calculations just illustrated could be used to find the state probabilities for the next month and the month after that, the tree would soon get very large. Rather than using a tree diagram, it is easier to use a matrix of transition probabilities. A transition probability is the probability of moving from one particular state to another particular state. A matrix of transition probabilities is used along with the current state probabilities to predict the future conditions.