
 CHAPTER 5
Evaluating New Advanced Multiobjective Metaheuristics
A. J. NEBRO, J. J. DURILLO, F. LUNA, and E. ALBA
Universidad de Málaga, Spain
5.1 INTRODUCTION
Many sectors of industry (e.g., mechanical, chemistry, telecommunication, environment, transport) are concerned with large and complex problems that must be optimized. Such problems seldom have a single objective; on the contrary, they frequently have several contradictory criteria or objectives that must be satisfied simultaneously. Multiobjective optimization is a discipline focused on the resolution of these types of problems.
As in single-objective optimization, the techniques to solve a multiobjective optimization problem (MOP) can be classified into exact and approximate (also named heuristic) algorithms. Exact methods such as branch and bound [18,22], the A* algorithm [20], and dynamic programming [2] are effective for problems of small size. When problems become more difficult, usually because of their NP-hard complexity, approximate algorithms are mandatory.
In recent years an approximate optimization technique known as metaheuristics has become an active research area [1,9]. Although there is not a commonly accepted definition of metaheuristics [1], they can be considered high-level strategies that guide a set of simpler techniques in the search for an optimum. Among these techniques, evolutionary algorithms for solving MOPs are very popular in multiobjective optimization, giving raise to a wide variety of algorithms, such as NSGA-II [5], SPEA2 [25], PAES [12], and many others [3,4].
Multiobjective optimization seeks to optimize several components of a cost function vector. Contrary to single-objective optimization, the solution of a MOP is not a single solution but a set of solutions known as a Pareto optimal set, called a Pareto border or Pareto front when plotted in the objective space. Any solution of this set is optimal in the sense that no improvement can be made on a component of the objective vector without worsening at least one other of its components. The main goal in the resolution of a multiobjective problem is to obtain a set of solutions within the Pareto optimal set and, consequently, the Pareto front.
In the current scenario of the multiobjective optimization field, many new metaheuristics are proposed continuously, and to ensure their efficacy, they used to be compared against reference techniques: that is, the NSGA-II algorithm and, to a lesser extent, SPEA2. The goal is, given a set of benchmark problems, to show that the new technique improves the results of the reference algorithms according to a number of quality indicators (see, e.g., refs. 11,16, and 17). The point here is that many of these studies frequently are not fully satisfactory, for a number of reasons. First, the algorithms compared are implemented by different authors, which makes a comparison unfair, because not only are the algorithms per se evaluated, but also the ability of the programmers, the performance of the programming language used, and so on. Second, the benchmark problems are not fully representative, although sometimes this is a consequence of space constraints in the length of the papers. Finally, there is poor experiment methodology: It is usual to find studies that carry out too few independent runs of the experiments, and accurate statistical analyses to test the significance of the results are often missing.
In this chapter we analyze the performance of new advanced multiobjective metaheuristics that attempt to avoid the aforementioned issues. Our contributions can be summarized as follows:
- We compare the following techniques: a scatter search, AbYSS [16]; a particle swarm optimization, OMOPSO [17]; two genetic algorithms, NSGA-II [5] and SPEA2 [25]; and a cellular genetic algorithm, MOCell [14].
- We use three benchmarks, which cover a broad range of problems having different features (e.g., concave, convex, disconnected, deceptive). The benchmarks are the well-known ZDT [24], DTLZ [6], and WFG [10] problem families. A total of 21 problems are used.
- To ensure the statistical confidence of the results, we perform 100 independent runs of each experiment, and we use parametric or nonparametric tests according to the normality of the distributions of the data.
- All the algorithms have been coded using jMetal [8], a Java-based framework for developing multiobjective optimization metaheuristics. Thus, the techniques share common internal structures (populations, individuals, etc.), operators (selection, mutation, crossover, etc.), and solution encodings. In this way we ensure a high degree of fairness when comparing the metaheuristics.
The remainder of the chapter is structured as follows. In Section 5.2 we provide some background of basic concepts related to multiobjective optimization. The metaheuristics that we compare are described in Section 5.3. The next section is devoted to detailing the experimentation methodology used to evaluate the algorithms, which includes quality indicators, benchmark problems, and statistical tests. In Section 5.5 we analyze the results obtained. Finally, Section 5.6 provides conclusions and lines of future work.
5.2 BACKGROUND
In this section we provide some background on multiobjective optimization. We first define basic concepts, such as Pareto optimality, Pareto dominance, Pareto optimal set, and Pareto front. In these definitions we are assuming, without loss of generality, the minimization of all the objectives.
A general multiobjective optimization problem (MOP) can be defined formally as follows:
Definition 5.1 To obtain a multiobjective optimization problem (MOP), find a vector ![]() that satisfies the m inequality constraints
that satisfies the m inequality constraints ![]() , i = 1, 2, …, m, the p equality constraints
, i = 1, 2, …, m, the p equality constraints ![]() , i = 1, 2, …, p, and minimizes the vector function
, i = 1, 2, …, p, and minimizes the vector function ![]() , where
, where ![]() is a vector of decision variables.
is a vector of decision variables.
The set of all the values satisfying the constraints defines the feasible region Ω, and any point ![]() is a feasible solution. As mentioned earlier, we seek the Pareto optimum. Its formal definition is provided next.
is a feasible solution. As mentioned earlier, we seek the Pareto optimum. Its formal definition is provided next.
Definition 5.2 A point ![]() is Pareto optimal if for every
is Pareto optimal if for every ![]() and I = {1, 2, …, k}, either
and I = {1, 2, …, k}, either ![]() or there is at least one i ∈ I such that
or there is at least one i ∈ I such that ![]() .
.
This definition states that ![]() is Pareto optimal if no feasible vector
is Pareto optimal if no feasible vector ![]() exists that would improve some criterion without causing simultaneous worsening in at least one other criterion. Other important definitions associated with Pareto optimality are the following:
exists that would improve some criterion without causing simultaneous worsening in at least one other criterion. Other important definitions associated with Pareto optimality are the following:
Definition 5.3 A vector ![]() is said to Pareto dominate
is said to Pareto dominate ![]() (denoted by
(denoted by ![]() ) if and only if
) if and only if ![]() is partially less than
is partially less than ![]() [i.e., ∀i ∈ {1, …, k}, ui ≤ υi ∧ ∃i ∈ {1, …, k} : ui < υi].
[i.e., ∀i ∈ {1, …, k}, ui ≤ υi ∧ ∃i ∈ {1, …, k} : ui < υi].
Definition 5.4 For a given MOP ![]() the Pareto optimal set is defined as
the Pareto optimal set is defined as ![]() .
.
Definition 5.5 For a given MOP ![]() and its Pareto optimal set
and its Pareto optimal set ![]() *, the Pareto front is defined as
*, the Pareto front is defined as ![]() .
.
Obtaining the Pareto front of a MOP is the main goal of multiobjective optimization. Notwithstanding, when stochastic techniques such as metaheuristics are applied, the goal becomes obtaining a finite set of solutions having two properties: convergence to the true Pareto front and homogeneous diversity. The first property ensures that we are dealing with optimal solutions, while the second, which refers to obtaining a uniformly spaced set of solutions, indicates that we have carried out adequate exploration of the search space, so we are not losing valuable information.
To clarify these concepts, let us examine the three fronts included in Figure 5.1. Figure 5.1(a) shows a front having a uniform spread of solutions, but the points are far from a true Pareto front; this front is not attractive because it does not provide Pareto optimal solutions. The second example [Figure 5.1(b)] contains a set of solutions that are very close to the true Pareto front, but some regions of the true Pareto front are not covered, so the decision maker could lose important trade-off solutions. Finally, the front depicted in Figure 5.1(c) has the two desirable properties of convergence and diversity.

Figure 5.1 Examples of Pareto fronts: (a) poor convergence and good diversity; (b) good convergence and poor diversity; (c) good convergence and diversity.
5.3 DESCRIPTION OF THE METAHEURISTICS
In this section we detail briefly the main features of the techniques compared (for further information regarding the algorithms, see the references cited). We describe first NSGA-II and SPEA2, the two reference algorithms, to present three modern metaheuristics: AbYSS, OMOPSO, and MOCell. We include the settings of the most relevant parameters of the metaheuristics (summarized in Table 5.1).
Nondominated Sorting Genetic Algorithm II The NSGA-II algorithm proposed by Deb et al. [5] is based on obtaining a new population from the original one by applying typical genetic operators (i.e., selection, crossover, and mutation); then the individuals in the two populations are sorted according to their rank, and the best solutions are chosen to create a new population. In the case of having to select some individuals with the same rank, a density estimation based on measuring the crowding distance to the surrounding individuals belonging to the same rank is used to get the most promising solutions.
We have used a real-coded version of NSGA-II and the parameter settings used by Deb et al. [5]. The operators for crossover and mutation are simulated binary crossover (SBX) and polynomial mutation, with distribution indexes of μc = 20 and μm = 20, respectively. The crossover probability pc = 0.9 and mutation probability pm = 1/n (where n is the number of decision variables) are used. The population size is 100 individuals.
TABLE 5.1 Parameter Setting Summary

Strength Pareto Evolutionary Algorithm SPEA2 was proposed by Zitzler et al. [25]. In this algorithm, each individual is assigned a fitness value, which is the sum of its strength raw fitness and a density estimation. The algorithm applies the selection, crossover, and mutation operators to fill an archive of individuals; then individuals of both the original population and the archive are copied into a new population. If the number of nondominated individuals is greater than the population size, a truncation operator based on calculating distances to the kth nearest neighbor is used. In this way, individuals having the minimum distance to any other individual are chosen for removal.
We have used the following values for the parameters: both the population and the archive have a size of 100 individuals, and the crossover and mutation operators are the same as those used in NSGA-II, employing the same values for their application probabilities and distribution indexes.
Optimized MOPSO OMOPSO is a particle swarm optimization algorithm for solving MOPs [17]. Its main features include use of the NSGA-II crowding distance to filter out leader solutions, the use of mutation operators to accelerate the convergence of the swarm, and the concept of ![]() -dominance to limit the number of solutions produced by the algorithm. We consider here the leader population obtained after the algorithm has finished its result.
-dominance to limit the number of solutions produced by the algorithm. We consider here the leader population obtained after the algorithm has finished its result.
We have used a swarm size of 100 particles and a leader archive of 100 elements. Two mutation operators are used, uniform and nonuniform (for further details as to how the mutation operators are used, see ref. 17). The values of the mutation probability and ![]() are 1/n and 0.0075, respectively.
are 1/n and 0.0075, respectively.
Multiobjective Cellular Genetic Algorithm MOCell is an adaptation of the canonical cellular genetic algorithm model to the multiobjective field [14]. MOCell uses an external archive to store the nondominated solutions found during execution of the algorithm, as many other multiobjective evolutionary algorithms do (e.g., PAES, SPEA2, OMOPSO). In this chapter we use the fourth asynchronous version of MOCell described by Nebro et al. [15].
The parameter settings of MOCell are the following. The size of the population and the archive is 100 (a grid of 10 × 10 individuals). The mutation and crossover operators are the same as those used in NSGA-II, with the same values as to probabilities and distribution indexes.
Archive-Based Hybrid Scatter Search AbYSS is an adaptation of the scatter search metaheuristic to the multiobjective domain [16]. It uses an external archive to maintain the diversity of the solutions found; the archive is similar to the one employed by PAES [12], but uses the crowding distance of NSGA-II instead of PAES's adaptive grid. The algorithm incorporates operators of the evolutionary algorithm domain, including polynomial mutation and simulated binary crossover in the improvement and solution combination methods, respectively.
We have used the parameter settings of Nebro et al. [16]. The size of the initial population P is equal to 20, and the reference sets RefSet1 and RefSet2 have 10 solutions. The mutation and crossover operators are the same as those used in NSGA-II, with the same values for their distribution indexes.
5.4 EXPERIMENTAL METHODOLOGY
This section is devoted to presenting the methodology used in the experiments carried out in this chapter. We first define the quality indicators used to measure the search capabilities of the metaheuristics. After that, we detail the set of MOPs used as a benchmark. Finally, we describe the statistical tests that we employed to ensure the confidence of the results obtained.
5.4.1 Quality Indicators
To assess the search capabilities of algorithms regarding the test problems, two different issues are normally taken into account: The distance from the Pareto front generated by the algorithm proposed to the exact Pareto front should be minimized, and the spread of solutions found should be maximized, to obtain as smooth and uniform a distribution of vectors as possible. To determine these issues it is necessary to know the exact location of the true Pareto front; in this work, we use a set of benchmark problems whose Pareto fronts are known (families ZDT, DTLZ, and WFG; see Section 5.4.2).
The quality indicators can be classified into three categories, depending on whether they evaluate the closeness to the Pareto front, the diversity in the solutions obtained, or both [4]. We have adopted one indicator of each type.
Inverted Generational Distance (IGD) This indicator was introduced by Van Veldhuizen and Lamont [21] to measure how far the elements are in the Pareto optimal set from those in the set of nondominated vectors, defined as

where n is the number of vectors in the Pareto optimal set and di is the Euclidean distance (measured in objective space) between each of these solutions and the nearest member of the set of nondominated vectors found. A value of IGD = 0 indicates that all the elements generated are in the Pareto front and they cover all the extension of the Pareto front. To get reliable results, nondominated sets are normalized before calculating this distance measure.
Spread The spread metric [5] is a diversity metric that measures the extent of spread achieved among the solutions obtained. This metric is defined as

where di is the Euclidean distance between consecutive solutions, ![]() the mean of these distances, and df and dl the Euclidean distances to the extreme (bounding) solutions of the exact Pareto front in the objective space (see ref. 5 for details). This metric takes the value zero for an ideal distribution, pointing out a perfect spread out of the solutions in the Pareto front. We apply this metric after a normalization of the objective function values.
the mean of these distances, and df and dl the Euclidean distances to the extreme (bounding) solutions of the exact Pareto front in the objective space (see ref. 5 for details). This metric takes the value zero for an ideal distribution, pointing out a perfect spread out of the solutions in the Pareto front. We apply this metric after a normalization of the objective function values.
Hypervolume (HV) The HV indicator calculates the volume, in the objective space, covered by members of a nondominated set of solutions Q for problems where all objectives are to be minimized [26]. In the example depicted in Figure 5.2, HV is the region enclosed within the dashed line, where Q = {A, B, C} (in the figure, the shaded area represents the objective space that has been explored). Mathematically, for each solution i ∈ Q, a hypercube υi is constructed with a reference point W and the solution i as the diagonal corners of the hypercube. The reference point can be found simply by constructing a vector of the worst objective function values. Thereafter, a union of all hypercubes is found and its hypervolume is calculated:
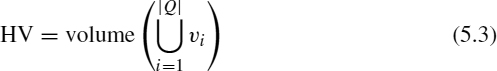

Figure 5.2 Hypervolume enclosed by the nondominated solutions.
Algorithms with higher HV values are desirable. Since this indicator is not free from arbitrary scaling of objectives, we have evaluated the metric using normalized objective function values.
HV is a Pareto-compliant quality indicator [13], while the IDG and the spread are Pareto noncompliant. A Pareto-compliant indicator assures that whenever a Pareto front A is preferable to a Pareto front B with respect to Pareto dominance, the value of the indicator for A should be at least as good as the indicator value for B. Conversely, Pareto-noncompliant indicators are those that do not fulfill this requirement. The use of only Pareto-compliant indicators should be preferable; however, many works in the field employ noncompliant indicators. The justification is that they are useful to assess only an isolated aspect of an approximation set's quality, such as proximity to the optimal front or its spread in the objective space. Thus, they allow us to refine the analysis of set of solutions having identical Pareto-compliant indicator values.
5.4.2 Test Problems
In this section we describe the various sets of problems solved in this work. These problems are well known, and they have been used in many studies in this area. The problem families are the following:
- Zitzler–Deb–Thiele (ZDT). This benchmark comprises five bi-objective problems [24]: ZDT1 (convex), ZDT2 (nonconvex), ZDT3 (nonconvex, disconnected), ZDT4 (convex, multimodal), and ZDT6 (nonconvex, nonuniformly spaced). These problems are scalable according to the number of decision variables.
- Deb–Thiele–Laumanns–Zitzler (DTLZ). The problems of this family are scalable in both number of variables and objectives [6]. The family consists of the following seven problems: DTLZ1 (linear), DTLZ2 to 4 (nonconvex), DTLZ5 and 6 (degenerate), and DTLZ7 (disconnected).
- Walking Fish Group (WFG). This set consists of nine problems, WFG1 to WFG9, constructed using the WFG toolkit [10]. The properties of these problems are detailed in Table 5.2. They are all scalable as to both number of variables and number of objectives.
In this chapter we use the bi-objective formulation of the DTLZ and WFG problem families. A total of 21 MOPs are used to evaluate the five metaheuristics.
5.4.3 Statistical Tests
Since we are dealing with stochastic algorithms and we want to provide the results with confidence, we have made 100 independent runs of each experiment, and the following statistical analysis has been performed throughout this work [7,19]. First, a Kolmogorov–Smirnov test is used to check whether or not the values of the results follow a normal (Gaussian) distribution. If the distribution is normal, the Levene test checks for the homogeneity of the variances (homo-cedasticity). If the sample has equal variance (positive Levene test), an ANOVA test is carried out; otherwise, a Welch test is performed. For non-Gaussian distributions, the nonparametric Kruskal–Wallis test is used to compare the medians of the algorithms. Figure 5.3 summarizes the statistical analysis.
TABLE 5.2 Properties of the MOPs Created Using the WFG Toolkit


Figure 5.3 Statistical analysis performed in this work.
In this chapter we always use a confidence level of 95% (i.e., significance level of 5% or p-value under 0.05) in the statistical tests, which means that the differences are unlikely to have occurred by chance with a probability of 95%.
5.5 EXPERIMENTAL ANALYSIS
In this section we analyze the five metaheuristics according to the quality indicators measuring convergence, diversity, and both features (see Tables 5.3 to 5.5). Successful statistical tests are marked with + signs in the last column in all the tables in this section; conversely, a − sign indicates that no statistical confidence was found (p-value > 0.05). Each data entry in the tables includes the median, ![]() , and interquartile range, IQR, as measures of location (or central tendency) and statistical dispersion, because, on the one hand, some samples follow a Gaussian distribution whereas others do not, and on the other hand, mean and median are theoretically the same for Gaussian distributions. Indeed, whereas the median is a feasible measure of central tendency in both Gaussian and non-Gaussian distributions, using the mean makes sense only for Gaussian distributions. The same holds for the standard deviation and the interquartile range.
, and interquartile range, IQR, as measures of location (or central tendency) and statistical dispersion, because, on the one hand, some samples follow a Gaussian distribution whereas others do not, and on the other hand, mean and median are theoretically the same for Gaussian distributions. Indeed, whereas the median is a feasible measure of central tendency in both Gaussian and non-Gaussian distributions, using the mean makes sense only for Gaussian distributions. The same holds for the standard deviation and the interquartile range.
TABLE 5.3 Median and Interquartile Range of the IGD Quality Indicator, ![]()

TABLE 5.4 Median and Interquartile Range of the Δ Quality Indicator, ![]()

TABLE 5.5 Median and Interquartile Range of the HV Quality Indicator, ![]()

The best result for each problem is shown in boldface type. For the sake of better understanding, we have used italic to indicate the second-best result; in this way, we can visualize at a glance the best-performing techniques. Furthermore, as the differences between the best and second-best values are frequently very small, we try to avoid biasing our conclusions according to a unique best value. Next, we analyze in detail the results obtained.
5.5.1 Convergence
We include in Table 5.3 the results obtained when employing the IGD indicator. We observe that MOCell obtains the lowest (best) values in 10 of the 21 MOPs (the boldface values) and with statistical confidence in all cases (see the + signs in the last column of the table). This means that the resulting Pareto fronts from MOCell are closer to the optimal Pareto fronts than are those computed by the other techniques. OMOPSO achieves the lowest values in five MOPs, but it fails when solving the problems ZDT4, DTLZ1, and DTLZ3 (see the noticeable differences in the indicator values in those problems). The third algorithm in the ranking is AbYSS, and it is noticeable for the poor performance of the reference algorithms, NSGA-II and SPEA2, which get the best values in only 2 and 1 of the 21 MOPs considered, respectively. If we consider the second-best values (the italic values), our claims are reinforced, and MOCell is clearly the best algorithm according to the convergence of the Pareto fronts obtained.
5.5.2 Diversity
The values obtained after applying the Δ quality indicator are included in Table 5.4. The results indicate that MOCell gets the lowest values in 10 of the 21 MOPs, whereas AbYSS and OMOPSO produce the lowest values in 6 and 5 MOPs, respectively. NSGA-II and SPEA2 are the last algorithms in the ranking, and none of them produces the best results in any of the 21 problems considered. If we look at the second-lowest values, it is clear that MOCell is the most salient algorithm according to the diversity property in the MOPs solved: It provides the lowest or second-lowest Δ values in all the problems.
5.5.3 Convergence and Diversity: HV
The last quality indicator we considered is the hypervolume (HV), which gives us information about both convergence and diversity of the Pareto fronts. The values obtained are included in Table 5.5. Remember that the higher values of HV are desirable. At first glance, if we consider only the highest values, the ranking of the techniques would be, first, AbYSS and OMOPSO, and then MOCell, NSGA-II, and SPEA2. However, OMOPSO gets an HV value of 0 in three MOPs. This means that all the solutions obtained are outside the limits of the true Pareto front; when applying this indicator, these solutions are discarded, because otherwise the value obtained would be unreliable. We can observe that all of the metaheuristics get a value of 0 in problem DTLZ3. With these considerations in mind, the best technique would be AbYSS, followed by MOCell.
This conclusion could be a bit contradictory, because it is against the fact that MOCell was the more accurate algorithm according to the IGD and Δ indicators. However, closer observation shows that the differences in problems DTLZ4, WFG5, and WFG8, compared to the highest values, are negligible: the medians are the same, and they are worse only in the interquartile range. In fact, taking into account the second-highest values, we can conclude that MOCell is the most outstanding algorithm according to HV. Again, the poor behavior of NSGA-II and SPEA2 is confirmed by this indicator.
5.5.4 Discussion
Previous work has revealed that MOCell [14] and AbYSS [16] outperformed NSGA-II and SPEA2 in a similar benchmark of MOPs. Inclusion in the same study of these four techniques, plus OMOPSO, leads to the result that NSGA-II and SPEA2 appear to be the worst techniques. We note that all the results presented in the tables have statistical confidence.
Our study indicates that in the context of the problems, quality indicators, and parameter settings used, modern advanced metaheuristics can provide better search capabilities than those of the classical reference algorithms. In particular, MOCell is the most salient metaheuristic in this comparison. If we take into account that MOCell uses, as many metaheuristics do, the ranking scheme and the crowding distance indicator of NSGA-II (see ref. 15 for more details), the conclusion is that the cellular cGA model is particularly well suited to solving the MOPs considered in our study.
To finish this section, we include three graphics showing some Pareto fronts produced by the algorithms we have compared (we have chosen a random front out of the 100 independent runs). In each figure, the fronts are shifted along the Y -axis to provide a better way to see at a glance the varying behavior of the metaheuristics.
In Figure 5.4 we depict the fronts obtained when solving problem ZDT1, a convex MOP. The spread of the points in the figure corroborates the excellent values of the Δ indicator obtained by OMOPSO and MOCell (see Table 5.4). The poor performance of NSGA-II is also shown clearly.
We show next the fronts produced when solving the nonconvex MOP DTLZ2 in Figure 5.5. In this example, MOCell and AbYSS give the fronts that have the best diversity, as can be seen in Table 5.4. Although the convergence property cannot be observed in the figure, the IGD values of these algorithms in this problem (see Table 5.3) indicate that MOCell and AbYSS get the most accurate Pareto fronts.

Figure 5.4 Pareto fronts obtained when solving problem ZDT1.

Figure 5.5 Pareto fronts obtained when solving problem DTLZ2.

Figure 5.6 Pareto fronts obtained when solving problem WFG3.
The final example, shown in Figure 5.6, is the degenerated problem WFG3, which in its bi-objective formulation presents a linear Pareto front. This problem is another example of the typical behavior of the metaheuristics we have compared in many of the problems studied: MOCell, OMOPSO, and AbYSS produce fronts having the best diversity; SPEA2 and NSGA-II are a step beyond them.
5.6 CONCLUSIONS
In this chapter we have compared three modern multiobjective metaheuristics against NSGA-II and SPEA2, the reference algorithms in the field. To evaluate the algorithms, we have used a rigorous experimentation methodology. We have used three quality indicators, a set of MOPs having different properties, and a statistical analysis to ensure the confidence of the results obtained.
A general conclusion of our study is that advanced metaheuristics algorithms can outperform clearly both NSGA-II and SPEA2. In the context of this work, NSGA-II obtains the best result in only 2 problems out of the 20 that constitute the benchmark with regard to the IGD and HV quality indicators, and SPEA2 yields the best value in only one MOP using the same indicators.
The most outstanding algorithm in our experiments is MOCell. It provides the overall best results in the three quality indicators, and it is worth mentioning that it yields the best or second-best value in all the problems in terms of diversity. The scatter search algorithm, AbYSS, and the PSO technique, OMOPSO, are the two metaheuristics that follow MOCell according to our tests. However, we consider that the behavior of AbYSS is better than that of OMOPSO, because this is a less robust technique, as shown by the poor values in HV of OMOPSO in problems ZDT4, DTLZ1, and DTLZ3.
We plan to extend this study in the future by adding more recent metaheuristics. We have restricted our experiments to bi-objective problems, so a logical step is to include in further work at least the DTLZ and WFG problem families, using their three-objective formulation.
Acknowledgments
This work has been partially funded by the Ministry of Education and Science and FEDER under contract TIN2005-08818-C04-01 (the OPLINK project). Juan J. Durillo is supported by grant AP-2006-03349 from the Spanish government.
REFERENCES
1. C. Blum and A. Roli. Metaheuristics in combinatorial optimization: overview and conceptual comparison. ACM Computing Surveys, 35(3):268–308, Sept. 2003.
2. R. L. Carraway, T. L. Morin, and H. Moskowitz. Generalized dynamic programming for multicriteria optimization. European Journal of Operational Research, 44:95–104, 1990.
3. C. A. Coello, D. A. Van Veldhuizen, and G. B. Lamont. Genetic algorithms and evolutionary computation. In Evolutionary Algorithms for Solving Multi-objective Problems. Kluwer Academic, Norwell, MA, 2002.
4. K. Deb. Multi-objective Optimization Using Evolutionary Algorithms. Wiley, New York, 2001.
5. K. Deb, A. Pratap, S. Agarwal, and T. Meyarivan. A fast and elitist multiobjective genetic algorithm: NSGA-II. IEEE Transactions on Evolutionary Computation, 6(2):182–197, 2002.
6. K. Deb, L. Thiele, M. Laumanns, and E. Zitzler. Scalable test problems for evolutionary Multi-objective optimization. In A. Abraham, L. Jain, and R. Goldberg, eds., Evolutionary Multiobjective Optimization: Theoretical Advances and Applications. Springer-Verlag, New York, 2005, pp. 105–145.
7. J. Demšar. Statistical comparison of classifiers over multiple data sets. Journal of Machine Learning Research, 7:1–30, 2006.
8. J. J. Durillo, A. J. Nebro, F. Luna, B. Dorronsoro, and E. Alba. jMetal: a Java framework for developing multi-objective optimization metaheuristics. Technical Report ITI- 2006-10, Departamento de Lenguajes y Ciencias de la Computación, Universidad de Málaga, E.T.S.I. Informática, Campus de Teatinos, Spain, Dec. 2006.
9. F. W. Glover and G. A. Kochenberger. Handbook of Metaheuristics (International Series in Operations Research and Management Sciences). Kluwer Academic, Norwell, MA, 2003.
10. S. Huband, L. Barone, R. L. While, and P. Hingston. A scalable multi-objective test problem toolkit. In C. Coello, A. Hernández, and E. Zitler, eds., Proceedings of the 3rd International Conference on Evolutionary Multicriterion Optimization (EMO'05), vol. 3410 of Lecture Notes in Computer Science. Springer-Verlag, New York, 2005, pp. 280–295.
11. D. Jaeggi, G. Parks, T. Kipouros, and J. Clarkson. A multi-objective tabu search algorithm for constrained optimisation problems. In C. Coello, A. Hernández, and E. Zitler, eds., Proceedings of the 3rd International Conference on Evolutionary Multicriterion Optimization (EMO'05), vol. 3410 of Lecture Notes in Computer Science. Springer-Verlag, New York, 2005, pp. 490–504.
12. J. Knowles and D. Corne. The Pareto archived evolution strategy: a new baseline algorithm for multiobjective optimization. In Proceedings of the 1999 Congress on Evolutionary Computation. IEEE Press, Piscataway, NJ, 1999, pp. 9–105.
13. J. Knowles, L. Thiele, and E. Zitzler. A tutorial on the performance assessment of stochastic multiobjective optimizers. Technical Report 214. Computer Engineering and Networks Laboratory (TIK), ETH, Zurich, Switzerland, 2006.
14. A. J. Nebro, J. J. Durillo, F. Luna, B. Dorronsoro, and E. Alba. A cellular genetic algorithm for multiobjective optimization, In D. A. Pelta and N. Krasnogor, eds., NICSO 2006, pp. 25–36.
15. A. J. Nebro, J. J. Durillo, F. Luna, B. Dorronsoro, and E. Alba. Design issues in a multiobjective cellular genetic algorithm. In S. Obayashi, K. Deb, C. Poloni, T. Hiroyasu, and T. Murata, eds., Proceedings of the 4th International Conference on Evolutionary MultiCriterion Optimization (EMO'07), vol. 4403 of Lecture Notes in Computer Science. Springer-Verlag, New York, 2007, pp. 126–140.
16. A. J. Nebro, F. Luna, E. Alba, B. Dorronsoro, J. J. Durillo, and A. Beham. AbYSS: adapting scatter search to multiobjective optimization. Accepted for publication in IEEE Transactions on Evolutionary Computation, 12(4):439–457, 2008.
17. M. Reyes and C. A. Coello Coello. Improving pso-based multi-objective optimization using crowding, mutation and ![]() -dominance. In C. Coello, A. Hernández, and E. Zitler, eds., Proceedings of the 3rd International Conference on Evolutionary MultiCriterion Optimization, (EMO'05), vol. 3410 of Lecture Notes in Computer Science, Springer-Verlag, New York, 2005, pp. 509–519.
-dominance. In C. Coello, A. Hernández, and E. Zitler, eds., Proceedings of the 3rd International Conference on Evolutionary MultiCriterion Optimization, (EMO'05), vol. 3410 of Lecture Notes in Computer Science, Springer-Verlag, New York, 2005, pp. 509–519.
18. T. Sen, M. E. Raiszadeh, and P. Dileepan. A branch and bound approach to the bicriterion scheduling problem involving total flowtime and range of lateness. Management Science, 34(2):254–260, 1988.
19. D. J. Sheskin, Handbook of Parametric and Nonparametric Statistical Procedures. CRC Press, Boca Raton, FL, 2003.
20. B. S. Stewart and C. C. White. Multiobjective A*. Journal of the ACM, 38(4): 775–814, 1991.
21. D. A. Van Veldhuizen and G. B. Lamont. Multiobjective evolutionary algorithm research: a history and analysis. Technical Report TR- 98-03. Department of Electrical and Computer Engineering, Graduate School of Engineering, Air Force Institute of Technology, Wright-Patterson, AFB, OH, 1998.
22. M. Visée, J. Teghem, M. Pirlot, and E. L. Ulungu. Two-phases method and branch and bound procedures to solve knapsack problem. Journal of Global Optimization, 12:139–155, 1998.
23. A. Zhou, Y. Jin, Q. Zhang, B. Sendhoff, and E. Tsang, Combining model-based and genetics-based offspring generation for multi-objective optimization using a convergence criterion. In Proceedings of the 2006 IEEE Congress on Evolutionary Computation, 2006, pp. 3234–3241.
24. E. Zitzler, K. Deb, and L. Thiele, Comparison of multiobjective evolutionary algorithms: empirical results. Evolutionary Computation, 8(2):173–195, 2000.
25. E. Zitzler, M. Laumanns, and L. Thiele. SPEA2: Improving the strength Pareto evolutionary algorithm. Technical Report 103. Computer Engineering and Networks Laboratory (TIK), Swiss Federal Institute of Technology (ETH), Zurich, Switzerland, 2001.
26. E. Zitzler and L. Thiele, Multiobjective evolutionary algorithms: a comparative case study and the strength Pareto approach. IEEE Transactions on Evolutionary Computation, 3(4):257–271, 1999.
Optimization Techniques for Solving Complex Problems, Edited by Enrique Alba, Christian Blum, Pedro Isasi, Coromoto León, and Juan Antonio Gómez
Copyright © 2009 John Wiley & Sons, Inc.