
CHAPTER 13
Improving Process Flow and Speed to Achieve Lean Process
People are always blaming their circumstances for what they are.
I don’t believe in circumstances.
The people who get on in this world are the people who get up and look for the circumstances they want, and, if they can’t find them, make them
– George Bernard Shaw
SYNOPSIS
Unhampered process flow and speedy process are the key elements to eliminate waste and defects. Hence, time traps and non-value adding activities need to be identified to minimise work in process (WIP) and expedite the process. Certain basic measurements on flow and WIP are needed to gauge and quantify the problem. Lean refers to a process that is fast without WIP, time traps and non-value adding activities.
Background
We have already dealt with the methods and approaches for elimination of the causes of defects and their prevention at source. It is also seen that the route to defect elimination is through reduction in process variation. It is pointed out in Chapter 12 that the Sigma value of a process indicates its defect level and the process that has to attain the defect level of 3.4 ppm has 4.5 as its Sigma value equivalent to the process capability index of 1.5.
Process flow and process speed
In any process, its process flow and process steps can be a source of problems. Process flow is the physical path the work takes from start to finish. In this path, there are steps where the work undergoes value transformation. If both of these are examined, it would be possible to know the unnecessary ‘movements’ that add to cost and delay; non-value adding jobs at each step also add to delay, waste and hence add to cost. Thus, focusing on ‘path and steps’ of a process can lead to expediting the process and also reduce cost through waste elimination. Every process offers immense scope to speed up as well as to eliminate waste inherent in the process. In this context, it is worth recalling what Dr. W. Edwards Deming said years ago: “Most quality problems are ‘in the process, not in the person’; ‘96% of the problems’ are built into the work system”. Thus, it stands to reason that to improve quality, it is essential to change the way the work is done. This thought is much echoed in the words of Tom Peters as “Excellent firms do not believe in excellence—only in constant improvement and constant change—the way the work is done”.
Two streams of quality improvement
Thus, quality improvement has two streams
- to minimise process variation to Six Sigma level
- to improve process flow and speed
The expression Lean Six Sigma is used to signify that quality improvement has to focus on both the streams. All the previous chapters have focused on concepts, tasks and approaches related to defect elimination and prevention to reach Six Sigma level. This chapter deals with certain concepts and tools of analysis to improve process flow and speed and thus the cycle time.
Checklist of factors having a bearing on process flow and speed
Table 13.1 lists the various types of factors that affect process flow and speed. The list is not exhaustive but illustrative and is applicable to manufacturing process. A similar list can be prepared for any type of process.
Lean Six Sigma
From the checklist, it can be observed that poor quality (defects) also arises from factors that ‘hold-up’ the processes. Hence, to prevent defects, it is necessary to prevent process hold-ups and ensure that there is no hindrance to process flow and process speed. This task is signified by the word lean in the expression Lean Six Sigma. The tools to accomplish this task are essentially the same as applied to prevention of defects, viz., flow chart as described in Chapter 6 and process review for prevention of hold-ups due to several factors listed in Table 13.1. It can be noted from Table 13.1 that some of the factors of delay lead to defects.
Addressing the factors of hold-up
Hold-up can be related to a process flow as well as process speed. While looking at a factor of hold-up, check whether it is contributing to value of the work or not. If it is not contributing, the focus should be on its elimination. This value analysis for a long established job is difficult due to the significance given to tradition and past practice. Tradition and practice of the past would have been accepted and followed without looking at them objectively to ensure their continued relevance. This normal situation generally found in many places would invariably imply certain activities which are no longer necessary. These turn out to be non-value adding activities and, therefore, need to be identified and squeezed out. It is for this reason one has to tear oneself apart from the traditional path of thinking in order to question the relevance of the past practices and identify the non-value adding activities. This rational attitude of tearing oneself off from the traditional thinking on any issue also facilitates searching for new solutions found useful elsewhere. Hence, this rational attitude is also referred to as ‘out-of-box thinking’ and new solutions found as ‘out-of-box solutions’. This is the common concern that governs the analysis of each factor of hold-up.
TABLE 13.1 Master List of Factors that Affect Process Flow and Speed
Factors/aspects that affect flow and speed of a process |
||
|---|---|---|
Waiting for
|
Movement to fetch
|
Searching for
|
Activities
|
Handling
|
Late starting
|
Early closing
|
In-feed material
|
Out flow
|
Errors
|
Re-processing/rework
|
Interruptions in utilities
|
Environmental disturbances due to
|
Work set-up
|
Processing time
|
Floor space usage
|
Housekeeping
|
Customer service station/window set-up
|
Paper work
|
Work in process
|
Lead time
|
Layout
|
Meetings
|
Bureaucratic practices
|
Push and pull out
|
||
A few factors listed in Table 13.1 are discussed in the following sections. The line of thinking and approach illustrated for few factors are common to all the factors and possibly help in coming out with out-of-box solutions also.
Waiting for approval
Usually two levels are specified to get approval. If each level affixes the signature, but adds no wisdom or value to the decision, then it definitely leads to delay. This is a common experience. Why not delegate the power to the lowest level possible with proper accountability and review.
A historical example of delegating authority to the lowest level possible can be found in the institutions of great learning of the distant past at Nalanda and Taxila where, it is learnt, that the gatekeepers of the institutions had the authority to admit only those who passed the tests conducted by them.
Waiting for maintenance
The waiting time attributed to maintenance has several components as:
- Time lapse between the time of breakdown and its reporting to maintenance.
- Time lapse between the time of receipt of information and visiting the site of breakdown and starting the work.
- Time lapse between the time taken to organise the men and materials.
- Time taken on the maintenance work as such.
- Time lapse between the completion of maintenance job and handing over to the user.
- Time lapse between taking over and restarting.
Time loss due to waiting in a typical situation can turn out to be significant and the total loss comprises several components as illustrated here for a maintenance job. This point is not realised as no measurements are made. On a sampling basis, it is better to take measurements on each of the components of time lapse, to assess the magnitude of the problem as well as actions to be taken to minimise the delay appropriately on each constituent. Waiting is a universal problem and source of suffering for customers. For example, in hospitals, patients wait (suffer) to receive the services from medical and para-medical agencies, and in most cases, waiting time is more than that of treatment time. In many cases, this is far greater than the time spent on treatment.
Movement
Movement in the workplace is taken for granted to be legitimate and necessary. Movement can imply movement of personnel, material, information/data or all. A critical review of every movement helps to know whether it is necessary or unnecessary; and if necessary, whether it can be reduced in terms of its duration as well as frequency. In any study on movement, it is better to map the route. Subject the route map to a questioning-drill in terms of 5 Ws—what, where, which, why, who and 1 H—how. This questioning of each point in the route map helps to bring about modifications for the better. This ‘5W–1H scrutiny’ is very much facilitated when the following questions are raised.
- Why is this movement required?
- How to shorten the distance?
- What is the frequency of movement per hour?
- How can the frequency be reduced?
A number of solutions such as rearrangement, telephone connection and interconnecting door/windows can be suggested, once the right questions are raised and measurements are made to know the magnitude of the problem.
Searching
Searching is also perceived as an integral part of work. It is not commonly felt that searching is a waste of time, impediment to process flow and a cause of process hold-up. If every instance of ‘searching’ that generally occurs is captured and reasons necessitating the search are found, actions to prevent search can be taken. Solutions in most of the cases would be simple, e.g., identification, classification, labelling, rearrangement.
Formats and records
Criteria of a good format are as follows:
- Serves as a learning tool for a newcomer.
- Makes one remember all the details.
- Reflects what actions need to be taken.
- Freezes the operational ‘know-how’ as on date.
- Provides authentication of the reports.
- Arranges information inputs logically.
- Holds a reference to its revision number and date of format.
It is a good practice to critically review each format against the given criteria, as an ill-devised format is a waste of time and effort. This may not be felt if computers were to be used to tabulate the data. In such a case, computers are a shield to conceal the inefficiency, a worst situation that needs to be set right.
Valuable insight is gained to modify or discard the format if the following issues are examined related to the report generated from a format. When a format gets filled up, it becomes a record and when records spread over a period of time are summarised, it becomes a report.
- Who are the users?
- Are they aware of how to understand and interpret the information, in order to use it or act upon it?
- Are they entitled to act upon it?
- If entitled, are they taking action?
- If so, are there evidences of having taken action?
Information thus obtained can help to identify, to which of the following categories a report can belong and thus take relevant action—continue, activate or discard the reports and hence the format.
- Have lost their relevance but continue to keep up the ‘tradition’.
- Are generated to save one’s skin.
- Are of potential value and use.
- Are being used properly.
Meetings
Every organisation resorts to conducting meetings in order to serve the following common purposes.
- To discuss issues and reach consensus.
- To convey decisions taken and thereby to ensure implementation.
- To review progress made and plan follow-up action.
- To understand difficulties and resolve them.
A good deal of time and effort is spent on meetings. The cost of conducting a meeting is quite high and is never computed. Meetings are worth their high cost only if they turn out to be effective. This largely rests on ‘communication’ and the manner in which communication is handled during the meeting to (a) ensure full and active participation of each participant in the meeting and (b) be focused on arriving at a decision and/or consensus at the end of the session. Use of IT is of immense value in conducting a meeting.
An audit of the quality of meetings needs to be conducted to evaluate their effectiveness—punctuality, agenda, participation, decision, follow-up action, effectiveness of action, etc. Based on the results obtained, suitable action to improve the quality of meetings can be taken.
Late starting and early closing
This matter which rests mostly with the ‘shop floor’ (cutting-edge action area) is not just a matter of discipline. In the case of manufacturing shop floor, instances are not few, where in spite of the willingness of the workmen to comply with timings, the basic arrangement made for transport and change rooms compels them to be late to the work spot and to leave early. Hence, the factors that cause the late start and early closure need to be examined and acted upon.
Push, pull and out
The following is a common spectacle to be witnessed in many places especially in the service area:
- ‘Busy’ with work that is not focused on the ‘Business’ of the ‘desk’. Why? Work (business) is yet to arrive at the desk.
Remedy—Why wait for arrival? Seek and demand, work. This is ‘pull’.
- Desk is ‘cluttered’ up.
‘File’ cannot take any more. Work is dislocated.
Why? The finished work has piled up without reaching the next stage.
Remedy—Why create this situation? Do not wait for the next stage to take the work. ‘Dump’ on it, clear the desk. This is ‘push’.
Every workstation/desk must resort to the practice of push, pull and out, to ensure that there is no hold-up and that the process is expedited. Necessary facilities need to be created. In the case of manufacturing, such facilities may be providing adequate number of containers, devices to move materials, besides proper planning of production to maintain uniform flow.
Process set-up
In any process, prior to starting, it has to be ‘set-up’ for continuous operation. The nature of the set-up changes from process to process. For example, in a stamping operation, the appropriate dye and punch is fixed into the press, aligned, tightened, tried and if found all right, the set-up is cleared for production; otherwise, the entire cycle is repeated till the right set-up is achieved.
In a surgical process, the set-up consists of pre-fixing and notifying to all concerned—the operation theatre, date and time, recovery room, the patient, the surgeon concerned, the anesthetist concerned, surgical team of nurses, the surgical kit and linen appropriate for the surgery, the blood of the right group—so that the patient, kept ready in time for surgery, is received on time for the surgical process in the prescribed manner.
A comparison of these two examples brings out two distinct types of action on the set-up. The first one belongs to the type where set-up is internal to the process in the sense that the time taken for the set-up eats into its production time and hence is a source for delay, building up WIP and slowing down the process.
In the second example, the set-up is totally external to the process and hence it is devoid of the drawbacks of the first type. This contrast holds the key to speeding up a process and it lies in converting the internal set-up into external set-up.
Therefore, internal process set-up is an important area to speed up the process and it can be addressed in the following manner, a method that has come to be known as SMED (single-minute exchange die method).
- Review the activities involved in the internal process set-up.
- Identify the activities that are being carried out for which machine has to be stopped.
- Examine whether activities in (2) could be done without having to stop the machine, and if so, how?
- Implement the change over methods and thus minimise the internal set-up time.
- Streamline the internal set-up activities to reduce the time, especially of those which are done when the machine is stopped.
- Examine how the entire internal set-up could be transformed into an external one.
Work in process, lead time and process cycle efficiency
An understanding of three aspects of a process is necessary to speed up the process.
Work in process
Work in process (WIP) is the amount of work that is in a process and is not yet complete. Work can be anything from customer requests, cheques waiting for processing, phone calls to return, reports to complete, e-mails to be responded, etc. Measuring or calculating WIP is fundamental. The amount of WIP is an overall indicator of process health. Eliminating WIP means getting the work done faster.
Work in process represents the work ‘that is waiting to be worked upon’. This WIP is said to be in queue and the time it sits around is the queue time. Any time that a work sits in queue is counted as delay. No matter what the underlying cause is, delay has to be reduced. In a manufacturing activity, it is physically possible to see and trace WIP in its diverse forms. This is not so in the case of service activity. Work itself is something less visible—reports or orders waiting to be processed, e-mails awaiting responses, customers ‘on hold’, etc. Process maps do help to make the invisible visible and understand flow of work and assess WIP.
Lead time/process speed
Lead time is the time it takes to deliver the service or product once the order is triggered. A simple equation, given here, known as Little’s law named after the mathematician Little helps to understand the lead time
Completion rate is the quantity of work that gets finished in any given period of time— hours, days, weeks and months.
Knowing WIP and completion rate are important. It is a difficult task to assess the completion rate. It is worthwhile to track the entire route that an order takes to complete. Increasing completion rate means to increase the rate of output by actually doing the work. This is another way to reduce the lead time. Thus, reducing lead time can be through reducing WIP, increasing completion rate or both.
Analysis of process lead time and process velocity
Process lead time Process lead time is the time taken for WIP at the process to get completed. If the WIP at a process is 120 units and completion rate is 5 units per hour, the lead time is 24 hr. It represents the time taken to process 120 units standing as WIP at the process.
Process velocity Process velocity refers to the time taken to eject one unit of the WIP out of the process. It is the rate of depletion of WIP or the rate of movement of WIP. In the given example, 120 units take 24 hr to get completely depleted/processed. This means that one unit of WIP gets ejected every 1/24 hr (2.5 min). In other words, one new unit can enter the process every 2.5 min. This rate of movement per unit of WIP is process velocity. It can be seen from the given example that process velocity is the reciprocal of process lead time.
Process velocity of a process chain Process chain is a string of processes. The process velocity of a chain of say i processes is equal to the sum total of the process velocity of the individual processes as represented here.
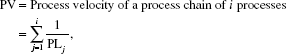
where PL is process lead time of any process j in the chain of i processes.
Analysis Consider the example given in Table 13.2.
TABLE 13.2 Analysis of WIP, Completion Rate, Lead Time
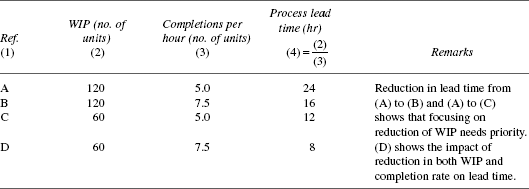
The following observations can be made from the analysis and these are also of general applicability to improve the speed of the process
- Focus on reducing WIP—first priority
- Focus on increasing completion rate—second priority
- Focus on both the aspects—third priority
In addition, consider the example given in Table 13.3.
TABLE 13.3 Analysis of WIP Lead Time Process Velocity
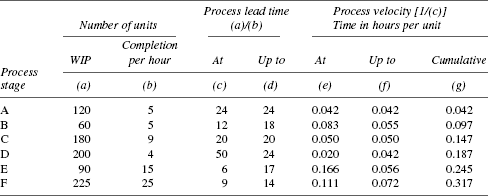
Following observations can be made regarding increasing process velocity.
- Focus on reducing WIP at process A, C and D.
- Focus on increasing completion rate at B, E and F.
- Process velocity of the chain, say at process D, is 1 unit every 12 min (0.187 hr) and the process velocity of the entire chain of six processes is 1 unit every 19 min (0.317 hr).
An analysis of this type stimulates thinking on where and how to improve the process flow, process and speed. An example of out-of-the-box thinking relevant to a situation where WIP is ‘infinity’ is given in Chapter 15.
Steps to be taken for preparing a database for an action plan to speed up a process are as follows.
- List out the possible causes for delay. Cause of delay is a time-trap.
- List out the processing stages.
- Collect cause-wise data on delay at each stage.
- Prepare focus area data sheet to address each time-trap of every stage.
A typical focus area data sheet based on the average time taken by an outpatient in a nursing home is given in Table 13.4. This is based on tracking 100 patients through a specially designed database for the purpose of tracking the delays.
This example is discussed further in Chapter 27.
TABLE 13.4 Average Time Spent by an Outpatient

Value-added time Lean means speed. A lean process as per the prevailing view is one in which the value-added time in the process is more than 25 per cent of the total lead time of that process. In this context, it is essential to identify value-adding activities associated with a process.
Every activity takes time. Every activity appears like one that adds value. To think otherwise is hurting one’s ego! In reality, many activities are not value adding. Hence, it is necessary to scan each activity to decide whether it adds value or not and take suitable actions on those that are not adding value.
The approach in Table 13.5 based on classifying every activity into the three categories as stated therein can help in the task of increasing the value-added activities associated with a process. This approach that fits into a manufacturing area is also of general applicability with a few marginal alterations.
TABLE 13.5 Classification of Activities According to their Value Addition Characteristics
| Adding value to customer | Adding value as they are essential | Non-value adding |
|---|---|---|
| Characteristics | ||
|
|
Contributes to added cost
|
| Action plan | ||
|
|
|
Process cycle efficiency (PCE)—the ‘lean metric’
As per the existing view, a lean process is one in which the value-added time in a process is more than 25 per cent of the total lead time of that process. This is as applicable to world-class efficiency. Typical PCE is around 3 per cent signifying considerable scope for improvement.
We have published four books so far. The total lead time over the four books—time from the date of acceptance of the text for publication to the time the book hits the stand was 1580 days. The value-added time—preparing final typeset, clearing final typeset, index preparation, cover design, printing and binding, release to the market—was 51 days.
One has to just measure the value-added time as well as lead time of each process one is handling to get surprised and shocked.
Lean Six Sigma
In the previous chapter, it is shown that process improvement can be achieved through reduction in defect rate by reducing process variation. This is the context of ‘Six Sigma’ comprising of increasing the value of z, the Sigma value of a process, to 4.5, which corresponds to a defect rate of 3.4 ppm. Thus, any process subjected to the ‘Six Sigma’ discipline of improvement has to benchmark its z value to 4.5.
In the present chapter, achieving process improvement by making it ‘lean’ through elimination delay, waste and increasing speed has been explained. The index of lean is defined as PCE-process cycle efficiency. The best possible PCE that is attainable is 25%. Hence any process subjected to the ‘lean’ discipline of improvement has to benchmark to the PCE value of 25%.
Therefore, the discipline of improvement through ‘Six Sigma’ as well as ‘lean’ is termed as ‘Lean Six Sigma’ and any process subjected to Lean Six Sigma discipline improvement has to benchmark its z value to 4.5 and PCE value to 25%.
Conclusion
Six Sigma and lean are complimentary to each other. Both depend on data for problem formulation, its analysis and investigation, actions to be implemented and evaluation of their effectiveness. While Six Sigma recognises that variation is the cause of defects and focuses on reducing variation, lean recognises that non-value adding jobs are the cause of delay, bottleneck and thus focuses on their reduction. Six Sigma seeks opportunities for defect prevention, lean seeks opportunities for breaking speed barriers, time traps and bottlenecks.
Any project taken up for continual improvement must have at the start of the project the baseline measurements related to the process with which the project is associated in terms of its z and PCE values. After investigation and implementation of all the improvement actions, the process must be re-evaluated in terms of its new z and PCE values. In case each of the values of z and PCE are found to be higher than their respective values before investigation, the study has achieved improvement that is sustainable and predictable because the improvement is due to the real health parameters of the process, viz., its variation, smooth flow and speed.
Comprehensive understanding of the ‘process of continual improvement’ is necessary to gain the desired competence in handling the task of continual improvement. This issue is addressed in Section D.