CHAPTER 27
Route Map for Handling a Project
Incrementalism is innovation’s worst enemy
– Nicholas Negroponte, MIT Media Lab
SYNOPSIS
Continual improvement project has to be handled according to a certain standard procedure. This helps to channelise the work in a systematic manner. This approach of standard procedure and systematic manner of proceeding with the work should neither be construed nor interpreted as regimentation of thinking. One is free to think and come up with various ideas. But all these things should proceed in a systematic manner so that the problem gets defined properly with specific goals, data needed to quantify/measure the problem are identified, data required to serve diverse purposes of assessing factors responsible are obtained, analysed and their mode of control is known to achieve goals and establish routine control. This systematic approach is defined as DMAIC process symbolising the five integrated steps D-Define, M-Measure, A-Analyse, I-Improve and C-Control. These steps are explained with illustrations.
Background
A continual improvement project has to be handled according to a well structured path. This ensures focused attention, frequent review of the progress both of which help to achieve the results. The structured path defined as DMAIC process is explained in this chapter with illustrative examples.
Discussion
Before taking up the topic of DMAIC process it is important to state that ‘discussion’ at several stages, among team members of the project has to take place as and when found necessary. Discussion gives a critical view of the situation on hand to churn out the next best course of action.
To ensure this it is necessary to have an incisive proactive interaction instead of the “good-for-all-seasons” syndrome characterised as under by anyone exhibiting that syndrome:
- Closely observes, listens to everyone with eyes and ears wide open.
- Maintains a profound silence which through his demeanour looks ‘scholarly’ and ‘wise’.
- Meticulously makes notes.
- Seeks suitable opportunity to paraphrase, summarise the transaction and pronounces with decent decorum that each of the divergent views have merit worth considering.
- Gets a nod of appreciation from all.
The above behaviour pattern may be good for the individual and it may promote his popularity, but does no good to the cause of enhancing the momentum for Continual Improvement.
The leader of the project should notice such a situation and politely seek what the individual has to say in the matter and reinforce repeatedly as and when the need arises that (a) conflicting views are welcome and they neither reflect nor mean conflict between personalities (b) the source of ‘light’ is ‘friction’ and hence clash of ideas generates more light to move forward. “Good-for-all-seasons” syndrome occurs more often in the meetings, a subject dealt with in Chapter 17 and therefore the Chairman of the meeting has to be alert in handling it.
Route map—DMAIC
The route map is a five phase DMAIC process where each of the five letters stands for
| D | Define |
| M | Measure |
| A | Analyse |
| I | Improve and |
| C | Control |
All the necessary inputs on the activities involved in each of the given phase have been covered in Chapters 11, 18–20, 23–25. For example, failure mode effect analysis (FMEA), discussed in Chapter 11, is most commonly used to recognise improvement opportunities, to improve the effectiveness of a proposed solution and more importantly, to determine the type of data to be collected besides the point at which the data is to be obtained. Thus, one has to link them appropriately to each of the stages D, M, A, I, C and put them to use in each of the five different phases D, M, A, I and C. To facilitate this process, specific points to be noted in each phase are outlined in this chapter.
Define stage
This phase consists of problem statement and goal statement. In formulating these, it is better to be pragmatic and not ambitious. Problem statement deals with one problem and not a combination of problems. It focuses on
- Not an opinion, but what is wrong and which can be observed and measured.
- Where the problem is appearing and what is the cause of the problem, who is responsible for it and how to arrive at a solution?
- How big is the problem?
- What is the impact of the problem?
Goal statement, generally, deals with
- the description of what is to be accomplished and it is described in terms of action words such as to reduce, increase and eliminate; and does not address how the goal/action is to be accomplished.
TABLE 27.1 Elements of a Problem
| Element | Details |
|---|---|
| What? |
|
| Where? When? |
|
| Magnitude of the problem |
|
| Impact |
|
- a measurable target for the desired result—number, expected cost savings, defect elimination, reduction in cycle time, etc.
- a time target.
In formulating problem and goal statements, appropriate data need to be used, scrutinised and analysed. The concerned people associated with it need to be consulted. These aspects have already been dealt.
The problem is identified with its corresponding SIPOC diagram. The problem is depicted in the form of a flow chart and the process is also documented as a step-by-step procedure. Through brainstorming, the problem and goal statements, SIPOC diagram, process flow chart and corresponding documents are finalised.
All the points are summarised in Table 27.1 and the content covered in the Chapters 4, 18–20 gives the necessary inputs to handle these issues properly.
Measure stage
In case defects are relevant to the problem, devise a data sheet to capture defects of different types (opportunities) in a manner that admits Six Sigma analysis. This is already explained in earlier chapters. Collect the data and establish the base line measurements of the problem that describe its current status like first-time yield (FTY), z, cycle time if involved and process cycle efficiency. The other baseline measurements can be yield, rework and rejection.
Analyse stage
Analysis can take place in two stages—scanning and investigation. The details are given as follows.
- Scan the information collected at the define stage in the form of SIPOC diagram, flow chart and documentation, all associated with the problem through the scanners explained in Chapters 5–10. Identify all the loose ends and tie them through appropriate actions. Assess the change in baseline measurements, if any; confirm the effectiveness of the actions. Record the results according to Table 18.2.
- The next stage after scanning is to diagnose and investigate the defects associated with the problem which have defied the scanning action. This involves the use of qualitative and quantitative tools already discussed. This necessitates the use of data that may not be readily available. They need to be collected and analysed by appropriate techniques, which have already been discussed.
Statistical significance of the results should be established. The outcome of the analyse stage points out to
- causes affecting defects
- sources of causes
- measures to plug causes at source and
- compulsorily, data justification for each of the given outcomes as per Table 18.2.
Illustrative example 1: feedback from outpatients
It was noted in Table 12.10 that three stated issues need to be addressed to improve the quality of service in the out-patient-department (OPD) and hence each of these issues need to be analysed individually in greater detail to identify specific appropriate actions.
- Interaction with consultants
- Delay in reports/support services
- Waiting comfort
At this juncture it is pertinent to recognise the importance of and distinction between two types of measurements—measurement on results of a process and measurement on the process itself.
The three issues mentioned above are based on the measurement results presented in Table 12.10. They are the results of the end of the process which reflect the outcome of the process.
In order to bring about improvement, the process itself must be improved and this needs measurements on different aspects of what constitutes a process. These measurements related to the different aspects within a process are called process measurements and they hold the key to improvement of the process. Normally such data are not available and they have to be obtained.
For each of the above three issues—interaction with consultants; delayed receipt of reports and waiting comfort—measurements on different aspects of the process were obtained by special effort.
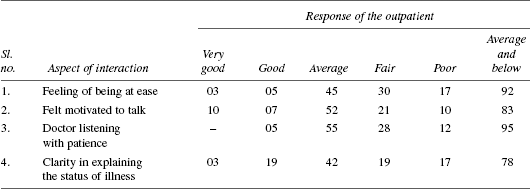
Such data obtained on interaction with consultant is summarised in Table 27.2. The summary of data when presented to consultants made them realise the importance of their role in establishing a human touch with their customers. They got involved in the process of improving the quality of their relationship with their customers. For example, every consultant made it a point to welcome the patients with a smile, make them sit comfortably and exchange a few pleasantries prior to starting the discussion. Re-evaluation after a lapse of 6 weeks showed remarkable improvement.
TABLE 27.2 Interaction with Consultant: Summary of Data Obtained from 100 Patients
In case of delay in reports, the focus was on tracking the report flow from the time of prescribing the test to the receipt of report by the patient. The time-trap points as well as the duration during the report flow process was also noted. This helped in taking suitable action to reduce the delay.
In case of waiting comfort, the focus was to know what comfort meant to outpatients and their specific experience. This was accomplished by obtaining special data as in Table 27.3. These responses helped to know the areas of concern for suitable action.
Illustrative example 2: process speed investigation
In Table 27.4 data on process analysis in terms of time spent on different aspects of a process that was under investigation are given. WIP at each state is also given.
The duration, distance and units of work are all average figures.
Now the issue is to shrink the cycle time through tackling the time traps, notably the waiting time, time taken to move from one stage to another. To facilitate this, scan the entire process according to each of the scanning factors listed in Table 13.1. This would throw up a lot of ideas and suggestions on shrinking the cycle time. In this phase, the different tools of thinking and logical analysis are utilised, backed by data and their analysis using techniques of stratification, charting and frequency tally. This helps to arrive at a number of suggestions strengthened by data and logic.
TABLE 27.3 Waiting Comfort: Summary of Data Obtained from 50 Patients

TABLE 27.4 Process Speed Analysis Flow Chart

All the ideas and suggestions are listed out. Classify them into two groups as short-term and long-term. Short-term ones have several features like the task can be completed in a matter of three/four weeks; does not need any additional resources/facilities. The short-term ones are taken up, on priority, for implementation. Then the long-term ones are reviewed and similar action is taken.
Improve stage
This is concerned with implementing the measures arrived at in the analyse stage. Implementation leads to improvement. Brainstorming helps a great deal in arriving at the measures, selecting and implementing them. Guidelines on implementing a decision are given in Annexure 27A.
After implementing, the effectiveness of the measures adopted needs to be evaluated. This evaluation is based on a similar type of data used in the measure stage. The effectiveness is based on the change in the desired direction of reduction, increase and elimination. In Six Sigma terms, increase in the values of FTY, z and where applicable PCE% indicate the effectiveness of the measures undertaken.
Control stage
This phase lies in institutionalising the measures found effective. Institutionalising comprises amending all documents related to specification, work instruction (WI), standard operating procedure (SOP), material data sheet, maintenance practices where appropriate changes need to be made consequent to the improvement measures undertaken.
With the given five-step process, the study on improvement project gets completed.
A detailed write-up on the project needs to be prepared and kept as a permanent document of the company. The chief coordinator is the custodian of the document. These documents can be accessed for reference and used by authorised persons.
The lessons learnt through the study need to be adopted across similar processes in the same location or other locations in an appropriate manner. This is known as horizontal deployment. The chief coordinator must have in place suitable processes to ensure horizontal deployment.
The main purpose of the case described here is threefold. They are
- To illustrate DMAIC approach.
- To demystify the approach.
- To reflect that Six Sigma is not the realm of only green and black belts but also belongs to the humble many without any belts.
Illustrative example 3: analysis of difficulties in the purchase department
This case example relates to a purchase department in a hospital. The head of the department experienced a number of difficulties of diverse types in the functioning of the department. Hence, it was decided to undertake a Six Sigma exercise.
Definition stage
Problems/difficulties do not present themselves in a neat and packed form. They are similar to body pain. Pain is felt, but how, where, why, and when of the pain is not clear. This is the reason for attempting to and insisting upon the definition of the problem.
A brainstorming session was held to know, identify, categorise and specify the problem. In this task alone, four to five brainstorming sessions were held and ultimately the list presented in Table 27.5 was evolved.
Measure stage
The next task was data collection. The issues concerned were the type of data that measures the defect listed in Table 27.5, source and availability—available readily from the existing records or to be specially collected. This also called for a brainstorming session over 2–3 days. Ultimately, it was possible to specify the source of the data and mode of collection of the data. The details are furnished in Table 27.5.
Analyse stage
The approach to get an objective picture of the magnitude of difficulty was debated in a few brainstorming sessions. It turned out to be a valuable one as could be seen from Table 27.5 summarised as
- A large number need special data for investigation.
- A few can be investigated with available data.
- A few need on the spot observation, interaction with people concerned.
- A few need detailed scrutiny of the existing regulations/practices, their debugging and strict enforcement.
TABLE 27.5 List of Difficulties, Implication, Database (Practical)

*Special data means data collected for a specific purpose/study and their use may be over, once the study is completed.
Special data
As regards the special data to be collected, clarity of thought emerged after detailed deliberation of each type of special data. For example, the special data on receipt of indents comprised the data sheet given in Table 27.6.
Inference from data
In a number of cases, it was a surprising fact to realise that a mere summary of the data revealed untold state of affairs and led to surprisingly simple solutions. This point is illustrated in Table 27.7, the summary of the data collected according to the data sheet in Table 27.6.
When these data were reviewed by hospital and pharmacy personnel, they agreed to reduce the number of indents sent beyond 2 o’clock. The basis for such an action was the realisation that the delay data on C╛B and D╛C were high and that it could be reduced.
Wider participation
The data, data summary, interpretation, action and suggestion must ensure wider participation of key persons outside the study team who influence and/or get influenced by the study. To those who feel statistically comforted by looking at a low-fault figure in data, it needs to be explained how high that low is in terms of its ppm compared to the ideal value of 3.4 ppm. This is one point that should be realised by every practitioner of Six Sigma and its message must be put across to everyone.
TABLE 27.6 Special Data: Inflow of Indents to Pharmacy
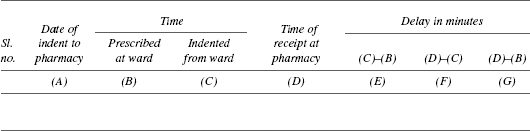
TABLE 27.7 Summary of Data on Inflow of Indents

The net impact was profound, unique, spontaneous; the common refrain was why we were not made wise yesterday and why we suffered for so long. To achieve this end result, the head of the purchase department and the personnel of the department had informally interacted with all those concerned. All were requested to list out the type of action they would like to take and to put things in place.
Improve stage
All the ideas related to actions to be taken were listed unedited and distributed to the entire group involved in the task. Few days were given to study the action ideas. Then, a brainstorming session was held to prepare a must list of actions. On preparing the must list, the pragmatic implementation was to classify them in terms of the time taken to implement— short-term (1 week), mid-term (2 weeks), long-term (4 weeks). The time frame in terms of week is decided according to an organisation’s capability to comply with it. The details are given in Table 27.8. Responsibility and target for implementation are also specified.
TABLE 27.8 Priority for Action Plan
| Sl. no. | Actions to be taken |
|---|---|
| Short-term | |
| 1. | 90% of the indents flow into pharmacy before 2.01 PM. |
| 2. | Emergency indents to be reduced by 50% by redefining emergency as the one related only to the case where the condition of a patient has a potential to take a serious turn. |
| 3. | Indents to be sent only through the revised indent form; writing the medicines and their strength in capital letters. |
| 4. | To record in the prescription the preferred one as well as its recommended substitute, if any, when the prescribed one cannot be procured within 6 hr. |
| Mid-term | |
| 1. | Re-negotiate with suppliers to ensure 90% of their supplies are made within 6 hr from the time of intimation to supply. |
| 2. | Re-negotiate with suppliers to keep certain drugs in stock at their end and to be supplied in a matter of minutes. |
| 3. | Post prominent self-speaking labels to identify items in stores. |
| 4. | Re-arrange stores in prescribed order applicable to each category of material. |
| Long-term | |
| 1. | Increasing the capacity of humidity control room and cold storage facility. |
| 2. | Re-shaping the size and capacity of bins and racks. |
Control stage
Actions were taken. All concerned with the implementation were informed in advance about their role and actions. Many of the persons were not in the decision-making circuit. But all implementers were given the freedom to report any mishap at the earliest and also to suggest remedies. Hiccups did occur but were noted at the earliest possible time and remedied. To participate in this process, there was a monitoring system and designated coordinator. Six weeks after implementation, 3 weeks of data of the stabilised phase were collected. The degree of improvement achieved was there for all to see.
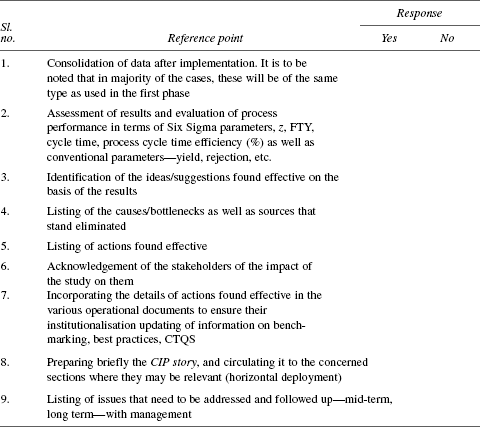
Consolidation stage
All the actions found effective were identified and incorporated in their respective operational documents to be absorbed in the routine system.
Use of techniques
The list of approaches to tools and techniques used are as follows:
- Brainstorming—to ensure participation and ‘pick the brain’
- KJ method—to group ideas
- Data type and source to identify and assess the magnitude of the problem
- Cause–effect logic for defect source identity
- Priority for action—Pareto law
- Scrutiny of prevailing WI, procedures related to the problem
- Spot check and interaction with people
- All the soft skills
- The discipline of anchor thoughts
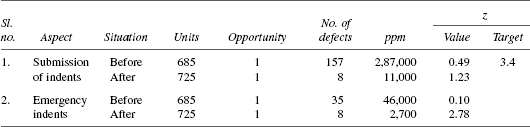
- Six Sigma calculation, as illustrated in Table 27.9, to know capability of the processes of ‘submission of indents’ and ‘emergency indents’.
Assessment of each phase of DMAIC
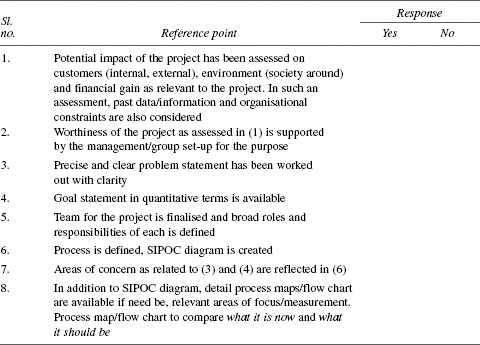
Annexure 27B gives a checklist of points applicable to each of the five phases, define, measure, analyse, improve and control. In case the response to each point of the checklist is in the affirmative, each phase is satisfactory. In practical terms, the checklist appropriate to phase D is applied. In case the answer to each point of the list is yes, the next phase M is undertaken and the cycle is repeated for each of M, A, I and C. The next step after C is to celebrate the event.
TABLE 27.9 Six Sigma Evaluation of Results
Continual improvement Six Sigma, jargons
A continual improvement project bears on it the total import of Lean Six Sigma—defect prevention, time-traps elimination, WIP reduction, removal of non-value operations—and not just the defects. This is the synthesis of knowledge and its practice.
All Six Sigma projects are continual improvement projects but not vice versa. The demarcating line is specifying before and after results in terms of z value and PCE%. This focus is not often found inspite of the effort to increase the number of persons with green and black belts.
A summary of all the points covered is given in the flow chart (Figure 27.1). The inputs of different chapters are also indicated in the flow chart.
With the advent of Six Sigma, there is a generous use of jargons. Most of these are impressive but confusing. Hence, the point to be noted is jargons must be expressive and simple. For example, why use the expression ‘project dashboard’ (impressive but confusing) when the expression ‘project: summary of results’ (expressive and simple) serves the purpose eminently well.
Conclusion
While concluding this chapter, authors would like to emphasise that a regular intensive workshop must be organised on DMAIC for all employees in the same way people have been trained in 7 tools of quality control. DMAIC helps one to think in depth in a more focused and disciplined manner. This programme must be practice-oriented with a number of examples, cases for study and discussion.
Annexure 27A
Guidelines on implementation of decision
Examine who are the functionaries whose approval/clearance are needed to implement the decision. These functionaries need not be in the team that has arrived at the decision. Clearance from all the concerned functionaries is obtained.
The steps to enhance the quality of implementation are as follows.
- State in clear and unambiguous terms the decision to be implemented.
- List all the aspects involved in implementation.
- Check and re-check that each aspect is a practical one and not a dream, desire or a good intention.
- Specify for each aspect the ‘who, where, when and how’ of its implementation; document it and circulate.
- Ensure that the one entrusted with the task has understood his role in implementation as well as the mode of implementing. Get assurance to that effect. Note that the responsibility to implement is spread over different persons who are not members of the team but have to understand to implement the decision taken and extend full cooperation.
- Give freedom to every implementer to convey at the earliest any bad news about bottlenecks in implementation without any mental block.
- Review the process of implementation at short intervals of time (including daily) to anticipate the likely difficulties, bottlenecks to be encountered and debug the same to reach steady state at the earliest.

The given steps on implementation can be reflected through the chart in Table 27A.1.
TABLE 27A.1 Role Chart for Implementation
| Sl. no. | Particulars | Details |
|---|---|---|
| 1. | Responsibility. Persons directly responsible for implementation | |
| 2. | Accountability. Person taking overall responsibility for coordination of efforts to implement. | |
| 3. | Consultation. Resource persons who can be consulted in case of any bottlenecks | |
| 4. | Inform. People who are influenced by implementation but not involved in the decision taken and have to be informed about the implementation to enlist their cooperation. |
*Before proceeding with Step 3 above resort to “Zero-based-check”. This means assessing implementation by an end-person who may either be the implementor or the one who is affected by the implementation. This will give a chance to bring out any deficiency, difficulty, drawback. It can be also be a startling revelation.
The following examples highlight the point:
- Cashew fruit: The journey of the cashew fruit from its stage as a flower to a fruit is a journey in the grandeur of fine aroma and bright colors of green, yellow, red and crimson. Such a creation was due to the desire of Bramha to impress his consort about his prowess in creativity. When he showed his creation of the cashew fruit to his consort before releasing it to the world [Zero-based-check], she to Bramha’s dismay and disbelief posed the question, where is the provision for its procreation! Bramha immediately fixed the nut to the fruit and released it.
- Child’s shout: When a king was stripped of all his dresses and made to believe that he has been immaculately dressed in an invisible manner, he went in a procession to impres his subjects about his invisible dress. Wise and loyal stood in strict silence without a murmur. But the little child [Zero-based-check] shouted, “King has nothing on”.
- Where is profit? When an ingeniously designed product was set for review, everyones eyebrow went up in awe and admiration. To an investor’s [Zero-based-check] query who can buy, the answer was crest fallen silence.
Annexure 27B
Checklist of each phase D, M, A, I and C
1) Define phase
2) Measure phase