
16.4. Avoiding Common Configuration Problems
Now, that you've ensured that the requisite packages are installed on your production machine, you should guard against some common pitfalls before proceeding directly to application deployment. This is a key part of the predeployment checklist. Many of the problems in deployment turn out to be errors in the configuration files. Much of the behavior of ASP.NET can be adjusted in the machine.config and web.config files. One change to the root machine-level configuration can have a negative impact on all of the applications running on the server. If you change a setting in these files to gather information during development and forget to return it to the default before rolling out to production, you may face performance or security problems.
16.4.1. Disable Debugging
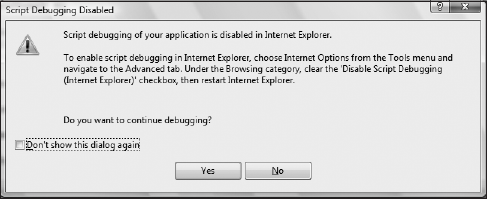
When developing a Web application, you often want to be able to step through code as it is running in order to find problems. When launching a Web application for debugging, Visual Studio will remind you, as shown in Figure 16-2 that Internet Explorer needs to have script debugging enabled. Leaving it enabled may affect your experience with other applications when script errors are encountered, but it won't have any adverse impact on your application itself.
Figure 16-2. Figure 16-2
Visual Studio will even offer to automatically modify the web.config file to enable debugging. This is shown in Figure 16-3. This is the source of a common production problem. The dialog warns that debugging should be disabled in production, but it's easy to forget. Visual Studio can't yet tell when you've decided things are ready to go and to remind you to switch this setting back.
Figure 16-3. Figure 16-3

The comment that Visual Studio puts in the web.config file is also a reminder to disable it for deployment:
<system.web>
   <! --
    Set compilation debug="true" to insert debugging
symbols into the compiled page. Because this
affects performance, set this value to true only
during development.
-- >
<compilation debug="true"/>In production, the primary manifestation of this problem is very slow request throughput. Instead of having multiple threads trying to serve many requests simultaneously, ASP.NET will use a single synchronized thread to run pages. Essentially, all requests must get in line to wait their turn while only one request is processed at a time. This, of course, greatly reduces efficiency, and requests will start to queue up waiting for their turn or when the queue is long enough, they may even be rejected outright. This can go undetected if you aren't monitoring the site carefully (see "Performance Monitoring," later in this chapter).
16.4.2. Enable Custom Errors
When an error occurs during the processing of a page, the stack trace information can be very useful in figuring out what is going wrong. But you don't want this sort of information to be shown to the end user. What to show in error conditions is controlled by the customErrors configuration section.
The default setting for custom errors is remoteOnly. This means that when browsing to localhost on a machine, you get detailed error reporting, but when viewing the application from another machine, custom error messages are shown instead. The custom error page is normally a user-friendly error page that hides the technical details of what went wrong. This default setting is designed to allow you to get good information during development on the local machine but to avoid showing potentially sensitive data to the end user. In many development environments, multiple developers are working together on a single application, so they want additional error information when browsing remotely. You can turn off custom errors by setting the mode to off so that you get the same information whether you are browsing locally or not.
<system.web>
   The <customErrors> section enables configuration
   of what to do if/when an unhandled error occurs
   during the execution of a request. Specifically,
   it enables developers to configure html error pages
   to be displayed in place of a error stack trace.

 <customErrors mode="RemoteOnly" defaultRedirect="GenericErrorPage.htm">
   <error statusCode="403" redirect="NoAccess.htm" />
   <error statusCode="404" redirect="FileNotFound.htm" />
 </customErrors>
After the error is found and fixed, it is easy to forget to change the custom errors mode back to RemoteOnly or On instead of Off. And you probably won't notice it until some problem arises in the production environment and you discover that error pages are showing customers stack traces instead of something more friendly. Stack traces can give hints about the source code organization beyond what you'd like to show the general public. There are people out there looking for vulnerabilities to exploit and giving them any extra hints is not your goal, so hide error stacks from end users.
Another new feature has been added to custom errors based on user feedback. By default, when an error is encountered, the browser is redirected to the custom error and the URL is changed to correspond to the error handler. By changing the RedirectMode of the customErrors section to ResponseRewrite, you change the behavior from redirecting to keeping the same request URL while executing the targeted error page for output.
16.4.3. Disable Tracing
Information leakage is a big concern in running a Web application. The Tracing feature, while extremely helpful, can lead to sharing more information about your server than you intend. Tracing allows you to automatically gather information about the requests being processed. You can then access the trace.axd handler to view the information locally or remotely. This handler is requested from a browser just as though it were a physical page. Remember that the trace information is available from the local server only if localOnly is true.
<system.web>
 <trace enabled="true" localOnly="true"/>
The top-level tracing output, shown in Figure 16-4, is a listing of the most recent requests. Selecting one of the View Details links from the list takes you to output like that shown in Figure 16-5. These are the details for a single request. It includes information about the most recent request, including the ASP.NET session identifier; the time to complete each phase of the page lifecycle; the control hierarchy of the page; and markup size rendered. The page also includes a listing of various server variables, which is probably more information than you want to share with users!
Figure 16-4. Figure 16-4

The tracing feature is not enabled by default. But if you enable it, remember to disable it again for production Web sites. Not only is there the possibility that you are sharing information that you don't want to, but there is some overhead associated with tracing. If you aren't using it, there's no need to tax the performance of your site needlessly and expose the information to prying eyes.
Figure 16-5. Figure 16-5

16.4.4. Set Deployment Mode
There are a number of configuration settings that have the potential to impact production environments negatively. And because it is easy to forget to change a setting when moving from the development environment, there is a global configuration setting that overrides the other settings. The deployment section has the retail attribute for this purpose. When set to true, the configuration, tracing, and debug section settings are overridden to more production-friendly values:
<system.web>
  <deployment retail="true"/>
The deployment setting can only be used at the machine level in the machine.config file and affects all Web applications on the server. You can't enable it for just a single application. This setting should always be used on production Web servers, so if anyone forgets to modify their web.config on one particular application, this setting will trump the specific application setting. It's nice to have a big switch to help you avoid some common mistakes! Be aware, however, that it can also cause confusion when you start toggling one of the other configuration settings and see no effect. Of course, you don't usually want to be doing debugging on a production server anyway. In rare cases where you might need to trace a problem in production that can't be easily duplicated in a development or test environment, the extra config change would be necessary to get things set up.