
4.5. Errors and Debugging
Chapter 15 provides detailed information about testing and debugging ASP.NET AJAX applications, but this chapter on the AJAX Library would not be complete without a basic introduction to the debugging facilities. Debugging JavaScript can be quite challenging because of its dynamic interpreted nature. One of the reasons it is so difficult to debug is due to the fact that without being able to precompile JavaScript code, you often end up finding mistakes through runtime failures and errors. Further, runtime errors are not always helpful at assisting you identify the problem, although the extra debug mode messages are helpful.
It is important to note that Visual Studio 2008 now provides the ability to debug your JavaScript code directly in Visual Studio 2008. This allows you to step through your JavaScript code in the same manner as you step through your C# or Visual Basic code. Again, Chapter 15 covers this feature in more detail.
This next section shows you how to create your own debug trace window.
Figure 4-8. Figure 4-8

Figure 4-9. Figure 4-9
4.5.1. The Debug Trace Console
The Debug class makes tracking down issues easier. One of the facilities it supports is providing trace information from your code. You should always provide release and debug versions of your scripts, and your debug versions can include extra trace information. The output can go to Visual Studio, the Firefox console, or directly into a text area on your page. (Again, detailed information and examples will be covered in Chapter 15.) Listing 4-23 shows that if you include a TextArea element in your page with an ID value of TraceConsole, the Debug class puts trace information there.
Example 4-23. Creating a trace window
<%@ Page Language="C#" Debug="true" %>

<html xmlns="http://www.w3.org/1999/xhtml">
<head runat="server">
    <title>Trace information</title>

    <script type="text/javascript">

        function pageLoad(sender, args) {

           Sys.Debug.trace("Trace information is sent to the TraceConsole");
           Sys.Debug.trace("This message was sent on " + Date());

        }

    </script>

</head>
<body>
    <form id="form1" runat="server">
    <div>
        <asp:ScriptManager ID="ScriptManager1" runat="server">
        </asp:ScriptManager>

        <textarea id="TraceConsole" cols="512" rows="10"
         style="width:100%;border:solid black 1px"></textarea>

    </div>
    </form>
</body>
</html> |
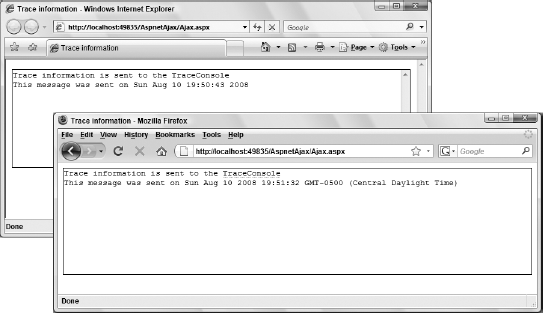
The results are shown in Figure 4-10. Notice that Internet Explorer and Firefox do not format the date string exactly the same, but in both the debug output utilizes the TraceConsole.
Figure 4-10. Figure 4-10
4.5.2. Creating Errors
The ASP.NET AJAX Library provides an Error object for dealing with errors in a standard way across applications. The static create method of the Error object allows you to create a custom error by passing in a message and a JSON-formatted error info object. It also includes static methods for creating a set of standard errors that correspond to frequently used exceptions in the .NET Framework.
var e = Error.create("custom error", { name: "My Error"});
    throw(e);
You may find that you do not need custom errors, but you can still take advantage of the built-in error types. The common exceptions to throw are listed here with their major arguments.
Error.argumentNull (paramName, message)
Error.argumentType (paramName, actualType, expectedType, message)
Error.argumentUndefined (paramName, message)
These error functions extend the native JavaScript object and work with it to provide additional debugging information. In Listing 4-24, an argumentNull error is created and thrown. First, it is caught, and the Debug.traceDump() method is called on it to examine the details of the error. Then it is thrown again without being caught. The error information is then bubbled up to the user, as you would normally expect. The trace output and browser dialog are shown in Figure 4-11.
Figure 4-11. Figure 4-11

Example 4-24. Throwing exceptions
<%@ Page Language="C#" Debug="true" %>

<html xmlns="http://www.w3.org/1999/xhtml">
<head runat="server">
    <title>Trace information</title>

    <script type="text/javascript">

        function pageLoad(sender, args) {

            Sys.Debug.trace("Trace information is sent to the TraceConsole");

            try {
                throwError(null);
            }

            catch(e) {
                Sys.Debug.traceDump(e, "the error");
            }

            throwError(null);

        }

        function throwError(arg) {
            if(arg === null) {
                var e = Error.argumentNull("arg", "arg is required");
                e.popStackFrame();
                throw(e);
            }
        }

    </script>

</head>
<body>
    <form id="form1" runat="server">
    <div>
        <asp:ScriptManager ID="ScriptManager1" runat="server">
        </asp:ScriptManager>

        <textarea id="TraceConsole" cols="512" rows="10"
         style="width:100%;border:solid black 1px"></textarea>

    </div>
    </form>
</body>
</html> |
Figure 4-12 shows the TraceConsole and a pop-up dialog offering the user the opportunity to debug.
Figure 4-12. Figure 4-12

4.5.3. Validate Params
JavaScript does not have the access modifiers used in compiled languages. You cannot declare that something is private or protected. The only way that code is made inaccessible is for it to go out of scope during execution. This can lead to some clumsy coding. You may want something to be a private implementation detail, but JavaScript does not provide a clean way to do this. The ASP.NET AJAX Library does not provide a way to simulate access modifiers for JavaScript either. It does; however, borrow a pattern from the .NET Coding Guidelines: Members that the developer considers private are prefixed with an underscore.
Typically, since they are supposed to be private, you would probably not explore those methods, but the _validateParams() method deserves mention. This method is included on the Function object and is called dozens of times from the AJAX Library in the debug scripts. The calls reflect the information from the XML doc comments. The debug version of the AJAX Library methods checks for required parameters, checks the type of parameters, and validates where null arguments are not allowed.
Even if you are not seeing functional problems as you develop an application, the best practice is to enable the debug mode temporarily before deployment and do some testing. Do not leave debugging enabled during deployment, though. The parameter validation and debug information take a heavy toll on performance.
When an error is encountered during a call to _validateParams(), an exception is thrown and you can then break into the debugger and find the source of the error. This can be very helpful in getting to the root of a problem or in finding subtle errors before deployment.