
One of the many reasons to create an enterprise portal is to collect in one place all of the information necessary to make key decisions. Imagine if a product manager can see a sales report, a marketing analysis, the communication strategy, and the status of development on a new product line all on one page. The product manager can quickly look at all the relevant information and statistics to determine whether the product is on time, on budget, and still fits the target market. This concept is known as business intelligence, or having the right data at the right time in front of the right people to make the right decisions.
Microsoft Office SharePoint Server 2007 is a significant component in Microsoft’s overall Business Intelligence solution. MOSS 2007 has a variety of tools to take large amounts of unstructured data and organize that information in a single, easy-to-use interface. This makes it relatively simple to have important documents, reports, and newsfeeds at your fingertips, assisting you in making corporate decisions.
The Business Intelligence (BI) features in SharePoint 2007 allow you to locate, manage, modify, and share data from many diverse sources, as well as store and present that data later in different presentations.
The new BI utilities in MOSS 2007 give everyone the tools to create meaningful analyses. No longer do developers or warehousing and data mining experts have to struggle with accessing vast amounts of unstructured data to provide useful reports.
SharePoint can connect to many data sources, including SAP, Siebel, and Microsoft SQL Server 2005. The resultant reports generated from acquired data can take the form of Excel workbooks, a SQL Server Reporting Services report, or a Microsoft Office Access report.
The key elements of MOSS 2007 Business Intelligence are:
These key elements can all be created as part of a Report Library on the Create page of your site, as shown in Figure 15-1.

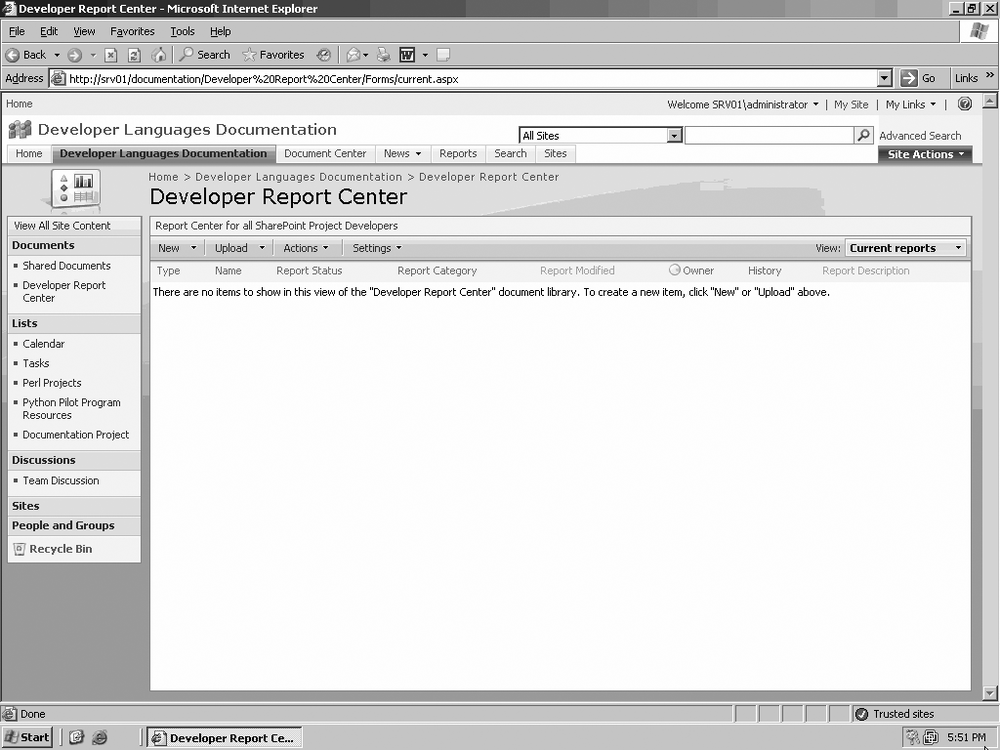
The Report Center is used to contain and organize Business Intelligence elements such as Dashboards, Key Performance Indicators (KPIs), document libraries, and connections to external data sources. The Report Center is one of many site templates in the Enterprise site template group. Other Enterprise site templates include the Document Center, Records Center, Site Directory, and more.
Tip
See Chapter 7 for more information on site templates.
The Report Center is completely customizable, providing access to page templates and Web Part pages, and allowing you to create and manage libraries, pages, and lists containing whatever business information you find necessary.
By default, one Report Center site is created when the Top-Level Portal site is created. However, a Report Center can be created for any group, department, or organization as needed. With appropriate permissions, information from the Report Center site can be accessed from any other site or site collection, allowing you to share your data with colleagues, customers, and associates.
The Report Center site template provides a single point of contact for anyone who wants the latest in your company’s Business Intelligence reports. As you see in Figure 15-2, when a Report Center is first created, it is void of any content, allowing you to either add the default Web Parts yourself or to customize it with other selections.
The MOSS 2007 Dashboard is a specialized web page template designed to collect and display information from many different sources. This can include charts, metrics, reports, and KPIs. The default Dashboard template contains the following Web Parts:
- Excel Web Access Web Part
Adds an Excel workbook, worksheet, or worksheet range to the Dashboard.
- The Apply Filter Web Part
Adds an Apply Filter button to the Dashboard.
- The Related Information Web Part
Can be used to add a series of hyperlinks that connect to related web sites.
- The Summary Web Part
Lets you add a text summary or description of the Dashboard.
- The Contact Details Web Part
Lists the contact person responsible for the Dashboard.
- (Optional) The KPI List Web Part
Adds visual KPIs to the Dashboard, showing how much progress a team member has made toward a goal.
You can also start with a generic Web Part page and add whatever Web Parts you want, creating a dashboard that will perform to your specifications. You can create a Dashboard from scratch, but it might be easier to start with the basic Dashboard template and modify it as needed.
Tip
See Chapter 9 to learn more.
In Figure 15-3, you can see that information from several sources can be imported into a KPI, including manual input.
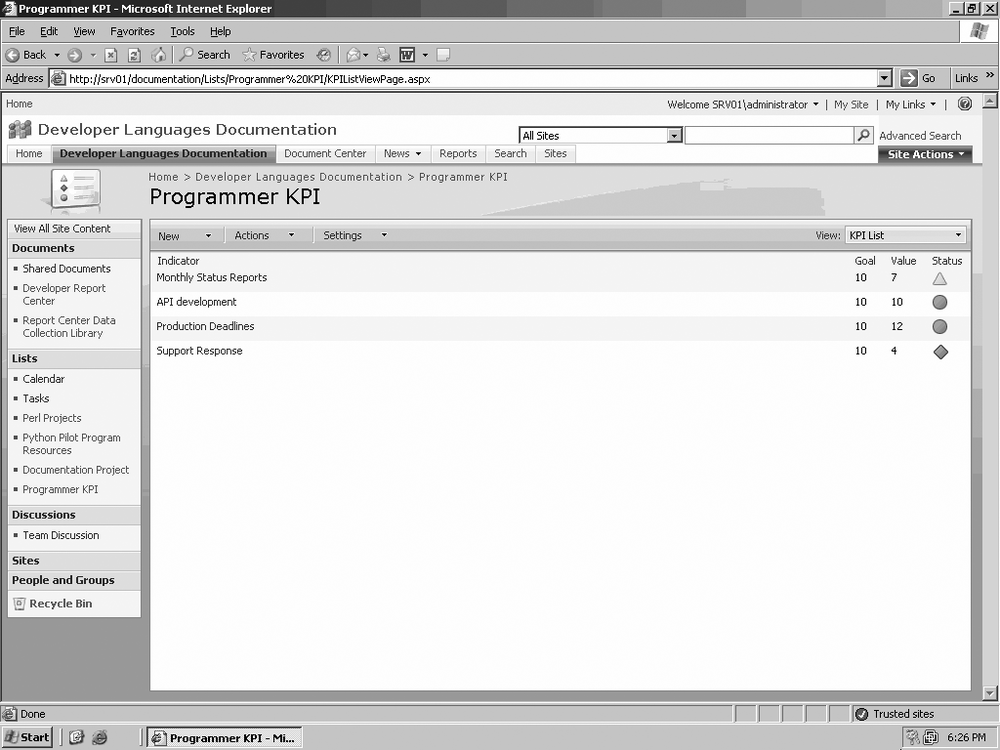
Once a key indicator has been created, the indicator’s name and status are displayed, along with values signifying the goal and current value, as shown in Figure 15-4.
Rather than have partners and customers download copies of spreadsheet data from your server, the Excel Services Web Access (EWA) Web Part allows a single copy of an Excel Workbook to exist on a secure server. The EWA service publishes spreadsheet data in your BI Report Center, enabling any authorized person to access this information using only a web browser.

Using EWA enhances the security of your critical business data in the following ways:
A single copy of the workbook is stored on a single secure server.
Information can be published to the Report Center site as Read-Only.
You can publish a snapshot of the workbook rather than the interactive version, preventing anyone from modifying data.
All calculations are performed on the server, cloaking the business logic from people viewing the data via the Report Center.
EWA technology uses Dynamic HyperText Markup Language (DHTML) and JavaScript to provide web access to .xslx- and .xslb-formatted data without requiring that ActiveX controls be loaded in the observer’s browser. The EWA Web Part can connect to other Web Parts, such as Dashboards, or to other Web Part pages.
Data in an Excel workbook either can be stored directly in the workbook that resides on your secure server or can come from an external data source, such as a database or an Online Analytical Processing (OLAP) cube.

Tip
Learn more about managing Excel within SharePoint in Chapter 18. Learn more about OLAP in the “Data Warehousing” section later in this chapter.
You can add an Excel Web Access Web Part to any Web Part page by selecting it in the Add Web Part page, as in Figure 15-5.
An Excel Services Web Part is very similar to an actual Excel Workbook. Here’s the breakdown of the different areas of the Web Part:
The top of the Web Part holds the title and toolbar, which contains the commands, a drop-down list, and menus.
The Web Part’s primary pane displays one or more Excel workbooks in the worksheet view, one or more named items in the named items view, and an optional outline.
The Parameters Task pane contains data entry text fields, parameter labels, and tool tips.
The field at the very bottom holds the refresh data messages.

Before the Web Part can contain meaningful information, you must first select an Excel workbook, as in Figure 15-6.
Generally an external data source can be either external to the Report Center site but within SharePoint or completely external to SharePoint. External SharePoint sources can include Web Parts, Web Part pages, and Lists. Sources external to SharePoint can be SAP, Siebel, Microsoft Office Access 2007, and Microsoft SQL Server 2005. While it’s outside the scope of this book, you can also write your own data sources.

You can create connections to your external data sources and then store them in the Report Center’s Data Connection Library (DCL). The DCL provides a single interface, allowing you to easily manage all of your external data connections. You can also create such connection libraries in any other part of your MOSS 2007 site as you see fit. Connections can be reused or shared as needed, and they allow anyone with access to view and interact with information from disparate data locations, all presented in SharePoint. As Figure 15-7 shows, creating a DCL is pretty much the same as creating any other list or library. One difference you may notice is that you have the option of versioning in this library. As your needs progress over time, you will likely find yourself either updating a data source you manage or finding that the owner of an external data source has modified that source. You can keep track of which version of the data source you have used at different points in time to identify the various data elements available in each version.
Imagine that in the original version of an external data source, you found regular access to a particular data element useful. As your needs changed, the data source was updated to not include that element. Then, suppose that a condition arises where you need to access that element. You can find it again by accessing the version of the data source that contains it.

The MOSS 2007 Business Data Catalog (BDC) part makes it easy to search your backend data sources. Use its search function to discover and integrate external data into SharePoint Web Parts. The search aspect of BDC transverses such sources as remote file shares, web sites, Microsoft Exchange Servers, Lotus Notes, and others, allowing you to locate the desired information and view or modify it from inside SharePoint.
Filtering information in libraries and lists lets colleagues and customers view and interact with only the most relevant data in a Web Part. For example, your department may provide support for Software Applications, Languages, and Libraries/APIs, but you may want to see only a list of supported applications. Filtering lets you select the Applications option on the supported software list, so that only applications such as COM+ and SQL Server appear. You can also store all of your sales data on a single list and filter it by region, year, or product.
MOSS 2007 provides 10 distinct Filter Web Parts. For example, the Current User Filter Web Part filters information based on the user’s logon profile. This is a great asset to security and accessibility, presenting only data you want the user to see and hiding any data the user will not find useful.
Tip
See Chapter 13 to learn more about filtering lists.
KPIs are visual indicators that show how much progress has been made in achieving one or more goals. Using KPIs to measure task metrics allows teams, managers, and organizations to quickly assess whether tasks are hitting their milestones and which parts of a task are ahead, behind, or on time.
For instance, if you are developing a new application for a customer, there may be different engineers working on the interface, libraries, and other project elements. KPIs can be used to measure the performance of each engineer on the project relative to the project goals (e.g., how many modules have been built, how many test cases have passed, etc.). This way, all of the stakeholders—including the engineers on the project—know to what degree the performance indicators align with the performance targets that were agreed upon before the project started.
You can use one of four KPI types:
Use SharePoint Lists as a data source when they contain quantifiable information that contributes to the workflow. This can include metrics such as opening and closing dates of trouble tickets or percentages of sales within a month.
Link an Excel Workbook to a KPI in MOSS 2007. As data in the workbook changes, it will be displayed in the KPI, indicating the level of progress. You can choose to display the workbook on the same SharePoint page using Excel Web Renderer (EWR).
Tip
See Chapter 18 for more information.
Set up a KPI to use Microsoft SQL Server 2005 Analysis Services to access database information. Usually a system administrator or database analyst will have to create the initial connection, but once it’s in place, authorized users will be able to use the Analysis Services KPI.
Manually configured KPIs are used when there is no formal, structured system of data collection, such as using emails or instant messaging.
Figure 15-8 shows several indicators on a KPI list, including goals and status.
Performance Management is the process of creating and maintaining a high fidelity between employee performance and departmental or company goals. MOSS 2007 is only part of the Microsoft BI solution, and many other tools play vital roles in concert with SharePoint. Other applications and third-party tools that play a role in BI performance management include Business Scorecard Manager, ProClarity, and Microsoft Office PerformancePoint Server.
- Business Scorecard Manager 2005
This application is included in the Microsoft Office PerformancePoint Server 2007 and utilizes the Microsoft Office Suite and SQL Server to provide specific performance indicators. Employees have access to a personalized scorecard of their work performance tracked by KPIs as compared to business goals. See Figure 15-9 for an example.
- ProClarity
ProClarity is a third-party applications vendor and Microsoft partner. They provide Query and Analysis, Dashboard, Scorecard, and Reporting software solutions that interoperate with Microsoft SQL Server and Office products in order to enhance Microsoft’s Business Intelligence application features.
- Microsoft Office PerformancePoint Server 2007
This server-side application contains tools to let organizations plan, implement, and monitor their business processes and goals, specifically targeted at aligning manager and worker productivity and accountability to those goals.
As you can see, SharePoint 2007 includes some of the features required to implement successful performance management, including Dashboards and KPIs that gather data from SharePoint lists.
The Performance Management part of BI uses various integrated platforms to satisfy managing productivity, accountability, and goals. The following Microsoft and ProClarity technologies fully integrate to provide analysis and reporting on performance management data:
Business Scorecard Manager
ProClarity
Microsoft Office SharePoint Server 2007
Microsoft SQL Server 2005 Analysis Services
SharePoint does its part by providing multiple data views—in the form of Web Parts, Dashboards, and other display components—to offer secure, web-based displays of analyzed information that pull information from databases, spreadsheets, and many other sources.
Microsoft’s Data Analysis and Reporting abilities combine Excel, SharePoint Excel Services, numerous other SharePoint elements, and ProClarity Analytics to provide cutting-edge collaborative performance analysis and reporting for the enterprise.
Excel 2007 is fully supported for Microsoft SQL Server 2005 Analysis Services and can easily connect to the SQL central metadata repository, extract the relevant data, and present it in spreadsheet format. Excel and SharePoint Excel Services can draw data from multiple sources, including one or more databases, and organize and display raw data in a meaningful form using a single interface.
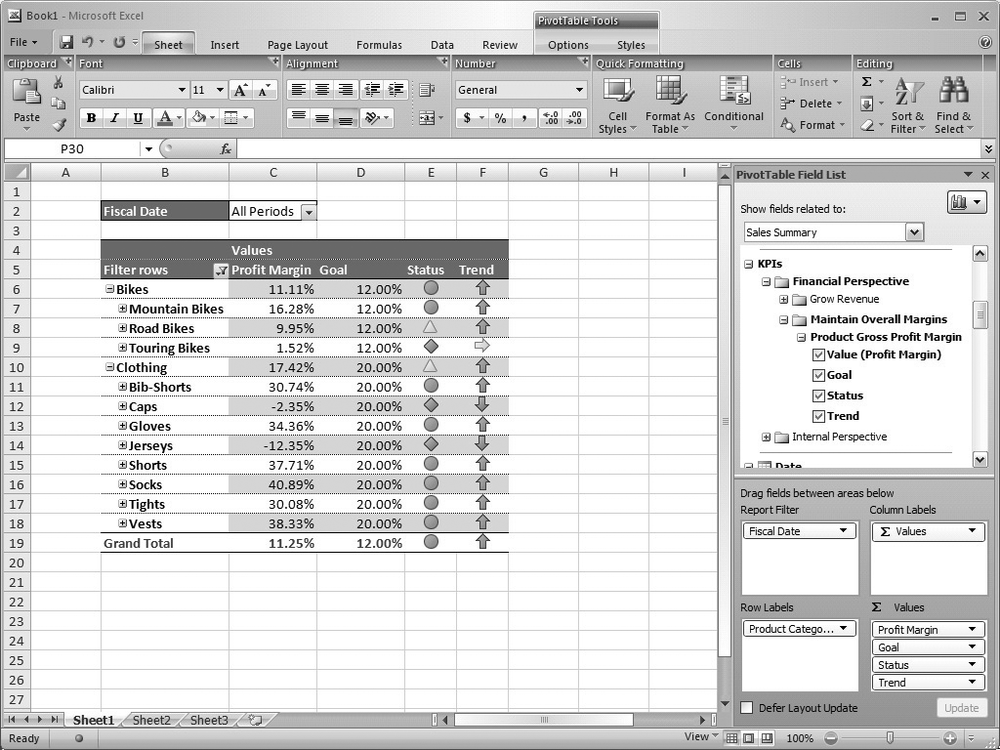
Excel 2007 has been improved to take advantage of multiprocessor server platforms, by running calculations on multiple CPUs at the same time. Excel also has increased spreadsheet row and column capacities, and now includes a resizable formulae bar and context-based Formulae AutoComplete. Additional new features include redesigned PivotTable views and a visualization engine.
Tip
See Chapter 18 and Chapter 19 for more information on Excel and Excel Services.
A SharePoint Data Collection Library or DCL can organize multiple data sources in a single library so you can easily find a list of links to all of your data sources. Coupled with SharePoint’s filtering and view capacities, you can present only those sources you desire for any meeting or group project. DCL provides safe and secure storage of database information in a single .odc file and can be used to access such data, even if the database is moved from one server to another.
SharePoint Document Libraries and Document Workspaces provide excellent tools for managing text-formatted data and presenting it in a web-accessible interface. Not only can you control the organization and presentation of documents, but you can also manage access rights so that only authorized users can view or modify a document. If you aren’t sure which document contains the information you need, use SharePoint’s search feature to quickly locate it. A SharePoint Document Center is shown in Figure 15-10.
Tip
See Chapter 9 and Chapter 17 for more information on document management.

You can use SharePoint Web Part pages and sites to share your BI data analytics and reports within your organization or with business partners and customers. As mentioned earlier in the "Data Management” section, raw data from multiple sources can be organized contextually, allowing you to perform meaningful analysis of the information for meetings, reports, and collaboration. You can also provide granulated security so that only your selected audience can access and modify your data. Furthermore, the actual data remains in the database or other source so that server security as well as SharePoint security measures can be employed.
The Microsoft SQL Server 2005 data warehousing solution is the core source for BI information. SQL Server has a proven track record as a reliable, scalable, and productive database platform. Analysis and Reporting are at the heart of SQL Server’s use as a BI tool:
- Microsoft SQL Server 2005 Analysis Services (SSAS)
Offers OLAP services and data mining, letting you specify particular dimensions in multidimensional data such as time and trend analysis views, and aiding you in the construction of complex analytical models. This technology is a completely new approach to administering, modeling, and querying data.
- SQL Server 2005 Reporting Services (SSRS)
Microsoft’s solution for creating and delivering managed reports. Reporting Web Parts allow SSRS to display SQL report information directly in a SharePoint site.
- SQL Server Business Intelligence Development Studio
Provides a completely integrated software development environment. Built on Visual Studio 2005 and specifically designed for the BI developer, Business Intelligence Development Studio can be used to develop such BI solutions as analysis services, database engines, integrations services, and reporting services.
Tip
See Learning SQL on SQL Server 2005, by Richard Earp and Sikha Bagui (O’Reilly) for more information on SQL Server 2005.
See Figure 15-11 for an example of Business Intelligence Development Studio.
One of the other data sources you can use with SharePoint to provide BI data is Microsoft Office Access 2007. If you want to connect to and modify data stored in Access 2007, you can use a special web browser plug-in, and then use the Access Web Datasheet. This functions similarly to Excel Web Services in that you can view Access 2007 data in datasheet view from SharePoint. Office 2007 must be installed on the client computer to view either Excel or Access data. You can import or export data between SharePoint and Access and even move an entire Access database into SharePoint. You can also edit SharePoint data inside of Access. You can see an open Access file in Figure 15-12.

One of the ways Access can add or transfer information into SharePoint is through an Access table that creates or modifies a SharePoint list.
Warning
Access and SharePoint data types are not the same. When you export Access data to SharePoint, some Access elements are not transferred. Also, SharePoint does not support Access form and report types. Given this, exporting data from Access to SharePoint is most effective when you are adding information to an already existing list rather than creating one from scratch. Avoid exporting Access forms and reports to SharePoint, as SharePoint members will not be able to open them.
From Access, open the desired database file.
Select the table you want to export.
Click on External Data, click Export, and then select SharePoint List on the ribbon.
Tip
The ribbon has replaced many toolbars and menus in Microsoft Office 2007, organizing logical groups of commands under tabs. For example, in Word 2007’s ribbon, clicking on the Home tab will reveal commands such as Copy, Cut, Paste, Bold, Spell check, and so on. Office 2007 applications that use the ribbon are Access, Excel, Outlook, PowerPoint, and Word.
In the Site Address field, type or paste in the URL to the SharePoint site where you want to export the table.
Type a brief explanation of table in the Description field.
To immediatelysee the SharePoint list after the table is exported, click the “Open the list when finished” checkbox.
Click OK.
If necessary, log in to the SharePoint site.
If you clicked the checkbox in step 6, the list will open the new or existing list when Access has finished the export.
If you want to be able to repeat this specific export again to update the list with new data from the same table, click “Save export steps” when prompted.

Tip
The actual data is only copied from Access to SharePoint, not transferred. As you change data in the database, you can repeat the export process to update the list. You can also specify that the data will not be exported but instead linked. When you link SharePoint to an Access table, any changes made on the linked table will display in the SharePoint list.
The door swings both ways: there is also a method of taking SharePoint list data and exporting it into an Access database. You can perform the following exercise only if Access 2007 is installed on your client computer:
At the SharePoint site, open the list, either by clicking the list’s name in Quick Launch or by clicking View All Site Content and then clicking on the list’s name.
Click Actions, and select Open with Microsoft Access from the list.
In the Name field, type in the name of an existing database, or if you want to create a brand new Access database, type in the new name.
Choose one of the following options:
“Import a copy of the list” will execute an import action similar to the previous exercise.
“Create a linked table” will link the table to the data in the SharePoint list.
Click OK to open Access to the database you specified in step 3.
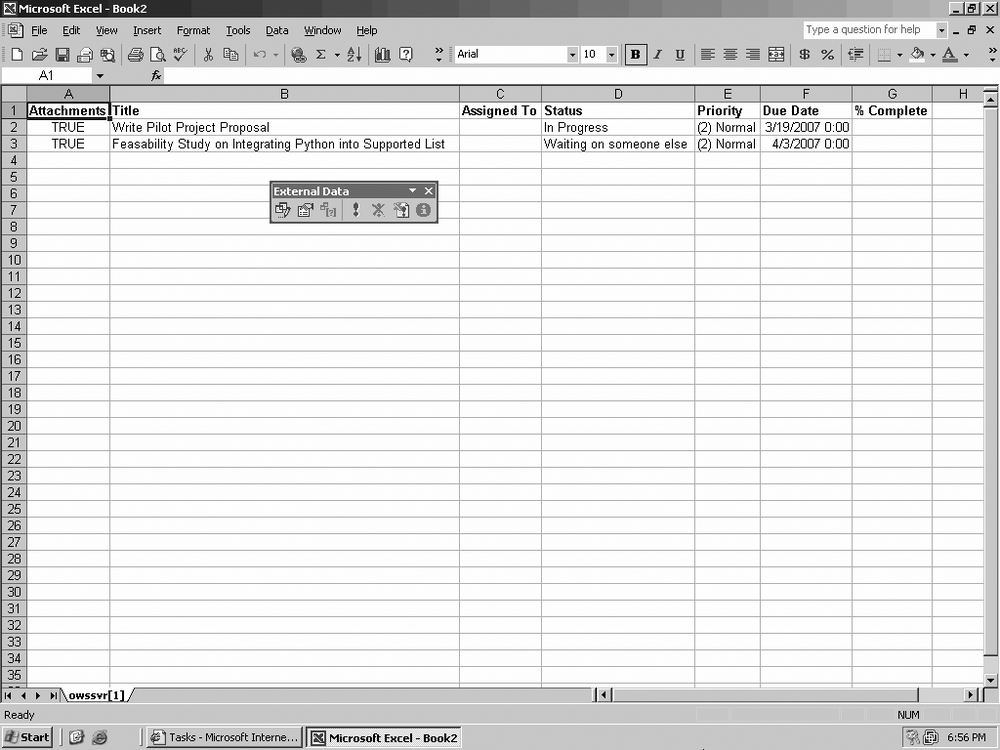
When Access opens on your local computer, you may be required to authenticate to the SharePoint site again. As you can see in Figure 15-13, you receive similar results when you export data from a SharePoint list into Excel.
When the database is created and modified, verify that the User Information List was also created.
Tip
SharePoint automatically copies the User Information Table to Access, listing the members of the SharePoint site. This is useful when you want to preserve list column information such as Created By and Modified By.
Once the process is completed, the list items will be displayed in Datasheet view in either Excel or Access, depending on the target application (Figure 15-14).

Editing database information linked to SharePoint allows you to dynamically modify the displayed data in the SharePoint list. If the list appears in a Web Part or Dashboard that is used for a BI purpose, that list will always present the most current data stored in Access.
One of the caveats is that you can’t change the table’s design in Access; you can change the design only from SharePoint. Another issue is that Access records are not checked out when you edit them, and it’s possible for two people to modify the same record at the same time, causing inconsistent information to display in SharePoint.
In order to view and modify an Access database, your client computer must have Microsoft Office Access installed. If this application isn’t available, you will not be able to open Access files. You may want SharePoint users who do not have Access on their computers to be able to use your database information. Moving the database to SharePoint will allow a much larger audience to access it.
Moving a database to SharePoint is a similar process to moving an Access database to SQL, and is done for the same reason: to “upsize” the database to a larger audience. However, upsizing a database to SharePoint creates a list for every table in the database.
Warning
Please keep this fact in mind when deciding to move a database to SharePoint. If the database contains an unusually large number of tables, you may have trouble managing such a large number of lists.
When the process is completed, the database tables are backed up in Access and the originals replaced with links to the SharePoint lists. From that point, all of the information in the database as viewed from Access resides only in SharePoint, although it is possible to restore the Access database from the backup:
In Access, open the desired database.
Click Choose External Data, click SharePoint Lists, and select “Move to SharePoint.”
When the “Move to SharePoint” wizard launches, type or paste in the URL of the SharePoint site in the “What SharePoint site do you want to use?” field.
If you want users to be able to see the data from inside Access, click the “Save a copy of my database to the SharePoint site” checkbox.
To upload the copy of your database to SharePoint, click Browse and navigate to the document library in SharePoint where the copy is to be stored.
Click Next. You may have to authenticate to the SharePoint site.
After the database transfer is completed, in the confirmation window that appears, click the Show Details checkbox if you want to see what changes Access made during the process.