
As we've seen, trend models make predictions. Given a good model, you expect additional data to follow the trend. When the trend is over time, you can get some idea of where future values may fall. However, predicting future values often requires a different type of model. Factors such as seasonality can make a difference not predicted by a trend alone. Starting with version 8.0, Tableau includes built-in forecasting models that can be used to predict and visualize future values.
To use forecasting, you'll need a view that includes a date field or enough date parts for Tableau to reconstruct a date (for example, a Year and a Month field). Tableau 10 also allows for forecasting based on integers instead of dates. You may drag and drop a Forecast from the Analytics pane, navigate to Analysis | Forecast | Show Forecast from the menu, or right click the view's pane and select the option from the context menu.
Here, for example is the view of the population growth over time of Afghanistan and Australia with forecasts shown:

Notice that, when you show the forecast, Tableau adds a forecast icon to the SUM(Population) field on Rows to indicate that the measure is being forecast. Additionally, Tableau adds a new special Forecast indicator field to Color so that forecast values are differentiated from actual values in the view.
When you edit the forecast by navigating to Analysis |Forecast | Forecast Options... from the menu, or using the right-click context menu on the view, you will be presented with various options for customizing the trend model, like this:
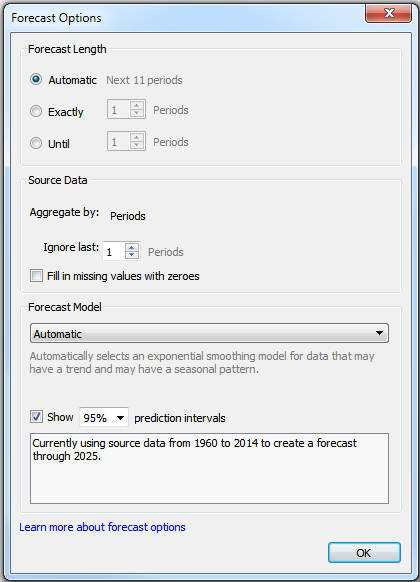
Here, you have options to set the length of the forecast, determine aggregations, customize the model, and set whether you wish to show prediction intervals. The forecast length is set to Automatic by default but you can extend the forecast by a custom value.
The options under source data allow you to optionally specify a different grain of data for the model. For example, your view might show a measure by year but you could allow Tableau to query the source data to retrieve values by month and use the finer grain to potentially achieve better results.
By default, the last value is excluded from the model. This is useful when you are working with data where the most recent time period is incomplete. For example, when records are added daily, the last (current) month is not complete until the final records are added on the last day of the month. Prior to that last day, the incomplete time period might skew the model unless it is ignored.
The model itself can be set to Automatic with or without seasonality or can be customized to set options for seasonality and trend. To understand the options, consider the following view of Sales by month from the Superstore sample data:

The data displays a distinct cyclical or seasonal pattern. This is very typical for retail sales. Many other data sets will exhibit similar patterns. The results of selecting various custom options are as follows:

Much like trends, forecast models and summary information can be accessed using the menu. Navigating to Analysis | Forecast |Describe Forecast will display a window with tabs for both the summary and details concerning the model:

Clicking the link at the bottom of the window will give you much more information on the forecast models used in Tableau.