Continuous (green) fields have values that flow from first to last. Numeric and date fields are often used as continuous fields in the view. The values of these fields have an order, which would make little sense to change.
When used on Rows or Columns, a continuous field defines an axis:

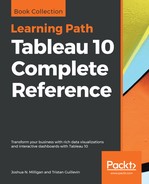
When used for color, a continuous field defines a gradient:

It is very important to note that continuous and discrete are different concepts from measure and dimension. While most dimensions are discrete by default and most measures are continuous by default, it is possible to use any measure as a discrete field and some dimensions as continuous fields.
In general, you can think of whether a field is continuous or discrete, as telling Tableau, how to display the data (header or axis, single colors or gradient) and measure or dimension, and how to organize the data (aggregate it or slice/group it).
As you work through the examples in this chapter, pay attention to the fields you are using to create the visualizations, whether they are dimensions or measures, and whether they are discrete or continuous. Experiment with changing fields in the view from continuous to discrete and vice versa to gain an understanding of the difference in the visualization.