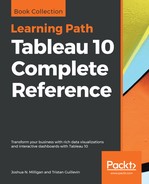
A lollipop chart is very similar to a bar chart, but typically uses thinner lines ending in a circle. This allows for some stylistic interest as well as a place to show values or other labels. Here, for example, is a lollipop chart for sales of categories in the Technology department:

Features and techniques used to create this chart include:
- A synchronized dual axis for SUM(Sales), with one mark type set to bar and sized to be very thin and the other mark type set to circle and sized to be large enough for a label
- Sales added to the label of the circle and formatted using a custom currency
- Axes have been hidden (right-click and uncheck Show Header)
Additional variations of this chart type might include flipping of orientation to be vertical, sorting of values, and using color or highlighting to call out certain values.