
Chapter 8
Best Practices Configuration Guide
Having read the first seven chapters of this book, you should now have your Google Analytics account set up and collecting quality data. To help you gain a better understanding of visitor behavior and get the most out of your data, this chapter will assist you with your configuration.
By following the recommended steps, you will gain real insight into the performance of your online presence. If you don’t follow the steps, reread this chapter. Seriously, this information is too important to skip over without implementing the suggested configurations—particularly goals and funnels.
No modifications of the Google Analytics Tracking Code (GATC) or your pages are required here. However, you will need administrator access to your Google Analytics account to use this chapter.
In Chapter 8, you will learn:
- Best practices for configuring Google Analytics
- The importance of defining goals and funnels
- The importance of visitor segmentation
- How to use filters and advanced segments
- How to set up your own intelligence alerts
It is important that the marketer and webmaster work together to understand each other’s needs. The marketer will be building the marketing strategy, and that requires working in conjunction with the webmaster to implement the necessary configuration changes. If you are a part of a large organization, then it is you as the analyst who manages and oversees this part of the project. Unless you are performing all three roles yourself, collaboration is the key to success here.
Once you have established your first Google Analytics web property and profile—created as part of your initial account-creation process—there are a few options you should configure in the first instance, as shown in Figure 8-1. To access this area from your initial login area, click the Settings icon at the top-right corner of your reports, then select the Profile Settings tab.
In Figure 8-1, in the area labeled A, the time zone and country options were set at the time of account creation. You can adjust them here, though bear in mind that if you have linked your account to your AdWords account, your AdWords settings take precedence and this cannot be changed—either in AdWords or Google Analytics. The consequences of this, particularly if you have multiple AdWords accounts, are discussed in the section “Roll-up Reporting” in Chapter 6, “Getting Started: Initial Setup.”
The remaining options allow you to enter your default page, exclude any URL query parameters for which reports are not required, and set the localization of currency. These are explained next.
Setting the Default Page
The default page is the web page your server defaults to when no page is specified—that is, the your home page. This is usually index.html, index.htm, index.php, or default.asp, but it can be anything your web hosting company or webmaster has specified. Once you enter your default page, Google Analytics is able to combine visits to www.mysite.com and www.mysite.com/index.html, which are in fact the same page, and report them both as /index.html.
If the default page is not specified, then these examples are reported as two separate pages, which is not desirable. However, some content management systems are rigorous with link definitions and are configured so that it is not possible for this scenario to arise. The result is that your default page name is hidden. If that describes your website, then I recommend leaving the default page field empty. This is to simplify your reports—showing root directory pages simply as / rather than /index.html. It’s a data visualization preference I have.
Figure 8-1: Initial profile setup options

Excluding Unnecessary Parameters
If your site uses unique session IDs or displays other query parameters in your URLs that are of no interest to you, you can exclude these parameters by entering them in the Exclude URL Query Parameters field (see Figure 8-1, the area labeled A). In fact, it is best practice to do this because it can dramatically reduce the amount of superfluous data collected, making reports faster loading and easier to read. Enter the variable name that you wish to exclude as it appears in your URLs. Variable name/value pairs follow a query symbol (?) in your URL and are separated by ampersands (&). Enter the name part you wish to exclude here—the part before the equal sign (=).
An example URL with a unique session ID is as follows:
www.mysite.com/BookingSystem/Action.do;jsessionid=QQQRTlkWyhJC016s18JYwN2
Specifying the jsessionid as the excluded parameter will shorten this into a more manageable URL for your reports and reduce the amount of unnecessarily collected data.
Excluding Parameter Mitigates Data Sampling
Google Analytics is restricted to providing reports for up to 10 million pageviews per month. This is stated in the terms of service. If you go above this limit, Google will send out email reminders to account administrators requesting that you sample your data collection so that you remain within the terms of service. For example, if you receive 20 million pageviews per month, Google will advise that you set a data collection sample rate of 50 percent.
Sampling data is statistically valid—10 million visits is a very large sample size. However, you can mitigate the need for sampling by ensuring that you exclude unnecessary query parameters. Setting your data collection sample rate is discussed in the section “Customizing the GATC” in Chapter 7, “Advanced Implementation.”
Currency Setting
The display currency you set and see in your reports—for transaction revenue, AdWords cost data, or monetized goals—is for display purposes only. It does not represent any real currency or take into consideration any exchange rates. That is, Google Analytics treats the currency setting as a label only.
For example, if you trade in US dollars and you accidentally set your profile currency setting to Japanese yen (it’s next in the drop-down list), the exact same numerical amount will be displayed in your reports, just the label will be incorrect. This affects all report revenue and cost metrics.
Enabling E-commerce Reporting
If your site has an e-commerce facility, you will want to see this data in your reports so that you can follow the complete visitor journey from referral source and pages viewed to checkout and payment confirmation. Selecting Yes, An E-Commerce Site, as shown in Figure 8-1 in the area labeled B, enables this reporting; you will see it as a separate menu item on the left side of the reports and as an additional tab within most report tables. If you do not have an e-commerce website, keep the default selection of Not An E-Commerce Site.
Note that enabling e-commerce provides additional reports within your account. Selecting this feature does not enable Google Analytics to collect the e-commerce data for you. To do this, you need to apply additional tracking code to the receipt page of your checkout system—see “Tracking E-commerce Transactions,” in Chapter 7.
AdWords Cost Source Settings
Once you import your AdWords data, you can apply the import on a per-profile basis. The area shown in Figure 8-1 in the area labeled C, is where you set this. If you have linked multiple AdWords accounts to your Google Analytics account, you will see multiple cost sources here. Linking your account with AdWords is described in the section “Integrating with Your AdWords Data” in Chapter 6.
Enabling Site Search
If your site has an internal search engine to help visitors locate content, you will want to see how this facility affects your visitors’ experience. Capturing internal search terms is an important asset when tuning your website. For example, it can reveal misspellings, synonyms, partial matches, or just plain different descriptions.
To do this, first select Do Track Site Search, as shown in Figure 8-1 in the area labeled D. This enables an additional Google Analytics report menu that can be found in the Content Site Search section.
With this feature enabled, you need to define which query parameter in your URLs contains the visitor’s site search term. You can usually discover this quickly by performing a site search yourself and looking for your search term in the result page URL. This is typically of the form ?q=mykeyword or &search=mykeyword. For these examples, the query parameter names are q and search, respectively. Google Analytics uses these values to determine that a visitor has made a search and which search terms were used. In the example in Figure 8-1 in the area labeled D, the query parameters are s and q.
Notice also that there is an option to strip your defined site search query parameters from the URL after site search processing has been completed. This can be helpful if those query parameters are of no further use to you for the purpose of Google Analytics reporting. However, those parameters may be important for defining your goals, your funnel steps, or your filters (see the sections “Goal Conversions and Funnels” and “Why Segmentation Is Important” later in this chapter). Site search query parameters could also be important if you are using virtual pageviews to aid in the reading of your reports (discussed in the section “_trackPageview: The Google Analytics Workhorse” in Chapter 7). Therefore, you should strip query parameters only if absolutely necessary.
Google Analytics Site Search also provides the option to define categories. Use this if your site search facility allows visitors to select a category for their search. For example, a retail site may have categories such as Menswear, Ladies’ Wear, and so on. A real estate website may have categories such as Apartments, Condos, Houses, and so forth. Categories help visitors find information easier by focusing their search. Understanding how categories compare is often the initial step when assessing the performance of your internal site search engine.
As with defining the site search query parameter, category parameters are obtained from the results page URL—for example, ?cat=menswear or §=condo. For these examples, the category parameter names are cat and sect, respectively. As with your defined query parameter, you can also strip your defined category parameters from the URL after site search processing has been completed. However, for the same reasons, strip query parameters only if absolutely necessary.
What If My URLs Don’t Contain Site Search Parameters?
For this situation you can employ virtual pageviews to insert the parameters for you. If your site search results page contains the visitor’s query term as an environment variable (for example, %searchterm), then you can use this as a virtual pageview. The following example is a modified GATC to achieve this:
<script type="text/javascript">
var _gaq = _gaq || [];_
_gaq.push(['_setAccount', 'UA-12345-1']);
_gaq.push(['_trackPageview','/site search/?q=%searchterm']);

(function() {
var ga = document.createElement('script'),
ga.type = 'text/javascript'; ga.async = true;
ga.src = ('https:' == document.location.protocol ? 'https://ssl' : ↵
'http://www') + '.google-analytics.com/ga.js';
var s = document.getElementsByTagName('script')[0];
s.parentNode.insertBefore(ga, s);
})();
</script>
In this example I have created a virtual pageview with a query parameter of q and its value set as the environment variable %searchterm. You can then use q as your site search query parameter as if this were the physical URL. The use of virtual pageviews is discussed in the section “_trackPageview: The Google Analytics Workhorse” in Chapter 7.
Note: Site search processing takes place before filter processing. Although it is possible to apply filters that modify the site search query or category parameters (perhaps making them more reader friendly), these will not show in your site search reports.
Tracking Zero Results for Site Search
A common requirement when assessing the effectiveness and performance of a site search facility is the ability to track which search terms generate zero results. Returning zero results is a particularly bad user experience that often leads to an automatic dismissal—the visitor moves on to another website.
That reaction is fair enough if you do not have the products or services the visitor is looking for. However, I regularly find that this is not the case. On the contrary, for some reason internal site search is frequently added to a site as an afterthought with little attention given to the quality of its performance, despite the obvious fact that users rely heavily on search when using the Web. Hence, many visitors leave a website with the mistaken belief that it cannot cater to their needs.
Capturing zero results allows you to distinguish between good and bad user experiences. To achieve this, use a category parameter labeled zero in your search result URL when this happens, as in this example:
www.mysite.com?q=widget&tab=zero
Ensure that you have added the category parameter tab (or other name) to your configuration, as shown in Figure 8-1. Then when you view your Site Search reports, you will have a dedicated category just for analyzing zero search results.
Note: Using key performance indicators for site search is discussed in Chapter 10, “Focusing on Key Performance Indicators.” Measuring the success of site search is described in Chapter 11, “Real-World Tasks.”
As emphasized throughout this book, collecting data is only the first step in understanding the visitor performance of your website. Google Analytics has more than 100 built-in reports by default; that’s impressive for fine-grain analysis, but it can be quite daunting to absorb all of this information, even for experienced users. In fact, I recommend you don’t even attempt to do so.
Instead, you can distill visitor information by configuring Google Analytics to report on goal conversions. Think of goal conversions as specific measurable actions that can be applied to every visit. The path a visitor takes to reach a goal is known as the funnel; this is shown schematically in Figure 8-2. As you can see, the number of visitors entering the funnel process decreases at each step.
Figure 8-2: Schematic funnel and goal process

The Importance of Defining Goals
Defining your website goals is probably the single most important step of your configuration process because it enables you to define success. Goal conversions, also referred to as simply goals or conversions, are any actions or engagements that build a relationship with your visitors. An obvious goal for an e-commerce site is the completion of a transaction. However, even without e-commerce, your website has goals, such as, for example, the completion of a feedback form, a subscription request, leaving a comment on a blog post, downloading a PDF white paper, viewing a special-offers page, or clicking a mailto: link. Goal conversions are the de facto way to ascertain whether your website is engaging with your visitors. They are your “success” metrics.
A goal is typically the reason why you put up a website in the first place: Was it to sell directly, to generate leads, to keep your clients or shareholders up-to-date, to provide centralized product updates, or to attract new staff? As you begin this exercise, you will realize that you actually have many website goals.
Also consider that goals don’t have to include the full conversion of a visitor into a customer—that is obviously very important, but it’s only part of the picture. If your only goal is to gain customers, then how will you know just how close noncustomers came to converting? You can gain insight into this by using additional goals to measure the building of relationships with your visitors. For example, for most visitors arriving on your website, it is unlikely they will instantly convert, so the page needs to persuade them to go deeper—that is, get them one step closer to your goal. Table 8-1 lists some example goals.
Table 8-1: Sample website goals
| Non-E-commerce Goals | Examples |
| Visitors downloading a document | Brochure, manual, white paper, price list (file types include PDF, XLS, DOC, PPT, etc.) |
| Visitors looking at specific pages or sections of pages | Jobs, price list, special offers, login page, admin page, location and contact details, terms and conditions, help desk or support area |
| Visitors completing a form | Login, registration, feedback form, subscription |
| Visitor engagement | Adding a blog comment, completing a survey, submitting a forum post, adding or editing their user profile, uploading content, rating an article |
| Visitor thresholds | Staying on the site longer than XX seconds, viewing more than YY pages |
| Transaction completed | Credit card thank-you page |
| Transaction failed | Credit card rejection page |
| Visitors entering shopping system | Adding to cart, getting to step x of y, using a promotional code or not |
Further Reading on Designing Goal-Driven Websites
Bryan Eisenberg, his brother Jeffrey Eisenberg, and Lisa T. Davis have written extensively on the persuasion process technique and coined the phrase persuasion architecture. Their book on the process is Waiting for Your Cat to Bark: Persuading Customers When They Ignore Marketing (Thomas Nelson Publishers, 2006).
Another worthwhile read when considering website goals and funnels is the excellent book Don’t Make Me Think by Steve Krug (New Riders, 2005). It’s a commonsense approach to web usability written in an easy-to-read and humorous way.
Apart from the goals shown in Table 8-1, your website may possess negative goals—that is, goals for which you would like to decrease or minimize the conversion rate. For example, if onsite search is an important aspect of your website navigation structure, then minimizing the number of zero search results returned for a query is a valid ambition. Perhaps minimizing the number of searches per visitor is also an indication of an efficient onsite search tool; the theory could be that fewer searches conducted means visitors are finding what they are looking for more quickly. Negative goals are common for product-support websites—that is, when the best visitor experience is for the least amount of engagement, such as time on site or page depth.
Defining and measuring goals is the basis for building your key performance indicators (KPIs). Chapter 10 defines and discusses KPIs in more detail, but essentially they enable you to incorporate web data into your overall business model.
Your Google Analytics Profile Can Be Configured for Up to 20 Goals
Your website should be focused enough that 20 goals cover your requirements. If they don’t, then look again at the number of goals you wish to measure. An obvious efficiency is to use wildcards—for example, *.pdf rather than individual PDF filenames.
If you truly need more than 20 goals to measure your website effectiveness, read “Monetizing a Non-E-commerce Website” in Chapter 11, which is applicable for all non-e-commerce goals.
What Funnel Shapes Can Tell You
Many website owners and marketers want to see a 100 percent goal conversion rate. In the real world, that just isn’t feasible. In fact, it is not as desirable as you might think. Consider your funnel as acting like a sieve, qualifying visitors along the way. As with the offline world, it is important to qualify your web visitors so that your support or returns department is not swamped with calls from disappointed customers. Therefore, losing visitors via your funnel is not necessarily a bad thing.
Conversely, if you have verified all the qualifications before the visitor enters the funnel, then you would expect a high conversion rate. The outcome is highly dependent on how good your funnel pages are at doing their job—that is, persuading visitors to continue to the next step. Consider each funnel step as a “micro-conversion” toward the “macro-conversion” of achieving a goal completion. Figure 8-3 shows example schematic funnel shapes.
Note: A detailed funnel analysis for a website is performed in Chapter 11.
Figure 8-3: Schematic conversion funnel shapes

Here’s the explanation for Figure 8-3:
Shape A The impossible 100 percent conversion rate.
Shape B The most common funnel shape, showing a sharp decrease in visitors until the payment form step. Assuming there are no hidden surprises for the visitor at this point, the vast majority of visitors who reach this point should convert.
Shape C A well-optimized conversion-funnel process, with only a gradual decrease in visitors. This is the optimum shape you will wish to obtain for all your funnels.
Shape D An ill-defined funnel—visitors are entering the funnel midway through the process.
Shape E A poorly converting funnel with a serious barrier to progress.
The most common shapes I have come across are B, D, and E. Shape A occurs only for a small section of an overall funnel process (if at all). Shape C is very rare—optimizing your funnels to approach this shape is where your greatest opportunity lies.
The Goal Setup Process
To set up your goals, log in to your Google Analytics account and click the settings icon (top right of your reports) for the profile you want to add a goal to. Then select the Goals section, as shown in Figure 8-4. Here you can define up to 20 goals. You can also group your goals into four categories (5 goals per category). Grouping similar goals together in the same category provides easier report interpretation. Apart from this, there is no other difference.
Figure 8-4: The Goals section of an account profile

In the Goals section, click + Goal for a goal set. This takes you to the screen shown in Figure 8-5—I assume you will choose Set 1.
Figure 8-5: Initial goal-configuration screen

General Information
In this area you name your goal, activate or deactivate it, and define what constitutes a goal.
Goal Name First, define a Goal Name that you will recognize when viewing reports. Examples include Email sign-up, Article AB123 download, Inquiry form sent, and Purchase complete. Ensure that the goal is Active, and then select a Goal Type from the options URL Destination, Time On Site, Page/Visit, and Event.
Goal Type Time On Site and Page/Visit are threshold goal types. With these, you can specify a value that the web visit must be greater than, less than, or equal to in order to trigger a goal match, such as, for example, Time On Site greater than 5 minutes, Page/Visit greater than 10. These could indicate strong interest from visitors whom you wish to identify. However, think carefully before reaching a conclusion on threshold goals; you should correlate with other data because a high Time On Site or Page/Visit value could mean your visitors are lost or confused and cannot find what they are looking for.
For the purposes of this example, select URL Destination as the Goal Type, which then expands out the screen as per Figure 8-6.
Figure 8-6: Second goal-configuration screen
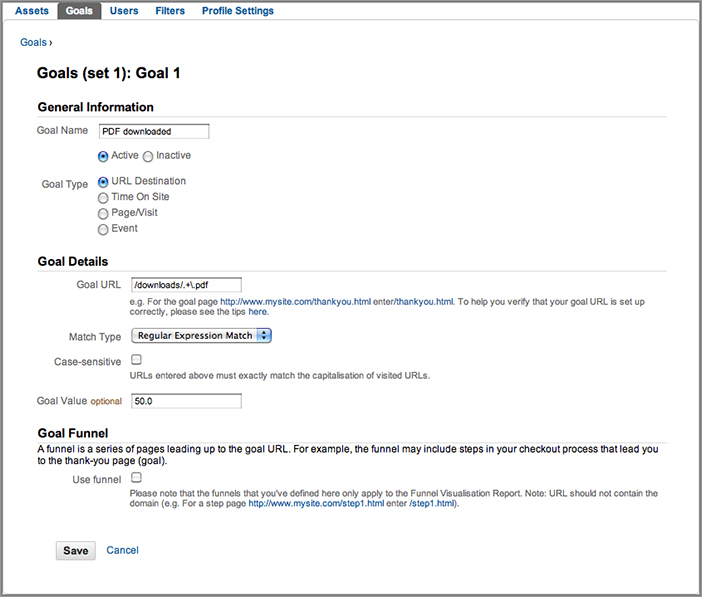
Goal Details
In this area you indicate how Google Analytics identifies a goal and associate a value, if applicable, when the goal is triggered.
Goal URL This is a page URL that can be reached only by achieving a goal. Clearly, if your goal page can be reached by visitors who have not completed the goal, then your conversion rates will be inflated and not representative. Although this is listed as the first step in the Goal Details section, ensure that you understand the match type, described next, before you complete this field.
Note: The goal URL should not contain the domain.
Note: The example shown in Figure 8-6 uses regular expression matching to treat all filenames in the /downloads directory that end in .pdf as a goal. In this example, I have assumed PDF downloads are being tracked as virtual pageviews, as described in Chapter 7.
Match Type Before entering the URL Destination value, you need to decide on how Google Analytics will perform the match.
The match type determines how your defined URLs are matched. There are three ways to achieve this: Exact Match, Head Match, and Regular Expression Match.
Exact Match This means exactly what it says—the exact URL of the page you want to define. No dynamic session identifiers and no wildcards can be used here, so it is best to cut and paste the URL from the address bar of your browser to define your goal.
Head Match If your URL destination is always the same but is followed by a unique session identifier or other parameters, use the Head Match filter and omit the unique values. For example, if the URL for a particular page is
http://www.mysite.com/checkout.cgi?page=5of5&id=9982251615
but the id varies for every user, enter
http://www.mysite.com/checkout.cgi?page=5of5
Regular Expression Match This uses regular expressions to match your URL Destination—for example, wildcards and metacharacters. This is useful when the URL, query parameters, or both vary between users:
http://sports.mysite.com/checkout.cgi?page=5of5&id=002
http://news.mysite.com/checkout.cgi?page=5of5&language=fr&id=119
To match against a single goal for this example, you would use the regular expression .+page=5of5+. to define the constant element, in this case, one or more characters, followed by the string page=5of5, followed by one or more characters. If you are unfamiliar with the use of regular expressions, see the overview provided in Appendix A.
Head Match and Exact Match are by far the most common ways to define simple goal and funnel steps, but e-commerce systems often require the use of regular expressions.
Case Sensitive If you want to differentiate URL Destinations that are identical except for the fact that one uses uppercase characters and the other uses lowercase characters—for example, productx.html and productX.html—then you should check the Case Sensitive check box. Most people do not change this, but it is there if needed.
Goal Value For non-e-commerce goals, Google Analytics uses your assigned goal value to calculate ROI, Per Visit Value, and other revenue-related metrics. The goal value is a constant value that is applied to all goal-completed URLs for each goal.
A good way to value a goal is to determine how often the visitors who reach the goal become customers. If, for example, your sales team can close 10 percent of people who request to be contacted and your average transaction is $500, then you might assign $50 (10 percent of $500) to your Inquiry form sent goal. Conversely, if only 1 percent of mailing list sign-ups result in a sale, then you might assign only $5 to your Email sign-up goal.
Goal Funnel
If you are using the goal type URL Destination, you have the option to add a funnel. Define these by clicking Use Funnel and proceed to the section “The Funnel Setup Process.” Otherwise, save your goal setup now.
Note: Monetizing goals is discussed in detail in “Monetizing a Non-E-commerce Website” in Chapter 11.
Tip: You may wish to differentiate conversions from transactions in your reports; that is, a visitor can convert to a customer only once during a session but can make several transactions. If this distinction is important to you, define an e-commerce goal by setting your transaction receipt page as the goal URL and leave the Goal Value field blank. Then set up your receipt page as described in “Tracking E-commerce Transactions” in Chapter 7.
Events Defined as Goals
An alternative goal type is an event—a goal that is triggered when an event is matched. An example is shown in Figure 8-7 for a visitor who has watched a YouTube video to completion.
When tracking an event, you can configure up to four parameters—the event category, action, label, and value (the setup of event tracking is discussed in Chapter 7). Any of these can be used to trigger the event as matching a goal. When using multiple matches, as shown in Figure 8-7, the matching parameters must all occur for the goal to be triggered. That is, for this example, the event category name must equal YouTube and the action name must equal Completed. If only one of those parameters matches, the goal will not be captured.
An important difference in the setup of event goals, compared to other goal types, is that an event goal value can be set at the point the event is triggered within your pages as opposed to within the goal configuration area. This is useful if the goal value varies depending on your visitor’s actions. For example, watching the same video in a different part of your website may have a higher value to your business.
By implementing an event value within your pages, as opposed to within the goal configuration area, you can use a dynamic goal value. If this describes your event tracking setup, select Use The Actual Event Value for the goal value section (Figure 8-7). Otherwise, you can set a constant value.
Figure 8-7: Configuring a video event as a goal

Tip: If you are creating event values within your pages but do not wish to assign a goal value for your events, select Use A Constant Value and enter 0.
The Funnel Setup Process
If you are using the goal type URL Destination, you have the option to add a funnel. Use this if you have a well-defined path that you expect visitors to take on their way to your goal URL. A checkout process is an obvious e-commerce example, though you may also have funnels for non-e-commerce goals, such as a subscription sign-up.
You may specify up to 10 page URLs in a funnel. Defining these pages enables you to see which pages lead to goal abandonment and where visitors go next. For an e-commerce goal, these pages might be the Begin Checkout page, Shipping Address Information page, and Credit Card Information page—a four-step funnel, that is, three funnel steps plus the goal conversion. Each step of the funnel has its own conversion rate that you can focus on.
Use Funnels Where Appropriate
Not all URL Destination goals have funnels. That is, not all conversions are achieved by visitors following a clearly defined linear path. An obvious linear path to conversion is an e-commerce shopping cart. You should certainly configure a defined funnel to analyze such a process.
However, for non-e-commerce conversions, consider carefully whether a funnel is necessary. For example, if there are many paths to achieve a PDF download, then analyzing this with a funnel would be pointless at best and misleading at worst. It would make more sense to define the goal without a funnel. If knowing the path that leads to such downloads is a key element of measuring your website’s success, then consider the Flow Visualizations report as discussed in Chapter 5, “Reports Explained.”
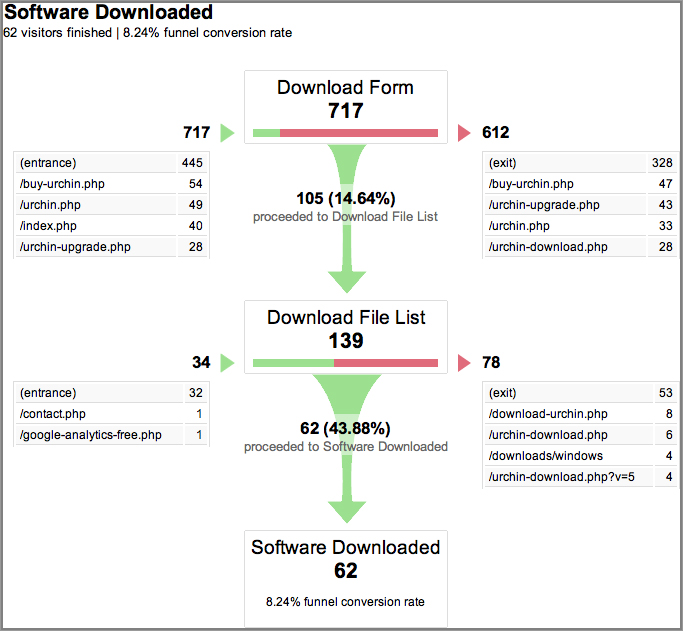
Figure 8-8 shows two funnel configuration examples—one for a nontransactional site, where the goal is a PDF file download, and one for an e-commerce shopping cart. Notice for the e-commerce funnel example, I have ended the URL match for steps 1 and 2 with ?catid= and ?prodid= respectively. The id values, such as www.mysite.com/shop/category.aspx?catid=101, are not important for the funnel configuration. By omitting them, I am grouping together all product and category URLs. An example Funnel Visualization report is shown in Figure 8-9.
Figure 8-8: (a) Example three-step funnel configuration for a nontransactional goal, and (b) example six-step funnel configuration for an e-commerce checkout. Note that the final goal page is not shown.
Note: Whichever match type you selected for URL Destination is continued throughout the funnel configuration. For example, if you selected Regular Expression Match, this is the same match type for each funnel step. Therefore, ensure that you check your funnel URLs for correctness—for example, escaping periods in filenames. See Appendix A for an overview of regular expressions.
Figure 8-9: A three-step Funnel Visualization report for a nontransactional goal
Funnel Backfill Behavior
It is important to define a funnel only where a clear linear path exists and where funnel steps cannot be skipped. If a funnel page is skipped by a visitor, Google Analytics will backfill the missing data as if the visitor had gone through those steps. Consider a scenario in which you have four funnel steps: S1 S2 S3 S4. A visitor entering the funnel at S2 and going directly to S4 will show as also progressing through S3 via the Google Analytics backfill. The backfill auto-completes any missing steps between the visitor’s funnel entry point and last step.
What Is a Required Step?
As you can see in Figure 8-8, there is a check box labeled Required Step next to the first funnel step. If this check box is selected, users reaching your goal page without traveling through this funnel page will not be counted as conversions in the Funnel Visualization report. Hence, the required step can be an important differentiator.
For example, consider visitors accessing a password-protected area of your website. You wish to define two goals:
- New sign-ups for access to this area
- The login of existing users
Both sets of visitors complete their action by arriving on the same page—the password-protected home page. This means the goal URL page must be defined the same way for each circumstance. However, the initial step is different. Therefore, you should use the Required Step check box to differentiate the different types of goals in this scenario.
Note: Using the required step to differentiate goals with the same URL will show only in reports that have funnel visualization in them. Other goal reports will show the same conversion rate for both examples because only the funnel path differentiates them.
Tracking Funnels for Which Every Step Has the Same URL
You may encounter a situation where you need to track a visitor’s progress through a funnel that has the same URL for each step. For example, your sign-up funnel might look like this:
Step 1: Sign Up
www.mysite.com/sign_up.cgi
Step 2: Accept Agreement
www.mysite.com/sign_up.cgi
Step 3: Finish
www.mysite.com/sign_up.cgi
To get around this, call the _trackPageview function to track virtual pageviews within each step, as discussed in “Tracking Unreadable URLs with Virtual Pageviews,” in Chapter 7. For example, within the GATC of the pages in question, you create virtual pageviews to be logged in Google Analytics as follows:
_gaq.push(['_trackPageview','/funnel_G1/step1.html'])
_gaq.push(['_trackPageview','/funnel_G1/step2.html')
_gaq.push(['_trackPageview','/funnel_G1/step3.html')
With these virtual pageviews now being logged instead of sign_up.cgi, you can configure each step of your funnel as follows:
Step 1: Sign Up
/funnel_G1/step1.html
Step 2: Accept Agreement
/funnel_G1/step2.html
Step 3: Finish
/funnel_G1/step3.html
Note: Funnel URLs should not contain the domain. For example, for a funnel URL step of www.mysite.com/funnel-1.html, enter only /funnel-1.html.
For you to understand the importance of segmentation, we first need to examine how averages are used in web analytics. When discussing averages, we are generally referring to the arithmetic mean that is computed by adding a group of values together and dividing by the total number of values in the group. It’s used in mathematics to approximate the statistical norm or expected value.
The arithmetic mean works well when the distribution under consideration is close to normal, that is, Gaussian or bell shaped. For normal distributions, the average value is also the most common (modal) value. For example, assuming a normal distribution for visitor time onsite, if the average time is calculated at 95 seconds, then it is also true to say the average visitor spends 95 seconds on your website. However, this is not true when the distribution is not normal—see Figure 8-10. That is, for the graphs labeled b and c, it is not true to say that the average visitor spends 95 seconds on your site. The concept of “average visitor” is not applicable unless the distribution is close to normal.
Figure 8-10: Sample visitor distributions for time spent onsite

Be Wary of Averages
For the vast majority of web metrics, the distribution of values is not Gaussian. In many cases, when the whole data set is considered, the distribution appears random. The whole data set can include new visitors, returning visitors, existing customers, people researching products, people purchasing products, job seekers, spammers, mistaken visitors (wrong address), employees, competitors, and so on.
In addition, if you have ever tried to establish common visitor paths on your website, you will have noticed these are very hard to detect—usually only a small percentage of visitors share a common path. It seems almost every visitor has a unique way of viewing a website for all but the shortest of paths (funnels excepted).
Figure 8-10 shows that for nonnormal distributions, a typical visitor will not exhibit the average (mean) behavior; in other words, not stay on the site for the mean length of time.
Plans based on average assumptions are wrong on average.
—from “The Flaw of Averages” by Sam Savage, www.stanford.edu/%7Esavage/faculty/savage/Flaw%20of%20averages.pdf
For the random distribution in the graph labeled c in Figure 8-10, quoting the mean value for the time spent onsite is misleading because the distribution indicates that many types of behavior are being exhibited. Perhaps the difference is indicating a mix of personas on your website—visitors, customers, blog readers, demographic differences, geographic differences. Whatever the reason, simply reporting an average is a blunt metric, and it is precisely the reason you rarely see averages reported in Google Analytics. When averages are reported, they are segmented—for example, shown for a specific page URL.
In summary, the mean is sensitive to outliers—data points that are numerically distant from the rest of the data. A frequent cause of outliers is a mixture of distributions, which may be distinct subpopulations (groups of visitors with different intentions). Therefore, when looking at averages, it is important to segment.
Within Google Analytics, there are three ways to segment your visitors:
- As you drill down through your reports (clicking data links)
- Using filters to provide a dedicated profile
- Using the Advanced Segments drop-down menu located at the top of your report screen
Drilling down into your data is intuitive and self-explanatory—as discussed in Chapter 4, “Using the Google Analytics Interface,” and Chapter 5, “Reports Explained.” Therefore, the next sections describe how to segment based on using profile filters or advanced segments.
Choosing Advanced Segments versus Profile Filters
Profile filters and advanced segments are complementary features to segment your visitors. Often I use both, first discovering segments within reports using the Advanced Segments menu. This is a quick and efficient method because I segment the data immediately and can look back at historical data using the same segment. Then if required, I use profile filters to create dedicated report sets just for that segment.
I consider profile filters a longer-term segmentation technique—a permanent way of segmenting visitors. Though profile filters can be changed or removed at any time, the main difference is that once data is segmented out, for example, removing the filter does not restore historical unfiltered data. The removed segment is permanently lost. Advanced segments, on the other hand, allow you to apply and remove segments without removing data. Table 8-2 compares the usage of each and suggests when one method may be more appropriate than the other.
Table 8-2: Advanced segments versus profile filters
| Advanced Segments | Profile Filters |
| Modify a report view at the visit level. | Modify incoming data at the pageview level to create separate profiles (reports). |
| Applied to current and historical data. | Applied only to new data from the time the filter is created. |
| Instantaneous results. Once they’re created, you can view segmented data in your reports immediately. | Aimed at longer-term usage where once set, the segment is unlikely to change. |
| Allow the use of conditional values on metrics, such as, for example, greater than, less than. | Only text string matches can be included. No numerical conditionals are available. |
| Set up by report users, making them safe. No data can be lost. | Set up by administrators because data can be permanently deleted. |
| Can test a hypothesis immediately. | Take 3–4 hours for data to populate reports. |
| Combine statements to meet multiple conditions. | Use cascading filters for combination effect. |
| Set on a per-user basis. Segments can be shared with other report users but cannot be used to hide data. | Set on a per-profile basis, therefore access to segmented data can be controlled separately from other wdata. |
| Regular expression statements are not limited, though the total combined for a segment with multiple statements must not exceed 30,000 characters. | Regular expression statements are limited to 255 characters. |
In summary, use profile filters to remove “noise” segments from your reports, such as your own staff visitors or your agency, which can be excluded from your target audience. Apply profile filters when the segment defined is a long-term one and unlikely to change—for example, your country offices wish to analyze only visits from within their region, or your support department wishes to focus only on help desk visitors. Use profile filters when you wish to control the level of access, such as providing paid search data to an external agency.
Conversely, use advanced segments when you are drilling down to understand visitor behavior—for example, comparing the performance of a particular marketing campaign against another, viewing mobile visitors versus desktop visitors, or determining whether customers browse differently from noncustomers. Apply advanced segments when you need to use conditional operators, such as visitors who spend more than 30 seconds on site or visitors who spend more than $100 per transaction.
Profile Segments: Segmenting Visitors Using Filters
Everything discussed so far in this book has been concerned with the collection of good-quality data—ensuring that the report numbers are as comprehensive, accurate, and informative as possible. We will now consider the removal of data using filters.
Profile filters are applied to the information coming into your account to manipulate the final data in order to provide specialized profiles (reports). By filtering, you gain a better understanding of visitor types to avoid interpreting an average of averages. In this case, think of it as segmenting out the “noise,” or outliers. For example, you may want to remove visits to your website from your own employees because the number of such visits can be significant, especially if your website is set as the default home page in their browsers.
In addition to having a data-cleansing role, profile filters can provide dedicated segmented reports. For example, if you run an overseas office, they may wish to have their own siloed set of reports relevant to their specific market, such as Asian visitors only or UK visitors only. That way, their conversion rates and ROI metrics will more accurately reflect their true value rather than including visits from other regions.
To segment your visitors into separate profiles, you apply filters to the data. Filters are applied on new data only. That is, a profile filter cannot affect historical data, and it is not possible to reprocess your old data through the new filter.
Note: Profile filters are not the same as table filters, as discussed in Chapter 4, “Using the Google Analytics Interface.”
Best Practice Tip: Keep a Profile without Filters
Always keep raw data intact. That is, keep your original profile and apply new filters to a duplicate profile in your account. That way, if you make a mistake in applying a new filter, you always have the original profile to fall back on.
Using this method, data will be imported simultaneously into both your original and the new report profile. Note that any existing filters applied to the first profile will not be copied, so you will need to reapply them using the Filter Manager. Creating new profiles is discussed in Chapter 6.
Creating a Profile Filter
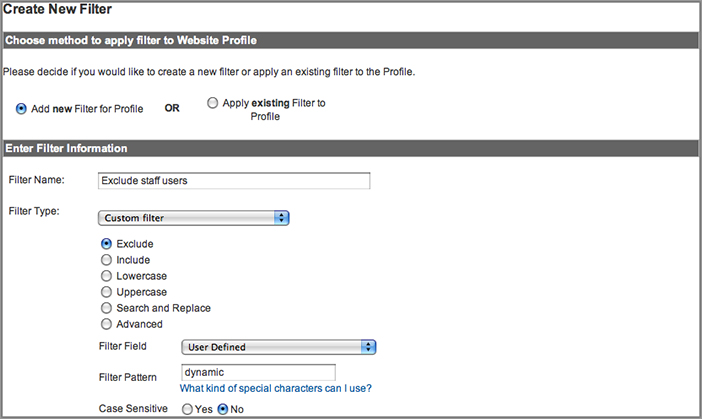
To create a profile filter, log in to your Google Analytics account as an administrator, click the settings icon (top right of the report screen) for the profile you wish to add a filter to, and then select the Filters menu tab as shown in Figure 8-11. To create a new filter, click + New Filter to take you to the screen in Figure 8-12. Note that once you have created your filter, you will be able to apply it to other profiles within your account.
Figure 8-11: Adding a new profile filter

Google Analytics provides you with predefined filter types as well as numerous options for a custom filter:
- Predefined filters provide a quick and easy way to accomplish some of the most common filtering tasks, as shown in Table 8-3. Creating a predefined filter is covered online in “How do I create a predefined filter?”
www.google.com/support/googleanalytics/bin/answer.py?answer=55496
- A custom filter allows for more advanced manipulation of data, and these are listed in Table 8-4. Creating a custom filter is covered online in “How do I create a custom filter?”
www.google.com/support/googleanalytics/bin/answer.py?answer=55492
A custom filter is used in most of the following filter examples.
Figure 8-12: Creating a new profile filter
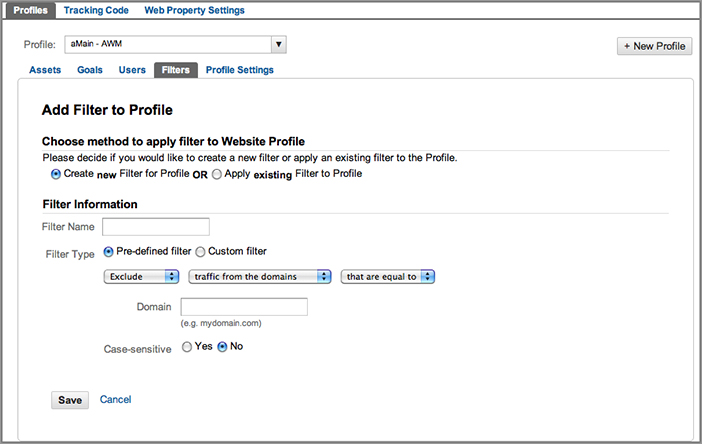
Table 8-3: Predefined filters
| Filter Type | Filter Name | Description |
| Include and exclude | Traffic from the domains | Includes or excludes traffic from a specific domain, such as an ISP or company network. |
| Include and exclude | Traffic from the IP address | Includes or excludes clicks from certain sources. You can enter a single IP address or a range of addresses. |
| Include and exclude | Traffic to the subdirectories | Includes or excludes visitors viewing only a particular subdirectory on your website, such as www.mysite.com/helpdesk. |
Table 8-4: Custom filters
| Custom Filter | Description |
| Exclude Pattern | This type of filter excludes log file lines (hits) that match the filter pattern. Matching lines are ignored in their entirety; for example, a filter that excludes Netscape will also exclude all other information in that log line, such as visitor, path, referral, and domain information. |
| Include Pattern | This type of filter includes logfile lines (hits) that match the filter pattern. All nonmatching hits are ignored, and any data in nonmatching hits is unavailable. |
| Uppercase/Lowercase | Converts the contents of the field into all uppercase or all lowercase characters. These filters affect only letters, not special characters or numbers. |
| Search & Replace | This simple filter can be used to search for a pattern within a field and replace it with an alternate form. |
| Advanced | This type of filter enables you to build a field from one or two other fields. The filtering engine will apply the expressions defined in the two Extract fields and then construct a field using the Constructor expression. See Chapter 9, “Google Analytics Customizations,” for examples of advanced custom filters in use. |
Understanding Filter Logic
If the filter being applied is an exclude filter and the pattern matches a data record, then the pageview entry is thrown away and Google Analytics continues processing with the next data record. If the pattern does not match, then the next filter is applied (if there is one) to that data record. This means that you can create either a single exclude filter with multiple patterns separated by pipe characters (|) or multiple exclude filters with a single pattern for each. Here are some examples:
Single exclude filter Exclude all traffic from 217.158.66.33 | 21.7.158.67.1
In English this means exclude traffic from one IP address OR the other. This can also be achieved using two separate filters processed one after the other:
Filter 1 of 2 Exclude all traffic from 217.158.66.33
Filter 2 of 2 Exclude all traffic from 21.7.158.67.1
Note: Filter patterns must not be longer than 255 characters. An overview of constructing regular expressions is given in Appendix A.
Include filters are applied with the reverse logic. When an include filter is applied, the data entry is thrown away if the pattern does not match the data. This is an important distinction if you apply multiple include filters because then the data entry must match every applied include filter in order for the data entry to be saved.
For example, if you apply an include filter for your internal (staff) visitors using your network IP address, it would not make sense to then add an additional include filter for, say, all Google search visitors. The combination will not result in reports of internal visitors plus Google visitors. The report will be only for internal visitors, assuming this filter is applied first, because everything else is discarded during processing at that point.
As for the case of exclude filters, to include multiple patterns for a specific field, create a single include filter that contains all of the individual expressions separated by pipe characters (|).
Using Multiple Include Filters
Best practice advice is to assign a maximum of one include filter to each of your profiles unless you have a specific need and understand the resulting logic implementations.
Custom Filters: Available Fields
Building your own custom filter allows you go way beyond the default filters preconfigured in Google Analytics. Essentially, you can filter on any available data field present in your reports.
Table 8-5 and Table 8-6 list all available fields and their purposes. Table 8-5 lists the regular fields—those automatically captured by Google Analytics—and Table 8-6 lists the user-defined variables whose values are determined by your implementation of Google Analytics, such as, for example, landing page campaign parameters, e-commerce fields, and so on.
Examples of using these for a custom filter are discussed in the next section, “Five Common Profile Filters.”
Table 8-5: Regular field list
| Filter Name | Description |
| Request URI | Includes the relative URL (the piece of the URL after the hostname). For example, for http://www.mysite.com/requestURL/index.html?sample=text, the request URI is /requestURL/index.html?sample=text. |
| Hostname | The full domain name of the page requested. For example, for http://www.mysite.com/requestURL/index.html?sample=text, the hostname is www.mysite.com. |
| Referral | The external referrer, if any. This field is populated only for the initial external referral at the beginning of a session. |
| Page Title | The contents of the <title> tags in the HTML of the delivered page. |
| Visitor Browser Program | The name of the browser program used by the visitor. |
| Visitor Browser Version | The version of the browser program used by the visitor. |
| Visitor Operating System Platform | The visitor’s operating system platform. |
| Visitor Operating System Version | The visitor’s operating system version. |
| Visitor Language Settings | The language setting in the visitor’s browser preferences. |
| Visitor Screen Resolution | The resolution of the visitor’s screen, as determined from the browser program. |
| Visitor Screen Colors | The color capabilities of the visitor’s screen, as determined from the browser program. |
| Visitor Java Enabled? | Whether Java is enabled in the visitor’s browser program. |
| Visitor Flash version | The version of Flash installed in the visitor’s browser program. |
| Visitor IP Address | The visitor’s IP address. |
| Visitor Geographic Domain | The visitor’s ISP (for example, aol.com or aol.co.uk for AOL users), derived from the geographic database. |
| Visitor ISP Organization | The ISP organization registered to the IP address of the user. This is the ISP the visitor is using to access the Internet. |
| Visitor Country | The visitor’s geographic country location obtained by information registered with the IP address. |
| Visitor Region | The visitor’s geographic region or state location, obtained by information registered with the IP address. |
| Visitor City | The visitor’s geographic city location, obtained by information registered with the IP address. |
| Visitor Connection Speed | Deprecated. The visitor’s connection speed, obtained by information registered with the IP address. |
| Visitor Type | Either New Visitor or Returning Visitor, based on Google Analytics identifiers. |
| Custom Field 1 | An empty, custom field for storage of values during filter computation. Data is not stored permanently in this field but can be used by subsequent filters. |
| Custom Field 2 | An empty, custom field for storage of values during filter computation. Data is not stored permanently in this field but can be used by subsequent filters. |
Table 8-6: User-defined variables
| Filter Name | Description |
| Campaign Source | The resource that provided the click (e.g., Google). This variable is automatically generated for AdWords hits when auto-tagging is turned on through the AdWords interface. |
| Campaign Medium | The medium used to generate the request (e.g., organic, cpc, or ppc). This variable is automatically generated for AdWords hits when auto-tagging is turned on through the AdWords interface. |
| Campaign Name | The name given to the marketing campaign or used to differentiate the campaign source (e.g., October Campaign). This variable is automatically generated for AdWords hits when auto-tagging is turned on through the AdWords interface. |
| Campaign Term | The term used to generate the ad from the referring source or campaign source, such as a keyword. This variable is automatically generated for AdWords hits when auto-tagging is turned on through the AdWords interface. |
| Campaign Content | Typically defines multivariate or split testing or is used to disseminate campaign target variables in an advertising campaign. This variable is automatically generated for AdWords hits when auto-tagging is turned on through the AdWords interface. |
| Campaign Code | Can be used to refer to a campaign lookup table (not yet implemented in Google Analytics). |
| User Defined | Deprecated. A custom variable name for use by the end user. |
| E-Commerce Transaction ID | A unique ID variable correlated with a designated transaction. |
| E-Commerce Transaction Country | Deprecated. Used to designate the country defined by the transaction process; obtained by information registered with the IP address. |
| E-Commerce Transaction Region | Deprecated. Used to designate the region defined by the transaction process; obtained by information registered with the IP address. |
| E-Commerce Transaction City | Deprecated. Represents the city where the commerce transaction occurred; obtained by information registered with the IP address. |
| E-Commerce Store or Order Location | Describes the store or affiliated site processing the transaction (e.g., US store, UK store, Affiliate123). |
| E-Commerce Item Name | The name of the item purchased. |
| E-Commerce Item Code | The identifier or code number corresponding to the item purchased. Commonly referred to as the stock-keeping unit (SKU) code. |
Note: There are a number of fields listed in Table 8-5 and Table 8-6 that are now deprecated. I list them here for completeness because the fields still exist in the current profile filter configuration screen.
Five Common Profile Filters
The following list highlights, in no particular order, the five most common filters applied by most users of Google Analytics. The majority are custom filters:
Include only your website’s traffic At the very least you should apply this filter to all your profiles.
Exclude certain known visitors For example, exclude your employees, your web agency, and so on.
Segment by geographical location Make it easy for your country managers by creating profiles of visitors relevant only to them.
Segment by visitor campaign, medium, or referrer source Visitors from different referrers may have different objectives.
Segment by content Visitors viewing particular sections of your website may display different behavior, such as, for example, purchase versus support sections.
These filters are discussed in more detail in the following sections. Before studying these, you should be familiar with regular expressions—see in Appendix A, “Regular Expression Overview.”
Including Only Your Website’s Traffic
This custom filter ensures that your data, and only your data, is collected into your Google Analytics profile. For example, it is possible for another person to hijack your GATC, placing the same code onto their own pages. This can happen deliberately or accidentally and is incredibly easy to do. A person simply copies your GATC by viewing your HTML source code. The consequence is that third-party traffic contaminates your results. Using the include filter shown in Figure 8-13 results in only traffic to mysite.com being reported. Note the backslash character () used to escape the delimiter character (.). This is an example of using regular expression syntax. Simply substitute mysite.com for your domain using the escape character for each . in your domain.
Figure 8-13: Filter to include only your website’s traffic

Of course, it may be desirable to collect data from multiple websites you control into one profile. In that case, add the multiple domains in the filter pattern separated with pipe characters—for example, mysite.com|mysite.co.uk.
Tip: In my view, the filter to include only your website’s traffic is the most important filter to apply to your profiles and is a required first step for a best practice configuration. It ensures that your data remains clean and prevents GATC hijacking—spammers use it to get their URLs in your reports in the hope you will click through to view ads. If you apply only one filter to your account, make sure it is this one.
Excluding Certain Known Visitors
Excluding visits from staff, your search marketing agency, or any known third parties, such as your web developers, is an important step when creating your profiles. These visitors generate a relatively high number of pageviews in areas that will greatly impact key metrics, such as your conversion rates.
For example, employees who have their browser home page set to the company website will show in your reports as returning visitors every time they open their browser—and most likely as one-page visitors. Remember that the GATC deliberately breaks through any caching, so it’s important to exclude employee visits from those of potential customers. Similarly, web developers heavily test checkout systems for troubleshooting purposes. These will also trigger GATC page requests, and most likely these will be for your goal-conversion pages. You should therefore exclude all such visits from your reports.
Excluding known visitors is straightforward if the visitor connects to the Internet via a fixed IP address. If this is the case, select the predefined filter Exclude Traffic From The IP Addresses from the Filter Manager, as shown in Figure 8-14a.
Figure 8-14: Excluding visitors from a known IP address (a) for a single IP address and (b) for an IP range

The example shown in Figure 8-14a is suitable for a single IP address or when you have a handful of IP addresses to exclude (set up multiple exclude filters for this). However, for an IP range, use a custom filter with a regular expression. For example, excluding the IP range 63.212.171.1–64 is shown as a custom filter in Figure 8-14a. For clarity, the regular expression is ^63.212.171.([1-9]|[1-5][0-9]|[1-6][0-4])$. See Appendix A for an overview of regular expressions.
Tip: To help you build regular expressions for IP ranges, Google has an excellent IP Address Range Tool you can use at www.google.com/support/analyticshelp/bin/answer.py?answer=1034771.
What If Visitors Do Not Have a Fixed IP Address?
This is often the case for home users, where the Internet service provider (ISP) assigns a different IP address each time the home user connects; this can also happen during a connected session. The solution is to use a custom variable (_setCustomVar) in conjunction with a custom exclude filter. The Custom Variables feature is described in Chapter 9 in “Labeling Visitors, Sessions, and Pages.”
The principle is that you direct known visitors you want to exclude to a hidden page (not used by regular visitors) that contains a JavaScript label within the GATC. The label is stored as a persistent cookie on that visitor’s computer and forms part of their pageview data. An exclude filter is then used to remove any pageview data that contains this label.
To assign a custom label to visitors, call the function _setCustomVar within the GATC on your hidden page as follows:
<script type="text/javascript">
var _gaq = _gaq || [];_
_gaq.push(['_setAccount', 'UA-12345-1']);
_gaq.push(['_setCustomVar',1,'Exclude Visitor','Dynamic IP',1]);
_gaq.push(['_trackPageview']);

(function() {
var ga = document.createElement('script'),
ga.type = 'text/javascript'; ga.async = true;
ga.src = ('https:' == document.location.protocol ? 'https://ssl' : ↵
'http://www') + '.google-analytics.com/ga.js';
var s = document.getElementsByTagName('script')[0];
s.parentNode.insertBefore(ga, s);
})();
</script>
In this way, only one visit to, for example, www.mysite.com/hiddenpage.htm is required to label the visitor until the cookie expires (24 months)—assuming the label cookie is not overwritten or deleted. Note that in this example, _setCustomVar is called with a name of Exclude Visitor and value (label) of Dyanmic IP. However, any value can be used for these, though it pays to have an easy-to-follow format. With each pageview from your dynamic IP visitor now labeled, you are ready to apply the filter required to exclude those visits from your profile (Figure 8-15).
Note: The index of the custom variable used in this example is set to 1. You will need to ensure that this index is free and not being used for any other custom variable, otherwise it may be overwritten. You can check what custom variables are being set by viewing your Visitors Demographics Custom Variables reports.
Figure 8-15: Excluding labeled visitors
Segmenting by Geographical Location
Google Analytics performs an excellent job of showing you the countries from which your visitors are accessing your website. It even groups them into regions (continents, such as Americas, Europe, Asia, Oceania, Africa) and subregions (Northern Europe, Central Europe, Eastern Europe, Southern Europe). For example, refer to Chapter 5. However, if your organization operates specifically in certain markets, you may want to create a profile that focuses on reporting visitors from just those countries. For example, North America (Canada and the United States) or BRIC Region (Brazil, Russia, India, China) can be included in a separate profile; the latter is shown by the filter in Figure 8-16.
Figure 8-16: Segmenting visitors by country

By this method, country managers can better focus on the metrics without having to constantly remove out irrelevant visits. For clarity, the regular expression is Brazil|Russia|India|China. See Appendix A for an overview of regular expressions.
Filter Pattern Tip
When deciding what value to place in the Filter Pattern field, always consult your reports. For example, when you’re cross-segmenting a page by country, the available values are displayed. Note that these are all in English. They are listed as Spain, Netherlands, Germany, and so on, not España, Nederland, Deutschland. Use only the values from your reports in the Filter Pattern field. Partial matches are also allowed.
Segmenting by Campaign, Medium, or Referrer Source
As with the use of other filters discussed, Google Analytics already does an excellent job of displaying different campaigns, mediums, or source referrers. However, in some scenarios it can be helpful to have a profile with dedicated reports for them to help you optimize them better. For example, if you have a search marketing agency helping you with paid search, you may wish to isolate just your paid search visitors for their view. Similarly, if you employ an email marketing agency, you can isolate just email referrals. Having a separate profile gives you control over the report access, allowing you to filter out noise and protect other potentially confidential data.
How you construct this filter depends on how you have set up your campaign landing page URLs (see “Campaign Tracking” in Chapter 7). The values you assigned for utm_source, utm_medium, and utm_campaign need to match the following filter fields:
- Campaign Name
- Campaign Source
- Campaign Medium
To filter Google-only visitors, both paid and nonpaid, into a separate profile, apply the filter shown in Figure 8-17.
If you wish to track AdWords-only visitors, and this is the only paid search network you are running, apply the filter as shown in Figure 8-18. (I have assumed you have auto-tagging enabled in your AdWords account.)
If you are running other paid search networks (Microsoft adCenter, Yahoo! Search Marketing, and so on) and they are labeled as utm_medium = cpc, you will need to apply both filters (shown in Figure 8-17 and Figure 8-18) in order.
Figure 8-17: Filter to include only Google visitors

Figure 8-18: Filter to include only AdWords visitors

Note: If you tag all other pay-per-click campaigns, such as Yahoo! Search Marketing, Microsoft adCenter, Miva, and so on, with utm_medium=ppc, then the filter shown in Figure 8-18 on its own would be sufficient to segment Google AdWords visitors from other paid search networks. I use this technique because Google AdWords is so prevalent for online marketing. Being able to compare AdWords visitors against all other pay-per-click networks as a whole can be very useful.
Figure 8-19 shows how to segment only email visitors—that is, those visitors who have clicked a link to your website within an email message, assuming you set up such links as utm_medium=email.
Figure 8-19: Filter to include only email visitors

As you can see, segmenting by campaign, source, or medium is as simple as knowing what these values are in your corresponding landing page URLs and then applying them as field values to your include and exclude filters.
Segmenting by Content
Often within one website you will be trying to satisfy the needs of very different visitors, such as, for example, product purchase versus product support or corporate information versus customer information. Effectively measuring such different needs requires the setting of very different goals for each section, hence the creation of separate profiles using filters. Figure 8-20 is an example filter that segments by content—in this case, a support blog.
Of course, the success of this filter depends on you having a well-ordered website directory structure on which to filter content. If you do not, it is possible to achieve a virtual structure by using virtual pageviews, as described in “_trackPageview: The Google Analytics Workhorse,” in Chapter 7.
Figure 8-20: Filter to include only blog visitors

Assigning a Filter Order
By default, a profile’s filters are applied to the incoming data in the order in which the filters were added. However, you can easily modify the order from your Profile Settings Filters page, using the Assign Filter Order button from within your profile settings (shown in Figure 8-11). This shows the current filter order with the ability to move any filter up or down in the list (see Figure 8-21). The order in which filters are applied is important, for example, if the filters described in Figure 8-17 and Figure 8-18 are to be combined.
Figure 8-21: Assigning filter order

Report Segments: Segmenting Visitors Using Advanced Segments
The Advanced Segments menu allows you to segment your data within your reports. Unlike with profile filters, you do not have to create separate profiles for an advanced segment because it leaves your original data untouched. Whereas profile filters modify data on the pageview level, advanced segments change a report’s view of the data at the visit level.
Note: To reiterate, advanced segments work on entire visits. For example, if you create an advanced segment equal to “Page Title matches X,” the result shows you all visits in which pages with the title X were viewed, including all other pageviews that occurred during those visits.
The majority of Google Analytics reports contain an Advanced Segments drop-down menu at the top left of the screen (it’s labeled O in Figure 4-4). By default, All Visits is selected. If you click this option, the area beneath it expands, as shown in Figure 8-22. This is where you can select, create, and manage your advanced segments.
Figure 8-22: Advanced Segments management area
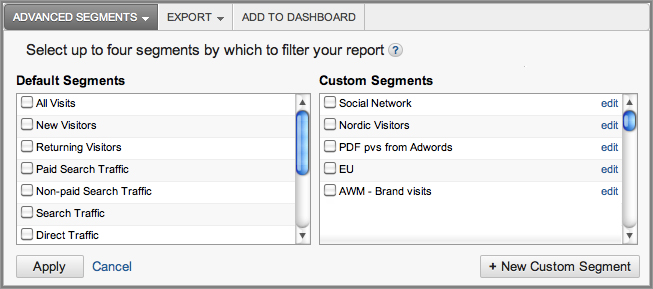
As you can see from Figure 8-22, two options are available: Default Segments includes segments that are prebuilt and ready for immediate use; Custom Segments allows you create your own advanced segment for specific needs. The Custom Segments area will be empty if you have not previously created any.
Default Advanced Segments
As the name suggests, Google has included a number of prebuilt advanced segments for you to use:
All Visits No segmentation applied.
New Visitors Visitors who have not been to your site before, assuming they have not deleted their Google Analytics cookies since their last visit, or returning visitors using a different computer or browser. Definition: Visitor type matches exactly “New Visitor.”
Returning Visitors Visitors who have previously viewed your site using the same device and browser. Definition: Visitor type matches exactly “Returning Visitor.”
Paid Search Traffic Definition: Visitor referral medium matches exactly any of the following: cpc, ppc, cpa, cpm, cpv, or cpp.
Non-paid Search Traffic Any visit whose referral medium is set to organic. Definition: Visitor medium matches exactly “organic.”
Search Traffic Both paid and nonpaid searches. Definition: Visitor referral medium matches exactly any of the following: cpc, ppc, cpa, cpm, cpv, cpp, or organic.
Direct Traffic Visitors who typed your web URL directly or used a browser bookmark to arrive at your site. These could also be visits missing campaign information. See Chapter 7 for a description of campaign tracking. Definition: Visitor referral medium matches (none).
Referral Traffic Visitors who followed a link from other site (not a recognized search engine) to arrive at yours. Definition: Visitor referral medium matches exactly “referral.”
Visits with Conversions Your highest-value visitors. Definition: Visits with total goal completions greater than 0.
Visits with Transactions Your customers. Definition: Visits with transactions greater than 0.
Mobile Traffic Visits from smartphones and tablet devices. Definition: Mobile matches exactly “Yes.”
Non-bounce Visits Visits that consisted of more than one page or one page plus an event. See Chapter 7 for a definition of event tracking. Definition: Visits with bounce equal to 0.
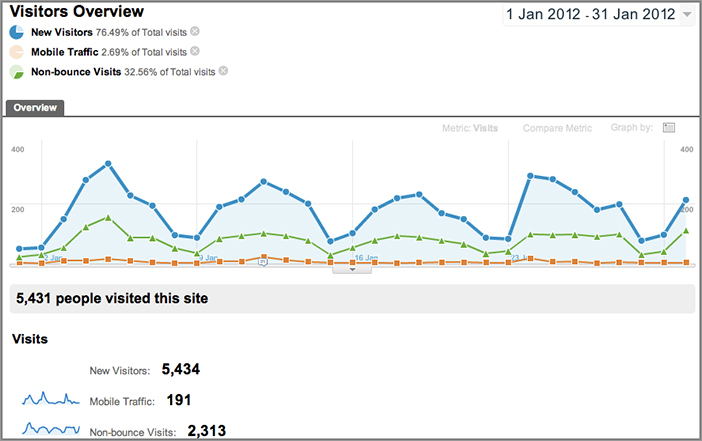
This is not intended to be an exhaustive list, though it is very handy for common segmentation requirements. Check off the segments you want to select—currently limited to a maximum of four at any one time, and click Apply to finish. Your graph and tables reflect the segmented data, as shown in Figure 8-23.
Figure 8-23: Comparing three advanced segments
Custom Advanced Segments
Although the default segments are useful, the real power of this feature is in its ability for you to be creative and discover the segments that are important to you. To create your own custom segment, from the screen shown in Figure 8-22, select + New Custom Segment. For this example, we will create a custom segment of visits with two or more unique purchases (purchased 2 or more unique items in their transaction). Follow these steps, as shown in Figure 8-24:
Figure 8-24: Building a custom segment

1. Name your segment with an informative name.
2. Select Include as the segment type.
3. Scroll to the Unique Purchases metric in the dimension/metric drop-down menu (the list is alphabetically sorted), or search for the word unique in the query field at the top of the list.
4. Select the Unique Purchases metric and set the condition to Greater Than.
5. Enter the comparison value for the segment. In this example, enter 1 in the value field.
6. Test each segment to make sure conditions make sense for the segment you defined. Click Test Segment to view the effect once the advanced segment is applied.
7. Assuming the test is successful, save your new segment.
Once saved, your new advanced segment is available to use as a check box in the Custom Segments area, shown in Figure 8-22. You can manage (edit, copy, delete) your custom segments from your profile settings page, under Assets, as shown in Figure 8-25.
Figure 8-25: Managing your custom segments

Dimensions versus Metrics
Two types of data are represented in Google Analytics reports: dimensions and metrics (refer to Figure 4-5). Dimensions are typically listed in the left column vertically and metrics are typically listed along the top horizontally. Dimensions are text strings that describe an item. Think of them as names, such as page URL, page title, hostname, browser type, connection speed, transaction ID, product name, and so on. Metrics are numbers such as, for example, time on page, time on site, bounce rate, and purchase total. The conditional operators less than and greater than can be applied only to metrics.
Example Custom Segments
Advanced segments can be incredibly powerful when it comes to drilling down into your data. It can seem like an endless supply of permutations and combinations is available. Which specific advanced segments meet your needs will be determined by your website type (lead generation, e-commerce, corporate information, content publisher, and so on) and the value such segments bring to your organization. The following four examples are ones that I commonly use.
Segmenting Customers from Visitors
Segments that differentiate your customer visits from those that are not customers are important because often you will wish to analyze these two visitor types separately. You have two options to achieve this. The simplest approach for a transactional website is to segment visitors who purchase during their visit. A default segment is available for this: Visits with Transactions. As described earlier, this is defined as visits where the number of transactions is greater than zero.
However, an improvement on this is to segment visitors who have purchased from your website at any time during their relationship with you. You achieve this by applying a visitor-scoped label at the point of their purchase confirmation. Essentially, a persistent cookie is set when a purchase is made—for example, purchaser—and this is updated for any subsequent purchases. By this method you can segment your customers and view their behavior on your site, even if they do not purchase, by applying the custom segment shown in Figure 8-26.
Figure 8-26: A custom segment to differentiate e-commerce customers

The method is also applicable for a nontransactional site. That is, set a visitor-scoped label at the point of an engagement that is a strong indicator for them becoming a customer (for example, when a PDF brochure is downloaded, a contact form submitted, or subscription request confirmed). If you have all of these as engagement options, you could use the same label to aggregate all your potential customers together or use different labels and apply multiple OR conditions to group them into one custom segment. The latter is shown as an example in Figure 8-27.
Visitor labeling is described in “Labeling Visitors, Sessions, and Pages” in Chapter 9.
Figure 8-27: A custom segment to differentiate non-e-commerce potential customers

Segmenting Social Network Visits
In Google Analytics, all visits that originate from a social network website are tracked in the same way as any other referrals to your site. That is, they are grouped together with the plethora of visits from all the other referral links to your site. Because social networks can significantly impact your search engine rankings as well as rapidly create a buzz around your brand, studying this segment can be very revealing.
Figure 8-28 groups the social networks that are relevant to www.advanced-web-metrics.com as a single segment using a regular expression to match a list of social referrer sources:
facebook|feedburner|twitter|^t.co|wikipedia|stumbleupon|groups.google|
groups.yahoo|linkedin|technorati|newsgator|PRweb|econsultancy|
searchengineland|hootsuite|webmasterworld
Figure 8-28: A custom segment highlighting social network visits

In addition, in Figure 8-28 I have set an OR condition to match if the campaign medium is set to social network. By default all social network visits are labeled as medium=referral in your Google Analytics reports. However, if you are using campaign tracking for your social media strategy, as specified in Chapter 7 (see Figure 7-5a and Figure 7-5b), then the OR condition will pick these up also.
You will want to build your own regular expression list around the networks that are important to you. As a starter, include the first four from my list. Note that you could create separate matching conditions, using the OR operator, in the same way as shown in Figure 8-27. That is a perfectly valid way, though I chose a regular expression because this list can become long.
Note: Key performance indicators (KPIs) for social network visits are covered in Chapter 10.
Grouping Visits from a Geographic Region
Google Analytics does an excellent job of showing geographically where your visitors come from. However, there are times when you need to group visitors as a single segment. For example, if you have North, South, and Central American offices, you may want to group visits from those regions. If you operate only on the East Coast, you may want to group visitors from relevant cities. You can apply this as well to Europe, the Middle East, Asia, and Africa.
Figure 8-29 shows a segment generated for Nordic customers. I use OR to match the country field with AND to ensure that this is for customers rather than all visits. Notice in this case that I did not use Matches Regular Expression to build a single-condition field. Instead, I explicitly entered each country as a separate match. This can be useful for troubleshooting purposes; that is, you can explicitly match each field and test to ensure that you receive the expected result. Then you can combine the fields as a regular expression if required.
Figure 8-29: A custom segment grouping customers from the Nordic region
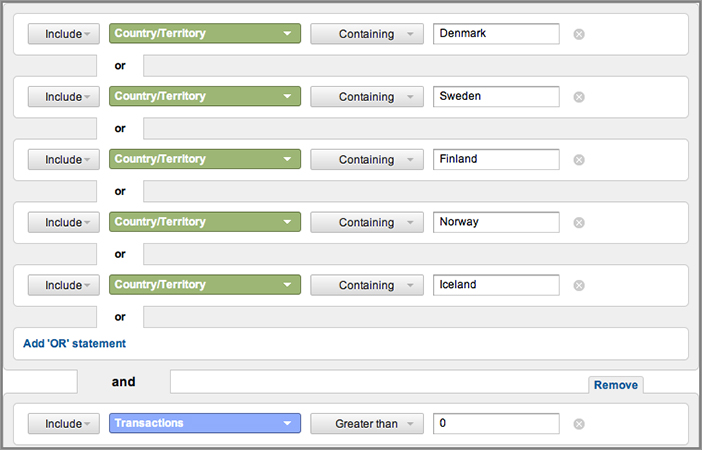
Segmenting Branded Search Visits
The number of people who arrive on your site as a result of knowing your brand name is an important segment. This includes visitors who type in your brand names or product names on search engines and click through to your site—for both paid and organic searches. Figure 8-30 is an example of reporting on a brand segment for this book.
Figure 8-30: A custom segment grouping all brand-related visits

Although I could have used a single regular expression to simplify the matching, I deliberately separated these into three groups: brand name matches (author name), product name matches (book name), and blog name matches. If you have a large number of brand names to match on, it can be useful to group your matches in this way to simplify understanding the advanced segment construction. A common use of this is when your brand or product is known by a different name in other languages.
When Organic Keywords Are Not Provided
For logged-in users of Google organic search—that is, visitors who are logged into their Google account when performing an organic search (such as logged into Gmail in a different browser window/tab)—their keyword terms are not available in your reports. Search terms from such visitors will show as (not provided) in Google Analytics.
See the official announcement of this “feature”:
http://googleblog.blogspot.com/2011/10/making-search-more-secure.html
Note: KPIs for brand engagement are discussed in the section “Marketer and Communication KPI Examples” in Chapter 10.
Creating Custom Intelligence Alerts
As described in Chapter 5, the Google Analytics intelligence engine monitors your website’s traffic to detect significant statistical variations and then generates alerts when those variations occur. They are a powerful way of highlighting what traffic patterns have changed on your site. However, you do need to view the reports in order to see the alerts.
To improve on this, custom intelligence alerts not only allow you to specify your own alert criteria, they also have the ability to send an email when the alert triggers—so you do not need to view your reports to be aware of the change. As you can imagine, there are myriad possibilities for this feature, so it’s important that you focus on alerts that may not get picked up by automatic alerts. Otherwise, you end up being swamped with email alerts and quickly suffer from alert blindness.
You set up custom intelligence alerts by clicking the profile settings icon (top right of the report screen) and selecting Custom Alerts from your profile Assets tab—see Figure 8-25.
The following are two example custom intelligence alerts that I often use. The first example is shown in Figure 8-31. This simply alerts me if there has been a sudden traffic spike. I define a traffic spike as being 30 percent greater than the same day the previous week. If your traffic regularly varies by large amounts week on week, consider specifying a visit number as a threshold instead, with the condition set to Increases By More Than. For example, you could use a number 30 percent higher than what you would normally expect for a peak day.
Figure 8-31: A custom intelligence alert for traffic spikes
Some important features to note from Figure 8-31:
1. The alert can be applied to multiple profiles. These can be any profile you have access to, including those within other Google Analytics accounts.
2. You can specify the alert period to compare with traffic day on day, week on week, or month on month.
3. An email can be sent when the alert triggers. This can be to yourself and others.
4. The alert condition can be applied to all visits, or to any other dimension, as well as any predefined advanced custom segment.
Tip: I also recommend a custom alert to warn you when traffic drops significantly. Simply change the condition shown in Figure 8-31 to % Decreases By More Than.
The second example, shown in Figure 8-32, alerts the marketer when revenue from a new online campaign is generated. Generally speaking, traffic from a new campaign is expected and therefore not considered alert material. However, revenue indicates success, and so it’s something much more important to be aware of! It also provides a quick indication of the time lag between a campaign launching and when it begins to generate revenue.
If you are a nontransaction site, substitute the alert metric Revenue, for the Goal Conversion Rate.
Figure 8-32: A custom intelligence alert for revenue from a new campaign

In Chapter 8, you have learned the following:
Perform initial configuration You have learned how to set the initial configuration of your account, including localization, e-commerce, and Site Search settings.
Configure goals Configuring goals provides you with conversion and engagement rates. You have learned how to identify and set goals in order to benchmark yourself.
Configure funnels Funnels enable you to see what barriers exist on the path to achieving a goal. We discussed how to configure funnels and the significance of their shapes.
Configure segmentation Filtering keeps your data clean and, along with the Advanced Segments component, is the method of segmenting visitors:
- Setting up filters to maintain the integrity of your data
- Segmenting data to gain a deeper understanding of visitor behavior
- Using filters for data cleansing as a method for long-term segmentation
- Using advanced segments as an efficient way to focus on visitor types
Configure custom intelligence alerts Intelligence alerts make you aware of significant change. By customizing them, you define what constitutes a significant change and can be alerted via email.