
Chapter 12
Integrating Google Analytics with Third-Party Applications
This book has so far focused on collecting, analyzing, and using web visitor data from within the Google Analytics user interface. You can import data from AdWords, AdSense, and Webmaster Tools and export individual reports in XML, CSV, TSV, or PDF format. This method of exporting is ideal for one-off needs or regular schedules via email. However, sometimes you require a regular pull of data, wish to integrate data into another system, or want to be creative and visualize your data in a completely different way.
In this chapter I explain the techniques used to auto-extract data, and I present case studies on how different organizations are pushing the envelope by adding extra functionality to Google Analytics.
In Chapter 12, you will learn:
- To extract Google Analytics cookie information using JavaScript or PHP
- To use the Google Analytics core reporting API
- To use the Google Analytics API via case studies from third-party applications
- To use Google Analytics to track phone calls
- To integrate Website Optimizer with Google Analytics
Extracting Google Analytics Information
The launch of the free Google Analytics export application programming interface (API) in May 2009 was a pivotal moment in the history of Google Analytics. It paved the way for greater innovation by opening up the product so that third-party developers could build their own applications around the data. In addition, the API has provided Google with greater transparency in its data-collection methodology—you are able to query your own data as and when you wish.
If you have the necessary programming skills to develop API applications, go straight to the next section to learn which applications are already available in the wild or to start building your own. However, sometimes a simple query of the Google Analytics cookies can be sufficient for your needs. For example, a visitor subscribes or makes a purchase on your website, and you wish to pass the original referrer information, such as the search engine name and keywords used, into your customer relationship management (CRM) system. In such cases, consider using one of the approaches outlined in the following two sections: importing data using JavaScript or importing data using PHP.
Importing Data into Your CRM Using JavaScript
Campaign variables (medium, referral source, keywords, and so on) captured by Google Analytics are stored in the campaign cookie named __utmz. Using standard JavaScript methods, you can extract this information at the point when a visitor submits a form request or confirms their purchase, and you can then transmit this into your CRM, help desk, or logfile system. I’ll demonstrate the method using a submit form. In summary, there are three straightforward steps:
- Add standard JavaScript functions to extract the values from the Google Analytics cookies.
- Add extra form fields in your HTML to hold the extracted cookie values.
- Call the JavaScript functions when the form is successfully submitted to extract the cookie values and place them in your hidden form fields.
The following text describes the method and necessary code. You can also download the functions from www.advanced-web-metrics.com/chapter12:
1. Copy the following two JavaScript functions into the <head> section of the HTML page containing your form:
<script type="text/javascript">
 function _uGC(l,n,s) {
   // used to obtain a value form a string of key=value pairs
   if (!l || l=="" || !n || n=="" || !s || s=="") return "-";
   var i,i2,i3,c="-";
   i=l.indexOf(n);
   i3=n.indexOf("=")+1;
   if (i > -1) {
      i2=l.indexOf(s,i); if (i2 < 0) { i2=l.length; }
      c=l.substring((i+i3),i2);
   }
   return c;
 }

 function setHidden(f) {
   // set values for hidden form fields
   var z = _uGC(document.cookie, "utmz=",";");
   f.web_source.value = _uGC(z,"utmcsr=","|");
   f.web_medium.value = _uGC(z,"utmcmd=","|");
   f.web_term.value = _uGC(z,"utmctr=","|");
   f.web_content.value = _uGC(z,"utmcct=","|");
   f.web_campaign.value = _uGC(z,"utmccn=","|");

   var gclid = _uGC(z,"utmgclid=","|");
   if (gclid) {                         //this is an AdWords visitor
      f.web_source.value = "google";
      f.web_medium.value = "cpc";
      //It is not possible to capture AdWords campaign details by this
      //method as GA processing is required for this. Therefore the
      //following lines are set to remove confusion should a visitor
      //use multiple referrals with the last one being AdWords.

      f.web_term.value = "";            // remove previous info if any
      f.web_content.value = "";         // remove previous info if any
      f.web_campaign.value = "";        // remove previous info if any
   }
 }
</script>
2. Within your HTML <form> tag of the same page, add the onSubmit event handler and hidden form fields as follows:
<form method="post" action="formhandler.cgi" onSubmit="setHidden(this);">
   <input type=hidden name=web_source value="">
   <input type=hidden name=web_medium value="">
   <input type=hidden name=web_term value="">
   <input type=hidden name=web_content value="">
   <input type=hidden name=web_campaign value="">
...etc.
</form>
3. If you already have an onSubmit event handler, append the setHidden(this) call:
<form method="post" action="formhandler.cgi"
onSubmit="validate();setHidden(this);">
By this method, when a visitor submits the form to your CRM or other third-party system, a call is first made to the JavaScript function setHidden(this). This routine extracts the campaign variables from the Google Analytics __utmz cookie using the function _uGC. These are stored as hidden form fields and transmitted to your CRM system with the visitor’s other form data.
Although in this example only campaign variables are extracted from the cookies and passed into your application, you can use the same method to query any of the Google Analytics __utm* cookies and include their values in your import. For example, the contents of __utma contain time-stamp information on a visitor’s first and previous visit as well as how many times they have visited your site in total. An example of extracting this information is described next.
Note: Even without a CRM system, you may want to use this method. For example, most formhandler scripts allow you to log the details of a form submission. Simply append the hidden form fields to your logfile.
Importing Data into Your CRM Using PHP
Similar to using client-side JavaScript to query and extract Google Analytics cookie information, as described in the previous section, you can use server-side techniques. The following is an example using PHP, developed by João Correia and first discussed at the following location:
http://joaocorreia.pt/blog/2009/09/google-analytics-php-cookie-parser/#english
The method defines a PHP class to parse the __utma and __umtz cookie data. This class is used to provide the integration between Google Analytics and your CRM (or other third-party) application. The code is reproduced here with permission and is also available at www.advanced-web-metrics.com/chapter12.
In summary, there are two straightforward steps:
- Add standard PHP code to the page collecting the Google Analytics cookies, such as, for example, test.php.
- Add the PHP class file to your website.
- Load test.php in your browser.
To see this example working, follow these steps:
1. Place the following PHP code on the page where you wish to view the Google Analytics cookie information (for example, test.php):
<?
require("class.gaparse.php");
$aux = new GA_Parse($_COOKIE);

echo "Campaign source: ".$aux->campaign_source."<br />";
echo "Campaign name: ".$aux->campaign_name."<br />";
echo "Campaign medium: ".$aux->campaign_medium."<br />";
echo "Campaign content: ".$aux->campaign_content."<br />";
echo "Campaign term: ".$aux->campaign_term."<br />";

echo "Date of first visit: ".$aux->first_visit."<br />";
echo "Date of previous visit: ".$aux->previous_visit."<br />";
echo "Date of current visit: ".$aux->current_visit_started."<br />";
echo "Times visited: ".$aux->times_visited."<br />";
?>
2. Place the following code in a file named class.gaparse.php in the same directory as test.php:
<?
class GA_Parse
{
var $campaign_source; // Campaign Source
var $campaign_name; // Campaign Name
var $campaign_medium; // Campaign Medium
var $campaign_content; // Campaign Content
var $campaign_term; // Campaign Term
var $first_visit; // Date of first visit
var $previous_visit; // Date of previous visit
var $current_visit_started; // Current visit started at
var $times_visited; // Times visited
function __construct($_COOKIE) {
$this->utmz = $_COOKIE["__utmz"];
$this->utma = $_COOKIE["__utma"];
$this->ParseCookies();
}
function ParseCookies(){
// Parse __utmz cookie
list($domain_hash,$timestamp, $session_number, $campaign_number, ↵
$campaign_data) = split('[.]', $this->utmz);
// Parse the campaign data
$campaign_data = parse_str(strtr($campaign_data, "|", "&amp;"));
$this->campaign_source = $utmcsr;
$this->campaign_name = $utmccn;
$this->campaign_medium = $utmcmd;
$this->campaign_term = $utmctr;
$this->campaign_content = $utmcct;
if($utmgclid) {
$this->campaign_source = "google";
$this->campaign_name = "";
$this->campaign_medium = "cpc";
$this->campaign_content = "";
$this->campaign_term = $utmctr;
}
// Parse the __utma Cookie
list($domain_hash,
$random_id,
$time_initial_visit,
$time_beginning_previous_visit,
$time_beginning_current_visit,
$session_counter) = split('[.]', $this->utma);
$this->first_visit = date("d M Y - H:i",$time_initial_visit);
$this->previous_visit = date("d M Y - H:i",↵
$time_beginning_previous_visit);
$this->current_visit_started = date("d M Y - H:i",↵
$time_beginning_current_visit);
$this->times_visited = $session_counter;
}
}
?>
3. Load test.php in your browser.
You will see something similar to Figure 12-2—simple and elegant! With the Google Analytics cookie values captured, you can then pass these into your CRM system as hidden form fields or environment variables.
Figure 12-1: Extracting Google Analytics cookie information to import into your CRM system using PHP

Note: As per Chapter 2 and Chapter 3 (see the sections “Privacy Considerations for the Web Analytics Industry” in Chapter 2 and “Google Analytics and Privacy” in Chapter 3), you should not collect any personally identifiable information in Google Analytics—no usernames, email addresses, and such. Capturing a unique ID value at the point when a visitor is contacting you (submitting a form) is fine as long as that is transparent in your privacy statement. Using the same unique ID as your CRM system allows you to match up online submitted information from Google Analytics with your customer database.
Working with the Google Analytics Core Reporting API
The previous sections described quick and simple techniques for extracting Google Analytics cookies and importing this information into a third-party application. I will now describe how to extract any (and all) of your Google Analytics report data, by utilizing the Google Analytics Core Reporting application programming interface (API). The API is the basis of building your own app.
My intention is to give the reader an overview of the capabilities of the Google Analytics Core Reporting API and illustrate this with examples of what smart people around the world are doing with it. I’ve kept coding examples to a minimum, and I encourage you to view the online documentation at http://code.google.com/apis/analytics for detailed instructions.
The Google Analytics Core Reporting API is built on the Google Data Protocol used by many other Google services:
http://code.google.com/apis/gdata/docs/2.0/reference.html
It allows developers with the correct authorization (discussed later in this chapter) access to processed Google Analytics data. The purpose is to facilitate and propagate the use of Google Analytics data in ways the current user interface cannot provide. The Core Reporting API achieves this by allowing data to be exported without the requirement of a user interacting with the Google Analytics user interface. This provides the infrastructure for developers to build their own applications for manipulating data, whether for integrating web visitor data with other third-party systems, such as email marketing, CMS, CRM, and survey systems; providing auto-refresh functionality in Excel; producing highly customized dashboards; or creating new, innovative ways of visualizing data. The possibilities are endless. If you are trying to do something with your data that the Google Analytics interface cannot do, you can probably build an app for it—or maybe one already exists.
If you wish to see what apps are available before delving into the details of the API, skip ahead to the section “Example Apps.”
Note: At present the Core Reporting API is a one-way street. That is, you can only export data from a Google Analytics account. Many users, including myself, hope that one day an import API will be made available so that third-party data can be included in the Google Analytics user interface. Possibilities include importing cost data from non-Google campaigns, allowing you to view the return on investment on all marketing activities (email, SEO, Yahoo! Search Marketing, and the like), offsite web analytics data such as social media brand mentions, and sentiment information alongside your Google Analytics onsite data.
A schematic of the Google Analytics data-querying architecture is shown in Figure 12-2. Note that this is an extension of the schematic shown in Figure 3-2 of Chapter 3, “Google Analytics Features, Benefits, and Limitations.” For more information on BigTable, see http://en.wikipedia.org/wiki/BigTable.
To summarize the last row shown in Figure 12-2, there are currently three ways to obtain your web visitor data:
- Asking predefined questions and displaying the results in a fixed user-interface format
- Asking custom questions and displaying the results in a fixed user-interface format
- Asking custom questions that are not tied to a user interface
As you can see, whether you use the standard Google Analytics reports, custom reporting, or the Core Reporting API, all data requests go to the Google Analytics Query Engine. This lookup engine knows where to find requested information from the processed (precomputed) data tables. The secret sauce Google has created makes the query engine extremely fast and super scalable—a huge engineering achievement for a service that must handle billions of queries every day. As an aside, this is one of the key differentiators between Google Analytics and its sibling product Urchin Software. Urchin is discussed in Chapter 3.
Figure 12-2: Schematic example of the Google Analytics Core Reporting API

At this stage it is important to realize that querying the data, by whatever method, results in a query to the processed data, that is, data that has initial computations carried out—such as time on page; whether the page is an entrance, exit, or bounce page; and whether it is a goal, part of a funnel, an event, or a transaction. The only exception to this is when building advanced segments, which results in a query to the raw (BigTable) data via the query engine.
How to Use the Core Reporting API—the Basics
The Google Analytics Core Reporting API is a REST API, meaning that its software architecture corresponds to the Representational State Transfer style. In this case, it means that you send your data request as a URL with query parameters defining the content of your “question.” The Google Analytics Core Reporting API then returns an XML data feed corresponding to the “answer” of your question. See the following location for more information on the REST architecture:
http://en.wikipedia.org/wiki/Representational_State_Transfer
The use of the REST architecture provides a straightforward, efficient process that requires knowledge of only three steps, which are discussed next:
- Authorization
- Account query
- Report data query
Tip: Assuming you have a webmaster or web developer background, view Google’s JavaScript tutorial at http://code.google.com/apis/analytics/docs/gdata/1.0/gdataJavascript.html (this is how I got started!). Other programming languages are also available.
Authorization
Similar to having to log in to Google Analytics, before users can view data from an application that uses the data export API, they must be granted access. The Core Reporting API requires a user to grant an application access to their data. This is achieved with a request for an authorization token from the Google Accounts API. The method prevents user credentials from being sent around the Internet for each request and is therefore more secure. Authentication takes place via the Google Accounts API only, not the Core Reporting API.
Three types of authorization services are supported:
ClientLogin username and password authentication Used for applications that run on a user’s computer only, that is, not distributed to other users.
AuthSub proxy authorization Used for distributed applications. A user’s username and password are never revealed to the application. Instead, the application obtains special AuthSub tokens, which it uses to act on a particular user’s behalf. The end user can revoke access by the third party from their Google Account configuration page (www.google.com/accounts).
OAuth authorization Similar to AuthSub though typically used for developing an application in an environment that uses a variety of services from multiple providers.
For the purpose of simplification (more streamlined code), I consider only the ClientLogin method in this section.
Note: Do not use ClientLogin if you are writing an application that runs on your computer to make requests on behalf of third-party end users. Instead, use either AuthSub or OAuth, which protect end users’ private data. Because ClientLogin stores the user login data, it should only be used in cases where that data is under the direct control of the user, that is, on their personal computer.
To request an authorization token through ClientLogin, send a POST request to the following URL: https://www.google.com/accounts/ClientLogin. The POST body should contain a set of query parameters that appear as parameters passed by an HTML form, using the application/x-www-form-urlencoded content type. These parameters are as follows:
- accountType: Set to GOOGLE
- Email: The full email address of the user’s Google Account
- passwd: The user’s Google Account password
- service: Set to analytics
- source: A string identifying your application in the form companyName-applicationName-versionID
To see how straightforward communication is with the Google Analytics Core Reporting API (you do not need a degree in software programming), use the following HTML form submission to authenticate:
<form action="https://www.google.com/accounts/ClientLogin" Method="POST">
   <input type="hidden" name="accountType" value="GOOGLE">
   <input type="hidden" name="service" value="analytics">
   <input type="hidden" name="source" value="BClifton-testApp-1.0">
   <input type="text" name="Email" value="">
   <input type="password" name="Passwd" value="">
   <input type="submit" value="Log me in">
</form>
If authorization succeeds, the server returns an HTTP 200 (OK Status) code, plus three long alphanumeric codes in the body of the response: SID, LSID, and Auth. If the authorization request fails, then the server returns an HTTP 401 (Unauthorized Status) code.
While this HTML form method illustrates the simplicity of the approach, it is not very practical because you then need to cut and paste the returned token into your application! The following methods take this to the next level by handling the authentication within the script itself.
Account Query
Once your application has verified that the user has access, the next step is to find out which specific accounts the user has access to. To access the Google Analytics account feed, send an HTTP GET request to https://www.google.com/analytics/feeds/accounts/default. For this to work, you must add the authorization token to this request. Note that you cannot enter this URL via your browser address bar because the token must be inserted in the HTTP headers of the request. The following is an example of how to access the account feed through the Bourne shell using cURL (available from www.advanced-web-metrics.com/chapter12). Authorization takes place first, with the token inserted in the HTTP header of the subsequent account query.
Run the script using your preferred Linux environment—the Apple Terminal application will also suffice—and view the resulting output.
#!/bin/bash
USER_EMAIL="" #Insert your Google Account email here
USER_PASS="" #Insert your password here

# generate the authorization token
googleAuthToken="$(curl https://www.google.com/accounts/ClientLogin -s
   -d Email=$USER_EMAIL
   -d Passwd=$USER_PASS
   -d accountType=GOOGLE
   -d source=curl-accountFeed-v1
   -d service=analytics
    | awk /Auth=.*/)"

# Feed URI
feedUri="https://www.google.com/analytics/feeds/accounts/default?↵
prettyprint=true"
# Call feedUri with the authorization token inserted into the header
curl $feedUri -s --header "Authorization: GoogleLogin $googleAuthToken"
Remember that users can have access to many different accounts—and within them, many different profiles. For this reason, your application cannot access any report information without first requesting the list of accounts available to the user. The resulting accounts feed returns this list. The list also contains the account profiles that the user can view. An example of the returned account and profile list is shown in Figure 12-3.
Note that the account feed request described here returns an all-or-nothing output. All account and profile information is displayed; this can be a large amount of information if the authorized user has access to many accounts and profiles. For example, Figure 12-3 is the output from a single profile, and I have access to hundreds of profiles.
To provide finer-grained control, there is a Management API. This allows you to adjust the scope of your account request—for example, only access the data from a specific profile—so that the feed response is faster and you handle data more efficiently. Further information is at the following location:
http://code.google.com/intl/fi-FI/apis/analytics/docs/mgmt/home.html
Figure 12-3: Example XML output of an API account query request

Note: In the account and report query examples, JavaScript is not used because inserting the authorization token into the request HTTP header is harder to achieve. This is because JavaScript is unable to make cross-domain requests. However, a workaround for this is provided in the JavaScript client libraries available at http://code.google.com/apis/analytics/docs/gdata/gdataLibraries.html.
Report Query
From the list of available profiles obtained from the account query, your application can request report data. The key to this request is the profile ID for the profile obtained in the account feed (see Figure 12-3). This is the same as the profile ID number found in the user interface of the Profile Settings screen. When working with the Core Reporting API, you must specify the profile ID for each profile you require access to. You can also view a particular profile ID in the Google Analytics user interface.
The data feed provides access to all data in a selected profile. To access the Google Analytics Report Feed, send an HTTP GET request to https://www.google.com/analytics/feeds/data. As for the account query, you cannot achieve this using your browser address bar because the authorization token must be inserted into the HTTP headers. Authorization takes place first, with the token inserted into the HTTP header of the subsequent account query.
The following is an example of how to access the report feed through the Bourne shell using cURL (available from www.advanced-web-metrics.com/chapter12):
#!/bin/bash
USER_EMAIL="" #Insert your Google Account email address here
USER_PASS="" #Insert your password here
PROFILE_ID="" #Insert your profile ID here

# generate the authorization token
googleAuthToken="$(curl https://www.google.com/accounts/ClientLogin -s
   -d Email=$USER_EMAIL
   -d Passwd=$USER_PASS
   -d accountType=GOOGLE
   -d source=curl-accountFeed-v1
   -d service=analytics
   | awk /Auth=.*/)"

# Feed URI with query parameter specifying data request
feedUri="https://www.google.com/analytics/feeds/data
?start-date=2012-01-01
&end-date=2012-01-31
&dimensions=ga:source,ga:medium
&metrics=ga:visits,ga:bounces
&sort=-ga:visits
&filters=ga:medium%3D%3Dreferral
&max-results=5
&ids=ga:$PROFILE_ID
&prettyprint=true"

# Call feedUri with the authorization token inserted into the header
curl $feedUri -s --header "Authorization: GoogleLogin $googleAuthToken"
As you can see in this example, you use query parameters to indicate what analytics data you want as well as how you want it filtered and sorted. The XML output looks similar to Figure 12-3. However, rather than show this, or explain the laborious list of feed input parameters that are available, a better way to understand the usage of API report queries is via the Report Query Builder, described next.
Note: The reference guide for dimensions and metrics can be found at http://code.google.com/apis/analytics/docs/gdata/gdataReferenceDimensionsMetrics.html.
Report Query Builder
The Google Analytics Data Feed Query Explorer lets you experiment with specifying different metrics, dimensions, filters, and so on and view the resulting query URL and corresponding data it fetches. You can try this at
http://code.google.com/apis/analytics/docs/gdata/gdataExplorer.html
The screenshot in Figure 12-4 illustrates an example of its usage. This is typically the starting point for web developers to ascertain and test their API data request calls. It enables you to understand how the query string is built and the necessary feed parameter syntax, and it is a sanity check on the results the API call returns.
Figure 12-4: Example Report Query Builder
There is a great deal more to the Google Analytics Core Reporting API, and I have covered only the foundations here. An entire book can easily be dedicated to its use. However, my intention is to whet your appetite so that you can further explore its possibilities. Once you understand the principles involved, a good reference place is the API Client Libraries & Sample Code found at
http://code.google.com/apis/analytics/docs/gdata/gdataLibraries.html
The API is still a beta product (referred to as “Labs” by Google), and so exact syntax is still fluid. Refer to the Google Code site as necessary: http://code.google.com/apis/analytics.
In summary, the Core Reporting API provides the opportunity for anyone to be innovative and creative with web visitor data. Often web measurement is considered a dry subject, which it certainly can be. Features such as motion charts, described in Chapter 5, “Reports Explained,” go some way in improving the situation, but even Google cannot think of everything. The Google Analytics Core Reporting API is your chance to change that. Don’t be afraid of experimenting—applying a little lateral thinking and imagination can even surprise Google!
API Quota Policy
There is currently a quota policy in place to protect the robustness of the API system. When you create and register a new project in the Google APIs Console, you are given a unique client ID to identify each application under that project. Note that all the applications under a single project share any per project limits. For unregistered applications, Google provides a very low grace quota to accommodate a small amount of testing.
General Analytics API quotas
These apply to both the Management API and Core Reporting API.
- 50,000 requests per project per day
- 10 queries per second (QPS) per IP
Quotas specific to the Core Reporting API
- 10,000 requests per profile per day
- 10 concurrent requests per profile
When an account has exceeded its quota, an authorized request for a feed results in an HTTP 503 (Service Unavailable) response, with a message in the body of the response indicating that the specific account has insufficient quota to proceed.
Example Apps
The following are example applications of cool things people are doing with the Google Analytics Core Reporting API. Most of these are freely available or operate on a freemium basis (free with upgrade options). The ones listed here are those that I have personally used and found to be particularly creative and innovative. A more complete list of over one hundred API apps is found at www.google.com/analytics/apps/. Those marked with an asterisk (*) are presented in the next section as case studies written in conjunction with the original developers.
Note: From a security, data privacy, and credibility viewpoint, only use third-party API applications that authenticate your Google Analytics account either with AuthSub or OAuth authorization. This ensures that your login details cannot be revealed to the application or any third party. If you are building your own app, or the app is a download that you have complete trust in and works only on your computer, the ClientLogin authorization method is fine. If in doubt, ask the developers directly. The authentication techniques used by applications listed in this book have not been verified.
Excel and Google spreadsheets
*AutomateAnalytics.com is a suite of macro functions for Microsoft Excel and Google Spreadsheets. The functions allow you to import your Google Analytics data into Excel or Google Spreadsheets via the Core Reporting API. This allows you to, for example, automatically refresh KPI tables and expand on the visualization options offered within Google Analytics. As an alternative to plug-ins, it is virtually version independent, can operate faster, and allows the end user to experiment with modifications. Further information is available at http://awm.automateanalytics.com.
Tatvic uses an alternative plug-in approach to import Google Analytics data into Excel. The tool comes with a three-step wizard to simplify the process and works on Windows XP and above with Microsoft Office 2003 onward. Further information is available at www.gaexcelplugin.tatvic.com.
Excellent Analytics is an alternative free, open-source, plug-in for Excel 2007 and later running on Windows. Designed with ordinary analysts, marketers, and salespeople in mind, it requires the minimum amount of technical knowledge to use. Further information is available at http://excellentanalytics.com.
Survey tools
*Kampyle is an online feedback analytics platform that allows website owners to create their own advanced, branded, and customized feedback forms and put them on their websites. When it’s integrated with the Google Analytics Core Reporting API, visitor feedback information is combined with Google Analytics geographic, visitor-loyalty, exit-page, and landing-page information. The result provides a more holistic picture of website performance—combining the “what” with the “why.” Further information is available at www.kampyle.com/page/website-feedback-google-analytics.
Custom apps
Youcalc connects to the Google Analytics Core Reporting API to provide custom analytics applications that run in iGoogle, the iPhone, intranets, and blogs—pretty much anywhere. The applications allow you to access and analyze live Google Analytics data without opening Google Analytics. You can build custom applications on live data without coding, and mesh data from AdWords or salesforce.com into one analytics application. Further information is available at www.youcalc.com/solutions/webanalytics.
ShufflePoint integrates Google Analytics with Microsoft Excel, PowerPoint, and Google Gadgets using its own powerful query language (GAQL) and a drag-and-drop query builder. Within Excel, you can associate web queries with spreadsheet ranges with refreshable GAQL queries—no add-ins or macros required. Similarly, for PowerPoint you can associate slide placeholders with GAQL queries. By using iGoogle, you can build your own Google Analytics dashboard. The ShufflePoint approach is encapsulated as “design once, refresh automatically.” Further information is available at www.shufflepoint.com.
Bime is a powerful business intelligence (BI), data visualization tool provided as a software-as-a-service application. It provides a Google Analytics connector that allows you to retrieve, analyze, and visualize your analytics data using the Bime computing engine. Further information is available at www.bimeanalytics.com/solution/web-analytics.
Publishing
Google Analyticator automatically adds Google Analytics tracking to a WordPress-powered blog without the user needing to modify their website code. It comes with a customizable widget that can be used to display specific information gathered by Google Analytics. It supports all of the tracking mechanisms that Google Analytics supports, such as external link tracking, download tracking, tracking without counting administrative users, and any other advanced tracking the user wishes to add. Further information is available at http://wordpress.org/extend/plugins/google-analyticator/
pimcore is an advanced, open-source content-management system (CMS). It is used for creating and managing digital content, assets, and structured objects. With a strong online marketing focus, Google Analytics, Website Optimizer, and Webmaster Tools are integrated in to the CMS back end for centralized use. Further information is available at www.pimcore.org.
Data visualization
GAVisual is an innovative path visualization tool that allows you to understand the path people take through your site in an easy-to-follow and interactive format (for example, 21 percent of people who viewed page A went on to view page B, followed by page N, and so forth). Further information is available at http://gavisual.info.
Trendly is a monitoring and visualization tool that enables you to easily see what’s changed in your Google Analytics data. Trendly uses mathematical models to take noisy data and figure out when significant changes have happened. It prepares a news feed with attractive charts that put the changes into perspective relative to everything else that’s going on. Further information is available at http://trendly.com.
Email marketing
MailChimp’s Analytics360 tool allows you to track the ROI of email marketing campaigns. Integration with Google Analytics gives a detailed report that shows how much revenue each campaign generates as customers click from email to website and make purchases. Email campaign reports include completed goals, value per transaction, and total ROI. Further information is available at www.mailchimp.com/features/google-analytics.
Search marketing
WordStream is a keyword-management solution that provides search marketers with integrated keyword tools for discovering, researching, analyzing, organizing, prioritizing, and acting on keyword data within their PPC and SEO campaigns. The latest version of WordStream integrates with both Google AdWords and Google Analytics. It automatically augments your existing keyword research every day with new, highly relevant keyword opportunities. WordStream also integrates your Google Analytics goal-tracking data so you can build on your initial keyword list and better understand which keyword niches are actually working (or not) on your site. Further information is available at www.wordstream.com/blog/ws/2009/11/10/future-keyword-research.
Benchmarking
SeeTheStats allows you to publish your Google Analytics data publicly—without the need for users to authenticate. Why do this? SeeTheStats is aimed at publishers wishing to be transparent to their advertisers. That is, you can view traffic levels before you purchase an ad. You can also search for other participating websites and view their traffic for comparison. Further information is available at www.seethestats.com.
The following case studies were provided by the creators of the solutions in question—all of whom are cited—and edited by me.
Excel and Spreadsheet Integration
While Google Analytics offers a wide range of possibilities for reporting, there are many situations where additional analysis needs to be conducted elsewhere. These situations include analyzing multiple metrics and dimensions at once, merging Google Analytics metrics with data from other sources, and simultaneously analyzing a large number of accounts and profiles. For the majority of people, the most convenient platform for this kind of additional analysis is Microsoft Excel or Google Spreadsheets.
There are several ways of importing data from Google Analytics into Excel. Most obvious is the Google Analytics built-in Excel export. However, this process has to be done manually for each report set and profile. Following the introduction of the Core Reporting API, several solutions have been developed that involve installing Excel plug-ins. Mikael Thuneberg has developed an alternative approach.
Thuneberg’s alternative method is to attach code containing custom functions directly to a spreadsheet. These functions use the spreadsheet’s native scripting languages—Visual Basic for Applications (VBA) for Excel and Google Apps Script for Google Spreadsheets—though for both the code is hidden to the end user (in fact not required by end users). This method allows the functions to be used in the workbook just as any other of the spreadsheet’s built-in functions, such as SUM, AVERAGE, and COUNT. Reports can also easily be shared with other Excel users or Google Spreadsheets users, who can refresh their data or modify queries without the need to install anything.
The Excel version of this solution works in Microsoft Office for Windows versions 2003 and later (the commercial, that is, paid-for version also supports Excel on Mac OS X). You’ll need to enable macros in the application settings. While using the functions is naturally easiest and most convenient in Excel, they also work in other Microsoft Office applications. Therefore, with some programming skills, it is also possible to create PowerPoint presentations that are always up-to-date or to import Google Analytics data into an Access database.
Instructions for Working with the Functions
Basic spreadsheet skills are required to use the Thuneberg functions—no knowledge of VBA or Google Apps Script is needed. You will of course need to learn the various data feed parameters for use with the functions, as shown in the section “Report Query Builder” earlier in this chapter, and how to input array formulas in Excel—that is, formulas that fill more than one cell simultaneously, as described next.
Template Downloads
Download the template files containing the functions referred to in this section (for free) from http://awm.automateanalytics.com.
The file GA_data_fetch.xls contains an area for you to experiment with using different API requests—as explained in the Usage Examples section. The file HourReport.xls is a working example you can use straight away to day-part your report data, that is, compare Mondays with Mondays, Tuesdays with Tuesdays, and so on. That is both a simple and powerful function, and it is something the Google Analytics user interface cannot do yet.
The template file, GA_data_fetch.xls, has the necessary code already attached, so after enabling macros when the file opens within Excel, you can use it straight away. You can also view examples of the functions in use from within the file.
To use the functions, the first thing you need to do is to authenticate with Google Analytics. Here is how to do the authentication in Excel using the getGAauthenticationToken function. This function uses the ClientLogin method to authenticate with Google. Note that because you are running the template file within your own software, Excel, and not sharing it via a third-party server, the authentication method (ClientLogin) is correct for this application. To use this function, type the following into a spreadsheet cell:
=getGAauthenticationToken ("email","password")
The two parameters are your email address and password (within double quotes) to log in to your Google Analytics account. This function returns the authentication token. This has been done for you in cell D25. Note that double quotes are not required when grabbing the username and password via a cell reference, for example, D14 and D15.
For importing data, use the getGAdata function to generate a report query by typing the following into a cell:
=getGAdata(token,profile number,metrics,start date,end date,filters,↵
dimensions,sort)
The following list describes the fields used (left to right):
token Type the address of the cell where you have typed the authentication function. Note that in the Google Spreadsheets version, this is not used because the authentication process differs from Excel.
profile number Type the ID number of the profile from which you want data. You can obtain this from your Google Analytics admin area.
metrics Type the metrics you want to fetch, for example, visits or visits&pageviews.
start date and end date Type the start and end dates of the period from which you want data. Typing dates can be cumbersome because of the various date formats. The easiest way is to write the dates in separate cells and put references to those cells here.
filters (optional) If you want to include, for example, US visits only, type country==United States. If this field is left blank, data for all visits is fetched.
dimensions (optional) If you want to split the data by traffic source and medium, for example, type source&medium. If this field is left blank, the function fetches the site totals.
sort (optional) By default, the results are shown in alphabetical order. If you’d rather sort by the metric, type TRUE here.
The getGAdata function makes a report query through the Google Analytics Core Reporting API and returns the data to the spreadsheet. If you have included just one metric and have not included any dimensions, then you can simply write this function to a single cell and the function will return the value to that one cell—this is shown in cell Z25 of GA_data_fetch.xls. If you have used multiple metrics or included dimensions, the results will not fit into a single cell. Therefore, you need to input the function as an array formula. While Google Docs does this for you automatically, in Excel you need to follow these steps:
1. Select a range of cells.
2. Click the formula bar and write the function there.
3. Press Ctrl+Shift+Enter (simultaneously) on Windows or Cmd+Shift+Enter if using a Mac.
The function will now fill the range of cells with the query results. This is shown in the cell range AG25–AJ35 of GA_data_fetch.xls.
Usage Examples
The use cases for these functions range from ad hoc analysis to elaborate dashboards that integrate data from Google Analytics and other sources. Here are some examples of common situations where the functions can help:
Custom dashboards As discussed in Chapter 10, “Focusing on Key Performance Indicators,” it is not realistic to expect senior managers or executives to log in to Google Analytics directly. Therefore, building a custom dashboard in a spreadsheet that automatically refreshes itself can be of enormous benefit. The dashboard can easily be shared throughout an organization because it does not require additional installs to be able to use it.
Merging data from multiple profiles Google Analytics currently cannot easily compare or sum metrics from different profiles—unless you open multiple browser windows or use the roll-up reporting method described in Chapter 6. These functions allow you to automate this by typing the ID numbers of the profiles into one column and getGAdata functions pointing to those profile numbers into another column.
Merging Google Analytics metrics with other data As an example, perhaps you know the cost of email marketing and would like to calculate the cost per visit from email for your site. Currently Google Analytics imports cost data only from AdWords and AdSense. However, by merging Google Analytics email visit data with data from your email marketing tool, this calculation becomes straightforward. You can calculate the return on investment for your email marketing right down to a per-campaign basis.
Innovative visualization methods By importing data into a spreadsheet, you can take advantage of its wide range of visualization features. One advanced example of using the functions is shown next.
Innovative Visualization Methods
While Google Analytics users with very basic Excel skills can get great value from using the functions to automate data importing, people with more advanced skills can use them to make advanced reporting applications. For example, Mikael Thuneberg has created an application that illustrates how different Google Analytics metrics change over time, so you can quickly get a comprehensive view of how a site’s traffic, usage, and sales are developing. Figure 12-5 shows how the country breakdown of traffic to a website has varied.
Figure 12-5: A visualization of Google Analytics data using Excel and the export API

The purpose of this example is to show that with some basic Excel and VBA skills, it is possible to quickly create valuable reporting applications using these spreadsheet functions. Excel includes a wide range of data illustration and analysis features that can be accessed programmatically.
Survey Tools: Voice of Customer Integration
Kampyle (www.kampyle.com) is an online feedback analytics platform that allows website owners to create their own advanced branded and customized feedback forms and put them on their sites for the benefit of their users. Website visitors can quickly and simply submit their feedback with a general grade, feedback category, subcategory, text description, and the contact details. Visitors access the feedback form through the use of a noninvasive feedback button, which can be placed in various locations on the web page.
Once visitors submit feedback, it is processed to provide a high-level management view of the data and its context. Through advanced, automated analysis, the Kampyle dashboard helps website owners get the overview and perspective needed to improve their site. The system provides the qualitative “why” visitors do what they do, to complement the “what” and “when” provided by web analytics tools such as Google Analytics. Clearly, integrating Kampyle feedback data with Google Analytics provides a more complete picture of website performance.
The Integration Approach
By using the Google Analytics Core Reporting API, a fuller, more intelligent integration of data coming from two different sources—Kampyle feedback surveys and Google Analytics visit data—is achieved. It provides the freedom to use smart business logic to supply greater insights and display combined data in the most effective way possible. Using the Core Reporting API, data can be manipulated from both sources to create intelligent reports and alerts that would let website owners know when something requires their attention.
The Kampyle system queries the client’s Google Analytics information once per day. Reports on geographic distribution information, visitor loyalty, top exit pages, and top landing pages are incorporated into the Kampyle feedback data. An example of this is shown in Figure 12-6.
Top exit and landing pages hold special importance for website owners because they are where users first arrive and where they leave from. Information on these pages can be invaluable for a website owner’s efforts to bring users to the website and keep them there for as long as possible (or necessary). Google Analytics is responsible for identifying the pages to which most visitors first arrive at the site (landing pages) and the pages from which most users leave a site (exit pages). For each of these pages, Kampyle can tell a website owner the average feedback grade as well as the most reported issue. A simple drill-down procedure then allows the website owner to review all the feedback received on a specific landing or exit page.
Figure 12-6: Integrated landing page data from Google Analytics and Kampyle feedback

Demographics within Google Analytics
Demographics are the characteristics of a population, in this case website visitors. Common demographics include gender, race, age, disabilities, mobility, home ownership, employment status, income level, and so forth. Having read this far into the book, you will know that Google Analytics shows visitor reports in anonymous and aggregate form. That means no personally identifiable information is collected and that data is grouped rather than presented on a per-visitor basis (see Chapter 2 and Chapter 3 for more reading on this). This is a best-practice approach for end-user privacy and is the law in many parts of the world. However, also knowing anonymous, aggregate demographic information of your visitors can be very insightful for page and campaign optimization.
For example, having demographic information can help you answer the following questions:
- What is the gender distribution of visitors to my site?
- How do different age groups convert?
- What demographic target groups are spending the most money on my site?
- How does a visitor’s education level affect engagement?
Because Google Analytics doesn’t have demographic information available to it, a third-party integration tool is required. UserReport is one such tool (www.userreport.com).
UserReport is a usability survey tool that allows you to augment its default set of questions with your own survey. By deploying a few lines of JavaScript code on your site, you can invite visitors to participate in a survey. If a visitor agrees, a fixed set of usability questions are asked in a pop-over window: Is this website easy to navigate? Is the information logically organized? Is the information useful and up-to-date? In addition, demographic questions are asked: Are you male or female? What is your age? Are you employed or not? What is your education level? These questions are fixed, that is, they show to every participating visitor and cannot be edited. If you wish, you can then display your own set of survey questions.
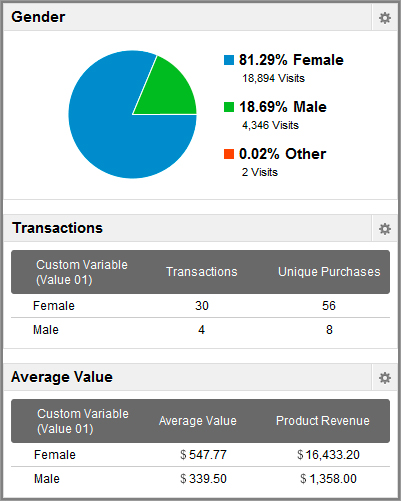
UserReport does have its own reporting suite for you to analyze participant responses. However, the clever approach that has been adopted is to integrate survey data with Google Analytics by using custom variables. The use of custom variables is the technique used to label your visitors in Google Analytics and is detailed in “Labeling Visitors, Sessions and Pages” in Chapter 9, “Google Analytics Customizations.” Essentially, UserReport allows you to import your visitors’ demographic information from your survey into your Google Analytics account by assigning the demographic values captured to Google Analytics custom variables. Only anonymous demographic information is transferred. The result is the ability to tie visitor demographics to your website performance. An example dashboard is shown in Figure 12-7.
Figure 12-7: Demographic data integrated into a Google Analytics dashboard
Call Tracking with Google Analytics
Telephone calls are still an important call to action for a nontransactional commercial website. This is particularly so when an ID is required before a sale can be completed, such as, for example, within the finance industry. However, this contact point is rarely tracked, and even when it is, the data is often siloed and not part of the web analytics reports, where it can be compared against other forms of lead generation. Recently a number of vendors have started to address this issue by integrating call tracking with web analytics tools—most notably, Google Analytics.
The following system and process information was provided by Infinity Tracking Ltd., reproduced here with permission, with thanks to Paul Walsh (www.infinity-tracking.com/awm). The following summarizes its methodology.
The Infinity system tracks visitors who place a call after viewing your web pages. It achieves this by first capturing and then resending the original Google Analytics uniqueID (visitor ID) back to Google Analytics as a virtual pageview request when the call is made (routed through Infinity’s call management servers). Each call received can then be tracked back to specific visitor activity—for example, search engine keywords from organic or paid search campaigns.
Because the same visitor ID is used for the virtual pageview call, duplicate visits are not generated, and the session appears continuous as far as Google Analytics is concerned. The virtual pageview technique is discussed in “_trackPagview: the Google Analytics Workhorse” in Chapter 7, “Advanced Implementation.” The Infinity methodology is as follows:
- A JavaScript code snippet is pasted onto all pages.
- The phone number displayed on your site needs to be text (not an image), with an HTML class surrounding the number so that the Infinity code can change it dynamically—for example, <h2 class="infinity">1-800-123-4567</h2>.
- When a visitor lands on your site, the Infinity JavaScript waits until the Google Analytics uniqueID is available in the __utma cookie and then performs an API request to the Infinity Number Allocation Service (NAS).
- A new Infinity visitor ID number is generated and stored as a cookie along with the visitor’s referral source and Google Analytics uniqueID.
- The NAS allocates a unique tracking phone number from a pool to the visitor ID, returns it to the visitor’s browser for display on the page they are viewing, and logs the time of the pageview along with the phone number allocated. The unique phone number lasts the duration of the visit and for 30 minutes after (approximately 99 percent accurate at matching calls back to the visitor).
- The JavaScript code performs a find and replace in the HTML to dynamically replace the static phone number with the unique tracking phone number.
- When the phone number is called, Infinity’s call servers log the call information and perform a look-back to see who was the last visitor ID to be allocated that number.
- For each phone call received, the Infinity service generates a virtual pageview request to Google Analytics using the referral source and medium of that visitor’s landing page and the original Google Analytics uniqueID.
Sample results of what call tracking looks like in your Google Analytics account are shown in Figure 12-8.
Other Call Tracking Vendors
In addition to Infinity Tracking, which operates in the United States, the UK, and Canada, other Google Analytics phone-tracking solutions exist from vendors:
ClickPath (US)
Mongoose Metrics LLC (US)
www.mongoosemetrics.com/solutions-web-analytics.php
AdCallTracker (UK)
Calltracks (UK)
AdInsight (UK)
ifbyphone.com (US)
http://public.ifbyphone.com/services/google-analytics-call-tracking
CallTrackID (UK)
www.freshegg.com/call-track-id.htm
As yet, no global provider exists for this approach, that is, one that can provide telephone numbers for multiple countries and integrate them with Google Analytics.
Figure 12-8: Call tracking data showing which referral sources and mediums led to a phone call
Video on Demand Tracking with Google Analytics
Video on Demand (VoD) systems allow users to select and watch video when they wish, as opposed to scheduled TV. In the United States, such systems are popular with cable TV operators because they have the necessary bandwidth to provide fast network access to their content. Given the expensive and nascent interactive cable TV capabilities, the challenge for a client using VoD, that is, the TV advertiser, is measuring the success of such offline campaigns.
The following case study was provided by iDimension (www.idimension.com), a US Google Analytics Certified Partner, and Liquidus (http://liquidus.net), a producer of commercial video ads for TV advertisers. With thanks to John Babb of iDimension.
Note: Tracking offline marketing, including TV, is discussed in Chapter 11, “Real-World Tasks.”
For this example, the TV advertiser is a global employment provider wishing to serve job opportunity videos on demand via cable TV in markets all over the United States. The cable TV operator was able to report video viewing activity but unable to track the call to action—the completion of an online job application form.
The solution was to present a unique job code at the end of each video, with a call to action to send a text message (SMS) with the unique job code to a mobile short code for more information. Sending that text message generated an automatic reply text to the candidate with a short URL to a full job description and online application form. Google Analytics allowed for the cost-effective recording and reporting of these interactions. The process is described in full next and is illustrated with a schematic flow chart in Figure 12-9.
Figure 12-9: Schematic flow chart illustrating the tracking process for Video on Demand

The SMS message sent by the candidate in response to the call to action triggers sending virtual pageview A to Google Analytics. The data recorded in this virtual pageview references all of the job details for the job code in the video and confirms the delivery of the SMS message by the candidate. Additionally, the mobile number of the candidate is translated into the city and state related to the area code and recorded relative to the job code using Google Analytics custom variables. Note that the mobile number itself is not stored, per Google Analytics terms of use regarding personally identifiable information.
If the candidate clicks the short URL in the automatic reply SMS message, they browse to an intermediate web page and virtual pageview B is sent to Google Analytics before routing the visitor to the job application form hosted on a third-party site (Monster.com). The data recorded in this virtual pageview references all of the job details for the job code in the video and confirms the click of the short URL by the candidate. Figure 12-10 shows the results in Google Analytics.
Figure 12-10: Video on Demand report showing the calls to action as virtual pageviews

The report shown in Figure 12-10 allowed the video ad producer to demonstrate to their advertising client the actual impact of VoD employment opportunities relative to the market viewing activity reported by the cable TV operators.
The Google Analytics reports show which job codes in which markets are generating text messages by candidates. In addition, they report the number of clicks to view job applications and ultimately job application submissions. The custom variable technique allows for supplemental reporting of the mobile city and state of the job candidate against the location of their job of interest. This provides an understanding of the distances candidates are prepared to travel or move for a job.
Note: You may have noticed that the VoD technique described here does not create or maintain a Google Analytics uniqueID (the visitor’s ID number). Hence, the two virtual pageview calls to capture data from the external sources (SMS sent and short URL clicked on) are reported as two new unique visitors in Google Analytics, which of course they are not. Compared to the challenge of tracking VoD, this is a minor point. However, for completeness, a separate profile should be used for this data.
Mobile App Tracking with Google Analytics
An app is a lightweight application tailored to a device’s form factor and input-output interfaces (such as a keypad, touchpad, remote control, or display). In many cases, apps are replacing browsers as a way of connecting to the Internet and interacting with content. Initially, the growth in app usage was driven by the phenomenal success of the iPhone—some 350,000 apps were available at the iPhone App Store as of May 2011. These days, Android devices and iPads are adding to this growth—BusinessInsider.com reported that the Andriod market hit 250,000+ apps in March 2011. With so many apps available and so much usage of them (see the sidebar “How Today’s Mobile Consumers Access Content”), it is becoming increasingly important to track and understand how users interact with mobile applications—beyond standard application downloads.
How Today’s Mobile Consumers Access Content
There are two ways mobile users access online content—using a web browser or via apps. According the comScore 2010 Mobile Year in Review, even though apps receive more media attention, the distribution of usage is split fairly evenly. For example, 36 percent of mobile-phone-using Americans and 29 percent of Europeans browsed the mobile web in December 2010, while app access reached 34 percent and 28 percent respectively.
According to the AdMob February 2010 Survey, Android and iPhone users spend 79 to 80 minutes per day using apps and download approximately nine new apps per month (eight for free, one paid for).
According to mobile analytics provider Flurry Analytics World Fact Book, 33 percent (17.2 million) of the entire UK population over 13 years of age used a mobile app in May 2011.
While tracking a visitor who has come to your website via a mobile browser is no different from tracking one who has come from a regular browser, the challenge of tracking app usage is that they do not render HTML pages. You therefore cannot simply add the GATC to an app “page” and collect visitor data. Instead, virtual pageviews or events are coded into the app using one of the Google Analytics software development kits (SDKs). Two versions of the SDK are available—for Android and Apple iOS devices—and they currently support the following features:
- Pageview tracking
- Event tracking
- E-commerce tracking
- Custom variables
Note: Google Analytics SDKs are available for Android and Apple iOS from http://code.google.com/mobile/analytics/docs/.
The following case study was provided by Hanson Inc. (www.hansoninc.com), a US Google Analytics Certified Partner, and Merillat (www.merillat.com), a producer of kitchen cabinets. With thanks to James Bake of Hanson Inc.
Merillat, one of the largest kitchen cabinet manufacturers in the United States, positions itself as being both fun and functional. As part of its brand positioning, Merillat developed a mobile application to assist the kitchen user—the Merillat Kitchen Helper app. The purpose of the app is to help you easily find ingredient substitutions for commonly used items without leaving the kitchen! The Search by Category interface lets you find substitutions, adjust amounts, and save items you commonly use to your favorites. See Figure 12-11.
Figure 12-11: The Merillat Kitchen Helper App uses Google Analytics to track usage and engagement.

As part of the process for developing this app, a key requirement was being able to track the value of the investment in building it. For example, in addition to basic metrics such as number of visits, session length, bounce rate, and unique visitors, it was especially important to also understand user interaction—that is, users’ selections of the Ingredient Substitution and Measurement Conversion tools from the main screen as well as corresponding interactions within each specific tool. The developers used the Google Analytics SDK for iOS to achieve this.
The Google Analytics SDK for iOS provides a complete solution for interacting with Google Analytics from iPhone, iPad, or iPod Touch applications. The SDK aligns to the startup to shutdown life cycle of an app. Once the initialization is complete, single method calls placed throughout the app track pageviews or events, as described next.
Initializing the Google Analytics tracker is a straightforward matter of using the sharedTracker function. This is placed in the UIApplicationDelegate, didFinishLaunchingWithOptions: method, providing your account ID and a dispatch period. The dispatch period is the time between connections to Google Analytics servers. Batching data hits together conserves battery life and connection time. Worth noting is that all tracking calls made while the user is offline are batched and released when connectivity is available. For the Merillat Kitchen Helper app, it was decided to dispatch batches every 30 seconds. An example of the initialization, written in Objective-C, is shown here:
#define kGANAccountId @"UA-XXXXXXXXX-X"
#define kGANDispatchPeriodSec 30

- (BOOL)application:(UIApplication *)application↵
didFinishLaunchingWithOptions:(NSDictionary *)launchOptions {

// Override point for customization after application launch.

// Start the GA tracker
[[GANTracker sharedTracker] startTrackerWithAccountID:kGANAccountId↵
dispatchPeriod:kGANDispatchPeriodSec↵
delegate:nil];

//remaining code...

return YES;
}
For this app, all tracking was achieved using the trackEvent method.
In the proceeding example the event is triggered when a user touches a UIButton to save an ingredient substitution to their favorites list. The label parameter is the name of the ingredient, allowing Merillat to review the most popular ingredients selected in the app:
NSLog(@"GA: Save Ingredient to Favorites");
NSError *error;
if (![[GANTracker sharedTracker] trackEvent:@"Save Ingredient to Favorites"↵
                                     action:@"Saved"
                                      label:ingredient.Name
                                      value:-1
                                  withError:&error]) {
    NSLog(@"GA Error: %@", error);
}
Most of the events tracked in the Kitchen Helper app are triggered when the user touches a UIButton. These include converting units of measurement, conducting searches for ingredients, and performing ingredient substitutions. For temperature conversion, the user drags a UISlider that constantly updates values displayed on the screen. The event for this is triggered when the view containing the slider is loaded.
A dashboard performance report for the app is shown in Figure 12-12. As a result of the custom modifications to the Google Analytics SDK, Merillat is able to review the number of app interactions and the level of engagement—such as tool selection (Ingredient Substitution versus Measurement Conversion) and top substitutions. A potential future enhancement is to compare metrics with its website as a whole, particularly geolocation information, to understand if there is a correlation between potential customers to the store and app usage.
Figure 12-12: The Merillat Kitchen Helper app used Google Analytics to track usage and engagement.

Integrating Website Optimizer with Google Analytics
An introduction to Google Website Optimizer is provided in Chapter 11, “Real-World Tasks,” along with two case studies that show how, by testing alternatives, you can quickly optimize a page for better conversions—without guesswork; that is, using your visitors and customers as experiments. Ensure that you are familiar with the terminology and methods described in Chapter 11 before reading this section.
While Website Optimizer is a great page-testing tool on its own, it may not have escaped your attention that results are very black and white. That is, a conversion either happens or it doesn’t—the alternative headlines, layouts, images, and so on that produce the greatest uplift in conversion are considered the winner. There is no halfway house. But what if your conversion metric is not so clear-cut? For example, maybe your test objective is to reduce a page’s bounce rate, increase a visitor’s time on page, or increase its $ Index value. For this, you need to integrate Website Optimizer with Google Analytics and bring in the additional metrics that Google Analytics has to offer.
Following is a summary of benefits when integrating Google Analytics with Website Optimizer:
- With Google Analytics, additional metrics become available for your test analysis, such as bounce rate, time on page, time on site, and revenue.
- You can segment data in any way available to Google Analytics, such as, for example, a breakdown of test visits and conversions based on source or medium or a breakdown based on visitor type (new or returning visitor). Website Optimizer currently has no segmenting abilities.
- You can measure additional conversion goals. Maybe the test you are running involves more than the single conversion defined in your Website Optimizer account. Google Analytics has the ability to measure up to 20 different goals.
- You are able to view the number of test visits or conversions for any time frame, such as, for example, what happened last month versus this month. On its own, Website Optimizer considers visits from when the experiment is created, with no time-frame comparison.
The listed benefits are particularly helpful when you wish to test both micro-conversions and macro-conversions. Micro-conversions are the individual funnel steps that lead to a macro-conversion. For example, a micro-conversion could be how many people add a product to their shopping cart, how many of these go on to the next funnel step—your delivery details page, for example—and so forth. The macro-conversion for this process is how many people complete the checkout process, that is, become customers. Nontransactional sites work in the same way if they have funnel steps prior to reaching a goal conversion, such as, for example, subscription sign-up or contact form completion.
If you use Website Optimizer in isolation, then you have to choose which one of these actions is defined as the test conversion and used as the benchmark for experiment success. By definition, if both micro- and macro-conversions are important, you would need to create two or more experiments. Unless you have very high traffic levels, a macro-conversion with many alternatives to test may take several months to produce statistically significant results. The advantage of combining with Google Analytics is that you can measure both the micro-conversion (add to cart) and the macro-conversion (make a purchase) simultaneously. This allows you to quickly identify alternatives that are underperforming and stop serving them—even before you have enough data on the macro-conversion for that alternative.
The Integration Method
When using Website Optimizer, you need to address two issues in order to integrate with Google Analytics:
- Generate a unique tracking URL for each test variation so alternatives can be analyzed in Google Analytics—using a separate profile.
- Tidy up Google Analytics reports so existing profile data tracks all test variations as a single page.
As you can see, the second point appears to contradict the first. However, the purpose is to first separate out the different Website Optimizer test combinations for analysis. This detail is not required in your main Google Analytics profile. Therefore, in order to maintain report simplicity, alternative test URLs are recombined in your main profile so that you receive an aggregate report for the single test page.
The approach adopted is to insert your Website Optimizer variation number into the Google Analytics tracking call. Note that you should employ this technique only when running multivariate tests. It is not required if you are running an A/B split test (or A/B/C/D ...) because each alternative already has its own unique URL.
Further Details on This Approach
This technique is discussed in The Techie Guide to Google Website Optimizer, coauthored by Ophir Prusak at
www.google.com/websiteoptimizer/techieguide.pdf
and as a blog post at
www.roirevolution.com/blog/2008/05/using-website-optimizer-with-google-analytics-new.php
Thanks go to Jeremy Aube of ROI Revolution for help with updating this section. Credit for coding examples goes to Eric Vasilik at
www.gwotricks.com/2009/02/poor-mans-gwoanalytics-integration.html
Generating Unique URLs for Each Multivariate Test
Website Optimizer utilizes two cookies to manage test experiments: __utmx and __utmxx. By querying the value of __utmx, you can obtain the value identifying the test combination. For example, consider a page under multivariate test with three test sections. Section 1 has three alternatives including the original, section 2 has four alternatives, and section 3 has two alternatives. That’s a total of 24 combinations being tested (3 × 4 × 2). When you use the JavaScript function utmx("combination_string"), a string is returned corresponding to the combination displayed to the user, such as “0-3-1.” In this example, that represents the original variation for the first section, the third test alternative in section 2, and the first test alternative in section 3. Note that the original variation of a test is always represented as combination 0.
With this knowledge, modify the Google Analytics _trackPageview call within the GATC of the test page as follows:
<script type="text/javascript">
var _gaq = _gaq || [];
_gaq.push(['_setAccount', 'UA-12345-1']);
(function(){try {
 var l = document.location, s = l.search;
 if (utmx('combination_string') != undefined) {
  s = s +(s.length ? '&' : '?') +'combo=' +utmx('combination_string'),
  s += '&testname= button-test-3';
  // the testname variable is to allow you to easily filter out
  // a specific experiment. Change this to your experiment name
  // defined in Website Optimizer
 }
 _gaq.push(['_trackPageview', l.pathname + s]);
""}catch(err){}})();
  (function() {
    var ga = document.createElement('script'), ga.type = ↵
'text/javascript'; ga.async = true;
    ga.src = ('https:' == document.location.protocol ? ↵
'https://ssl' : 'http://www') + '.google-analytics.com/ga.js';
    var s = document.getElementsByTagName('script')[0]; s.parentNode.insertBefore(ga, s);
  })();
</script>
Viewing Test Alternatives in Google Analytics
The side effect of having each test combination tracked using a unique URL is that multiple pages (each test combination) are reported in Google Analytics, such as in this example:
/test-page.html?combo=0-0-1&testname=button-test-3
/test-page.html?combo=0-1-2&testname=button-test-3
/test-page.html?combo=1-0-2&testname=button-test-3
This, of course, is visit data for a single page: test-page.html. To avoid confusion in your main Google Analytics profile, track your Website Optimizer test data in a separate Google Analytics profile and modify your main profile so all combinations are reported as a single page. To achieve this, create a new, carbon-copy profile in your Google Analytics account—see Chapter 8 for details on how to create additional profiles. When this is in place, no other change is necessary—by default each of your test page alternatives will be tracked separately for you to analyze in your new profile, as shown in Figure 12-13.
Figure 12-13: Website Optimizer test alternatives tracked in a separate Google Analytics profile
Tip: In your new profile, if you have goals, filters, or segments that use test-page.html, ensure that they don’t break. For example, if your goal includes test-page.html, do not use Exact Match as the goal match type. Instead use Head Match because this will trigger a goal for test-page.html?combo=1&testname=button-test-3 as well as other combinations.
To combine all combinations and report them as a single page in your main profile, use the Google Analytics Exclude URL Query Parameters functionality. If you have used the example code presented so far, your original and test page alternatives differ only by the combo and testname parameters. Hence, add these to the list of parameters to ignore in your main profile—see Figure 12-14.
Figure 12-14: Ignoring Website Optimizer test parameters in Google Analytics

In Chapter 12, you have learned the following:
How to extract Google Analytics cookie information You have learned to use JavaScript or PHP to query and extract information from Google Analytics cookies.
How to use the Google Analytics export API You have an overview of how to use the API and its capabilities.
What Example API solutions are available You have seen some of the clever enhancements and tools third parties are developing to augment and enhance Google Analytics data.
How to track visitors who call You know how to track visitors where the website call to action is to make a phone call.
How to integrate demographic data You learned how to combine Google Analytics with visitor demographic information from surveys.
How to track offline activity You saw an innovative way to measure the success of a TV video on demand service.
How to track apps You saw how to use the Google Analytics SDK to monitor mobile app usage and engagement.
How to integrate Website Optimizer with Google Analytics You have learned how to combine the testing capabilities of Google Website Optimizer for conversion optimization with other metrics that Google Analytics provides.