
Chapter 11
Real-World Tasks
By now you may find your eyes glazing over at the scale of the project you have undertaken. However, Google Analytics is one of the easiest web analytics tools to configure, use, and understand. This chapter includes real-world examples of tasks most web analysts regularly need to perform. By presenting them, I hope to demystify the complexities of web analytics. As long as you dedicate the time and resources, you will find that this isn’t rocket science. Even better, you will have a profound impact on the performance of your organization’s website.
The tasks presented here are not intended to be an exhaustive or definitive list; rather, their purpose is help you obtain useful information you can act on. Acting on your data is the single most important aspect of web analytics, yet it is this aspect that most people stumble with.
In Chapter 11, you will learn:
- To identify and optimize poor-performing pages
- To measure the success of internal site search
- To optimize your search engine marketing
- To monetize a non-e-commerce website
- To track offline marketing
- To use Website Optimizer
Identify and Optimize Poor-Performing Pages
With all that visitor data coming in, one thing you will want to do is optimize your pages for the best possible user experience. Often the improvements are straightforward—for example, fixing broken links, changing landing page URLs to match the visitor’s intent, or aligning page content with your advertising message. But which pages should you optimize and how? If your website has more than a handful of pages, where do you start?
Traditionally for web analytics solutions, identifying pages that underperform from the plethora of other pageview data has been a difficult task. However, Google Analytics has several resources and reports to help you. The following highlights the two areas I most commonly turn to:
- Landing pages (bounce rates)
- Funnel visualization
Using Landing Pages (Bounce Rates)
As the name suggests, the Content Site Content Landing Pages report shows the most popular entrance pages for your visitors (Figure 11-1). Note the weighted sort that I have applied to ensure that the volume of traffic—that is, visits—is taken into account when sorting by bounce rate (weighted sort is discussed in Chapter 4, “Using the Google Analytics Interface”).
Figure 11-1: Landing Pages report
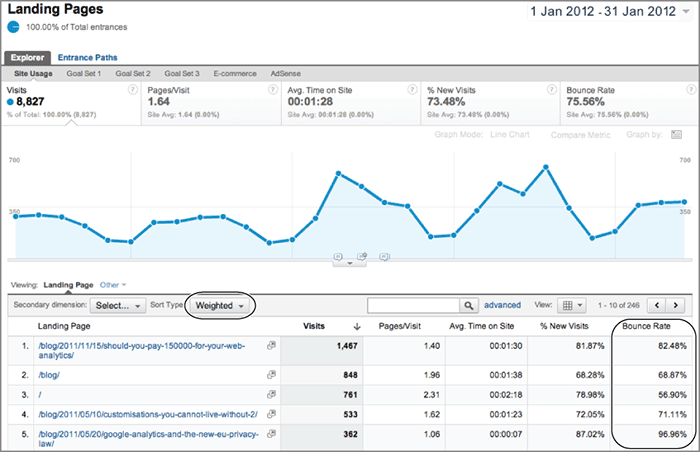
For this report, the bounce rate is the key metric; if visitors are arriving at the landing page and then leaving the site after viewing only that one page with no other action or event triggered, it is poor engagement. If a landing page has a high bounce rate, it means that the content of that page did not meet the visitors’ expectations. Beyond looking for page errors, you need insight as to what the visitors’ expectations were, which means looking at the referral details.
Note: My definition of a single pageview with no other action or event constituting poor engagement assumes you are not writing the perfect one-page article. Even if you are, you should be soliciting a further action from your visitors, such as, for example, click to rate, add a comment, a subscription, a share, or a Like on their social network and so forth. If you do not do this, how will you define success? In fact, how will you ever know if your efforts are being appreciated or worthwhile?
What constitutes a high bounce rate is discussed in the section titled “Content Creator KPI Examples” in Chapter 10, “Focusing on Key Performance Indicators.” My rule of thumb is to define high as a bounce rate of greater than 50 percent for nonpublisher websites. Publishing sites such as newspapers, book publishers, and blogs that do not require a user login generally have higher bounce rates—there is simply less incentive for visitors to click through.
Exercises for Bounce Rate Optimization
Once you have a list of your 10 worst-performing landing pages—as defined by high bounce rate weighted by traffic volume, bring in your marketing or agency team to discuss improvements. Include a member of your sales team and your customer service department in the meeting, and ask them to bring a list of the five most common questions customers ask. Then spend a morning brainstorming. The following describes a three-step approach for doing this.
Map marketing campaigns to landing pages As an initial exercise, ask the teams to map out the campaigns that should be driving visits to these landing pages. I emphasize the word should because sometimes something outside of your organization’s control—for example, a news story—can be driving your traffic and your team should also be aware of these. Hopefully, a strong overlap is apparent between your team’s knowledge and where your visitors are coming from. That is, the marketing team has campaigns running that are targeting the pages on your list, including organic search engine optimization campaigns. The important lesson from this exercise is in understanding why visitors arrive on these landing pages and what are the drivers for their doing so.
Check that visitor expectations align with landing page message In your next meeting, discuss how to improve visitor engagement; that is, how to encourage visitors to click through beyond their landing page and explore your website further, therefore decreasing the bounce rate. As a team, view each landing page from your list in a browser. The important question to answer is: Does the landing page match the expectations of the marketing campaigns for it? Perhaps the pricing is wrong, or a special offer is outdated? Are there any errors—images not loading, spelling or grammatical errors? Are your landing pages slow to load? All of these are very off-putting to potential customers.
Tip: When you view your landing pages in a browser, ensure that you use an external route to your server, one that goes via the Internet as if you are a regular visitor and not via your local network. That way you will view your pages as your visitors do—experiencing the same errors and time delays. Also, ensure that you have cleared your browser’s cache.
Define the landing page purpose and optimize. For your third team meeting, examine the purpose of each landing page. All landing pages have a purpose, and that is to help drive goal conversions. This is why you should not use your home page as a campaign landing page—it is too generic and ill focused. The purpose of your home page is to define your brand, not drive conversions directly. An obvious purpose is to present product information, but it may also be providing trust and credibility for your organization as well as managing the visitor’s expectations.
Summary of Methodology
The exercises just described are excellent for getting your teams thinking about the purpose of a page in relation to its marketing rather than focusing on its marketing in isolation, which is often the case. Bounce rate is a powerful metric for understanding content performance, and I find it is often underutilized. The following is a summary of the points discussed in this section:
- Use weighted sort to obtain your list of poor-performing landing pages from the Content Site Content Landing Pages report. Focus on the top 10 worst performing landing pages by bounce rate, and bring in your marketing team and agency for a meeting.
- Map out the current campaign strategy for the listed pages. Understand what should be driving traffic to them. See if this matches your report. For example, if 50 percent of your marketing budget for a landing page is for paid search, does that landing page receive approximately 50 percent of its traffic from that source?
- Load each landing page in your browser, and check what the visitor’s expectation will be. Does the messaging of the campaign align with that of the landing page? Are there any errors or omissions? Do pages load quickly? Improve as required. Ensure that your home page is not being used as a campaign landing page. If it is, assign a dedicated page for it, or build one.
- View the content of each landing page and determine how to increase its engagement. Ask the team what its purpose is in relation to your goals and how the purpose can be strengthened. Add or modify the conversion contributing factors.
- Where page improvements are not obvious, consider showing alternatives to a small sample of your visitors by using an A/B or multivariate testing tool—see “An Introduction to Google Website Optimizer” later in this chapter.
Conduct this entire exercise quarterly. For example, you may select 10 pages in the first quarter, followed by the next 10 in the second quarter, and so forth. Consider that most websites obey the 20/80 rule; that is, 20 percent of content is responsible for 80 percent of revenue or leads. Therefore, you should find your optimization efforts being rewarded quickly.
For assessing bounce rates in detail, the key dimensions to review are the entrance sources and entrance keywords—because these refer to your visitors’ expectations before arriving on your website. Exercises for doing this are discussed next.
Assessing Entrance Sources
As the term suggests, entrance sources are the referring websites and campaigns that lead visitors to your site—for example, search engines, paid advertising, social networks, affiliates, and email links. An example report for a website home page is shown in Figure 11-2.
Figure 11-2: Entrance sources report for a specific landing page

Discuss this report with your marketing team by considering the following perspectives:
- Offline marketing initiatives
- Paid search campaigns
- Search engine optimization (SEO)
- Social network participation
- Email marketing
In the report shown in Figure 11-2, the source labeled (direct) in row 3 could be the result of offline marketing efforts whereby people have seen your ad and remembered your web address. If you observe a high bounce rate from this source, then look at how you are targeting visitors by offline methods. A common mistake is to send visitors for a specific campaign to a generic home page, leading to poor traction with the visitor. Later in this chapter I discuss how to overcome this (see “Tracking Offline Marketing”).
Note: The label (direct) will also be applied to visitors who bookmark your website (add to favorites) and any non–web referral link that has not been set up correctly, such as email links, mobile apps, and embedded links within PDF files. To ensure that these are tracked, refer to “Campaign Tracking” in Chapter 7, “Advanced Implementation.”
From the report shown in Figure 11-2, identify any paid search campaigns. Pay-per-click advertising is an excellent way to target search engine visitors with a specific message (ad creative) and specific content (landing page URL). Any high bounce rates observed from these sources should be investigated immediately because they reflect poor targeting or a misaligned message. A common mistake is using time- or price-sensitive information in your ad creative that is outdated when the visitor clicks through. Therefore, you should review your ads carefully.
In addition, are your ad landing page URLs targeted for your campaigns? Avoid the use of your generic home page as a landing page URL—use a more specific one. Another area to look at is how you target your visitors with geotargeting; for example, do your pricing and delivery options match the expectations of visitors from different locations? These are discussed later in this chapter in “Optimizing Your Search Engine Marketing.”
From an SEO perspective, think in terms of the visitor experience because ultimately this is what search engines are trying to emulate with their ranking algorithms. For high-bounce-rate pages from organic search visitors, view the source code and read the content within the HTML <title> and <meta name="description"...> tag sections. Are these in alignment with the rest of your page content? This is important because it is the only information about your organization a visitor sees on a search engine results page—the text of the clickable link is taken from your page title tag, while the snippet of text underneath is taken from your meta description tag. Hence, these are important qualifiers for visitors before clicking through to your site. Discuss with your marketing team making adjustments to these HTML tags. Most Content Management Systems (CMSs) allow you to do this without having to edit source code.
Also consider link referrals from other websites. Following a link from another website that turns out to be out of context is obviously a poor experience and waste of time for the visitor (it can also have a negative impact on your SEO rankings). If you find referral links with high bounce rates, use the Traffic Sources Sources Referrals report to investigate further. From there you can identify the referring site and view the exact page that visitors clicked through to arrive on your website. Sometimes a simple, polite email to the webmaster of the referring site can pay you dividends. Specify that you want to ensure that links are in context and point to a relevant, specific landing page on your website. Provide any necessary details in your email.
Assessing Entrance Keywords
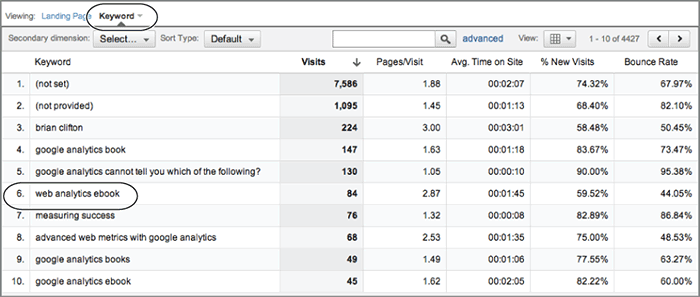
The Entrance Keywords report focuses on those visitors who have used search engines to arrive on your website—both paid and nonpaid (organic) search engines. In effect, this report is direct market research—visitors are informing you of exactly what content they expect to see on the page they arrive at on your site. Click the Keyword dimension shown in Figure 11-2 to extend the report, as shown in Figure 11-3.
Figure 11-3: An Entrance Keywords report
As with the Entrance Sources report, high bounce rates here (greater than 50 percent) are an indicator that something may be amiss with your online marketing. Assuming your web server performance is not an issue, look at your visitor targeting, message alignment, and page relevancy, as described in the previous section.
Following this, consider the Entrance Keywords report as an opportunity to build page content around the listed keywords. For example, in Figure 11-3, row 6 for www.advanced-web-metrics.com shows a search term of web analytics ebook, yet I had not considered the term ebook in my content—instead I had been referencing the terminology as PDF. I now know ebook is an important term to my visitors and so have been including it ever since on relevant pages.
This is an example of where viewing low-bounce-rate pages can also provide important information (row 6 shows a relatively low bounce rate). Generally speaking, you will focus your efforts on analyzing high-bounce-rate pages because these are the ones killing your visitors’ user experience. However, it’s important to look at both ends of the spectrum when searching for insights.
Funnel Optimization Case Study
As discussed in Chapter 5, “Reports Explained,” funnel analysis is an important process that helps you recognize barriers to conversion on your website, including the checkout process. I have often seen how understanding the visitor’s journey within a website, followed by subsequent changes to improve the process, can lead to dramatic improvements in conversion rates and therefore the bottom line. For example, the fourfold increase in bookings for a travel website, shown in Figure 11-4, was the result of the following funnel optimization case study.
Figure 11-4: Conversion rate improvement for a travel website before and after funnel optimization

Billions of Dollars Left Abandoned
According to 2010 data from Forrester Research Inc.
www.internetretailer.com/2010/09/28/key-profit-indicators-point
the average shopping cart abandonment rate for US online retailers is 55 percent. In other words, the transaction revenue obtained by site owners is approximately half of what customers are willing to spend and are in the process of spending. That is, on average US retailers leave $1 of the money on the table for every $1 collected! It is an incredible amount statistic when you consider that US online retail is predicted to be worth $279 billion by 2015. See
Schematic funnel shapes and their meanings are discussed in the section “What Funnel Shapes Can Tell You” in Chapter 8, “Best Practices Configuration Guide.” An ideal funnel process would schematically look like Figure 11-5, where there is a gradual decrease in visitors (width of funnel) because of self-qualification through the various steps (height of funnel). The process of self-qualification could be by, for example, price, feature list, delivery location, stock availability, and so on.
Figure 11-5: An ideal schematic wine goblet funnel shape

For this travel website case study, Figure 11-6 schematically illustrates the checkout process (booking a vacation).
The customer follows these steps:
1. Search for a vacation rental.
2. View search results.
3. Check the availability of rental.
4. Book the trip.
5. Confirm the booking.
6. Make payment.
7. Receive confirmation of payment.
Figure 11-6: Schematic funnel process for the travel website case study

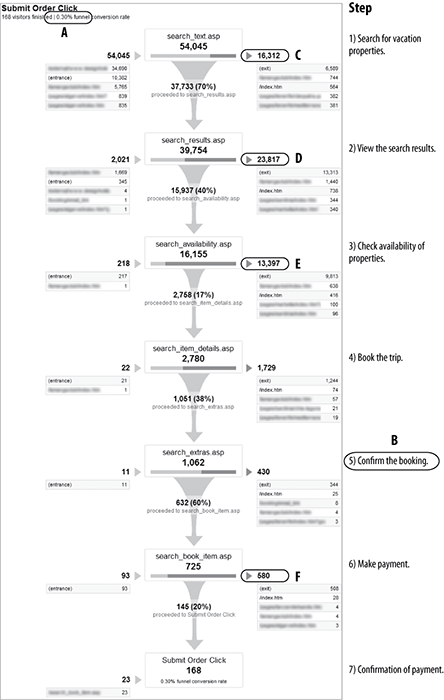
Figure 11-7 is the actual funnel process reported in Google Analytics for the travel website using the Conversions Goals Funnel Visualization report.
Note: I am quite biased when it comes to travel websites. On the whole, they tend to be poorly built from a user’s viewpoint. They are pretty, with a lot of colorful images and inspiring photographs, but I never seem to have a good experience when it comes to actually booking my travel plans, let alone a great one. However, as a wise person (@AnderssonSara) once said to me, “Your biggest obstacle is also your greatest opportunity.”
Figure 11-7: Funnel Visualization report for the travel website case study (page names obfuscated for anonymity)
Issues with the Funnel Presented
The steps from the funnel visualization in Figure 11-6 are discussed in the context of the following six issues, indicated by the large letters in Figure 11-7:
Issue A The most obvious metric that stands out in Figure 11-7 is the end conversion rate—a woefully poor 0.30 percent. Put another way, 99.70 percent of all visitors abandon the booking process. Considering the cost of acquiring those visitors by both paid and nonpaid search, that means a very, very negative return on investment.
Note: Although this funnel example is an extreme case, it never ceases to amaze me that online purchase rates can be so low and are accepted as such. For example, the e-tailing group 10th Annual Merchant Survey, April 2011, shows that the most common US merchant conversion rates are between 1.0 and 2.9 percent (see the chart in Figure 1-5 in Chapter 1, “Why Understanding Your Web Traffic Is Important to Your Business”). Surely we can do better than having 97 plus percent of visitors leave a website without conversion? I hope that having read this far, you will agree that it is laudable and entirely possible to improve this percentage significantly.
Issue B Looking at the entire booking process, the length of the funnel, at seven steps, appears overly long. From user experience experiments, it is widely known that users do not like long checkout processes. That’s obvious to anyone who uses the Web! The most effective method to reduce cart abandonment is to streamline the number of steps in the process, and this is applicable here. On inspection, step 5 (confirm the booking) is superfluous because all booking details are displayed at each preceding step.
Issue C The process begins with the search_text.asp page. This is the page where visitors search for their vacation rental (hotel, villa, apartment). From this page, 30 percent drop out of the funnel.
Issue D Following step 1, the search results page (step 2) loses 60 percent of remaining visitors; over half of these (13,313) exit the site completely.
Issue E Looking at the check-availability page (step 3), 83 percent of remaining visitors drop out of the funnel; again, the vast majority are site exits (60 percent). This is clearly a pain point and should be red-flagged as a problem page.
Issue F The next steps in the system have similar problems, but the killer is step 6, which is when payment details from the visitor are requested. Out of the 725 visitors who have had the stamina and persistence to get through what is obviously a difficult process, 80 percent of them (580) abandon at this final step; the vast majority leave the website completely.
Seeing the result of these issues represented schematically, we observe a funnel shape more like what is shown in Figure 11-8, with two clear pain points in the process, step 3 and step 6, that lead to large-scale abandonment.
Figure 11-8: Stacked champagne glass schematic funnel shape

Action Points from the Funnel Optimization
Understanding the real-world funnel process of Figure 11-7 and its problems took less than one hour because the data is so clearly presented. Of course, correcting such issues obviously takes longer; you need to understand why this happened. This is something that web analytics tools cannot do; they cannot tell you why visitors are abandoning your booking process.
To address this, you could deploy a feedback system—a survey that pops up when a visitor abandons the booking process or leaves your website. Example survey tools include Clicktools, Kampyle, SurveyMonkey, and UserVoice. However, if your visitors are leaving because of a bad experience, they usually won’t want to spend further time on your site explaining what went wrong. That said, any feedback from visitors within your shopping cart system who are abandoning is gold dust and worth pursuing. See Chapter 12, “Integrating Google Analytics with Third-Party Applications,” for an example integration with the Kampyle feedback system.
Putting aside having to deploy a feedback survey system, a little lateral thought and visiting your own website as if you were a potential customer can go a long way. For example, in this scenario I focused on steps 3 and 6, where the vast majority of visitors were abandoning the booking process. This led to the development of four key recommendations for improvement:
Improve the availability checker page. Step 3 (the availability checker) indicates either a total lack of accommodation availability, in which case the website owners should turn down the visitor acquisition tap and save marketing budget, or a malfunction in the process of selecting available dates.
Lack of availability was not an issue. When I viewed the availability checker manually, no errors were found, but the process was quite clunky and difficult to interpret. For example, dates themselves were nonclickable. Instead, date-selection controls were located below the fold of the page—that is, not visible without scrolling down.
Correct the layout of the payment form. Step 6 (the payment form) required some additional thought. Although the form was considered to be overly long at seven steps, it did not make sense that such persistent visitors would bail out en masse at the penultimate step (visitors were aware of their progress by the numbering of the steps—for example, with the heading “Step X of Y”). To test for problems, I tried the process of booking a vacation myself.
What I immediately discovered when clicking to submit my dummy payment details was an error page. In addition, the error page did not indicate what caused the problem. Using the Back button, I checked all the required fields and tried again—same error page, no message indicating what the error was. This process was repeated many, many times with no further insight. It really did appear to be a mystery as to why I could not complete my payment.
In fact, the problem was staring me in the face. The credit card type (Amex, Visa, MasterCard) was preselected as Amex by default. However, the HTML drop-down list for selecting the card type was not aligned with the other form fields—it was to the extreme right of the page, while everything else was left aligned.
Despite repeatedly testing the payment system and staring frustratedly at the page, I simply didn’t see the right-aligned card selector. I was filling in all my details correctly and hadn’t noticed the default setting for the credit card as Amex while I was using Visa. In fact, I hadn’t noticed the card type drop-down list at all.
Now the explanation of large-scale abandonment at step 6 is clear. Visitors were receiving the error page, which was probably the straw that broke the camel’s back after such a difficult and torturous booking process, and so they simply abandoned the site.
Streamlining the Checkout Process
Although selecting your card type on a payment form is almost always a manual process, it is possible to automate this and remove any potential errors. You can do this by using the initial digits of the card number, as shown in the following table:
| Card Types | Prefix | Number of digits |
| American Express | 34, 37 | 15 |
| Diners Club | 300 to 305, 36 | 14 |
| Carte Blanche | 38 | 14 |
| Discover | 6011 | 16 |
| EnRoute | 2014, 2149 | 15 |
| JCB | 3 | 16 |
| JCB | 2131, 1800 | 15 |
| MasterCard | 51 to 55 | 16 |
| Visa | 4 | 13, 16 |
Track error pages. Part of the difficulty in identifying the problem visitors were experiencing in step 6 was that the subsequent error page was not being tracked. Had it been, using the methods described in Chapter 9, “Google Analytics Customizations,” the investigation could have taken place much more quickly.
Show clear instructions in your error pages. Even if an investigation into the low conversion rate had not been undertaken, visitors could have corrected the payment problem themselves—that is, if they were told what the problem was. Clearly this is not a solution to the problem, but it is certainly better than slamming the door in their face with nothing more informative than “Error—please try again.”
Summary of Funnel Optimization
Presenting these findings to the client was groundbreaking. They had hired and fired several search engine marketing agencies in the belief that they were receiving poorly qualified leads, resulting in such a low (0.3 percent) conversion rate. In fact, the problem was entirely on their site: a poor user experience. Once the problem was fixed, their conversion rate jumped fourfold, with a concomitant revenue increase of millions of extra dollars per year. I should have billed by commission!
Funnel analysis shows both the power and the weakness of web analytics as a technique for understanding visitor behavior on your website. The power is in identifying the problem areas during a typical path visitors take; for that, your web analytics is capable of telling you what happened and when. That in turn enables you to focus your efforts on improving the particular problem page. The weakness of web analytics is that it does not tell you why visitors made the choices they did. To understand why visitors behave in an unanticipated way, you need to investigate—either directly yourself (try a checkout or booking on your own website) or by conducting a survey or usability experiment.
Tip: If usability experiments is a new term for you, don’t contact a specialist agency until you check out these excellent books by Steve Krug: Don’t Make Me Think (New Riders, 2006) and Rocket Surgery Made Easy (New Riders, 2010).
Measuring the Impact of Site Search
Site search is the internal search engine of your website that visitors often substitute for a menu navigation system. For large websites with hundreds or thousands of content pages (sometimes hundreds of thousands), internal search is a critical component for website visitors, enabling them to find what they are looking for quickly. Internal search engines generally use the same architecture as an external search engine such as Google. In fact, the major search engine companies sell their search technology to organizations. See, for example, the Google Search Appliance:
www.google.com/enterprise/search/gsa.html
Important site search KPIs were discussed in the section “Webmaster KPI Examples” in Chapter 10. In addition to the Site Search Overview report (refer to Figure 10-25), one of the things you will want to know is what keywords visitors are typing once they arrive on your website. The idea is that once you know these keywords, you include them (or exclude them if they are not relevant to you) in your paid and organic campaigns as well as ensure that landing pages are optimized for them. This is discussed in the section “Optimizing Your Search Engine Marketing” later in this chapter. Example site search terms are shown in Figure 11-9, taken from the Content Site Search Search Terms report.
Figure 11-9: Site Search Terms report showing keywords used
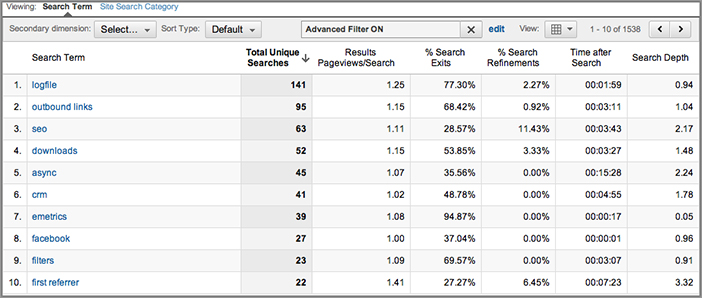
Note: The value of the Site Search Terms report shown in Figure 11-9 should not be underestimated. Visitors on your website are actually telling you what they would like to see, in their own language, using their own terminology. Perhaps you assumed “widgets” was the commonly known name of your product, but you find out that people are searching for “gadgets,” or people are looking for “widgets with feature X,” which your manufacturing team hadn’t thought of. It’s analogous to your potential customers walking into your store or office and providing you with direct feedback—without you having to ask or worry about infringing on visitor privacy.
The Revenue Impact of Site Search
Beyond looking at site search terms used, how do visitors who use your site search facility compare to those who do not? I illustrate this with two screen shots taken from the Content Site Search Usage reports (Figure 11-10 and Figure 11-11).
Figure 11-10: Pages per visit comparison of visitors who use site search and visitors who do not
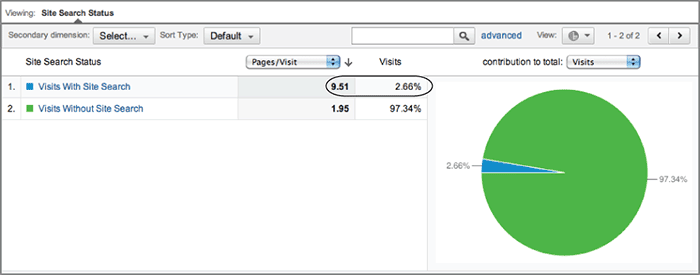
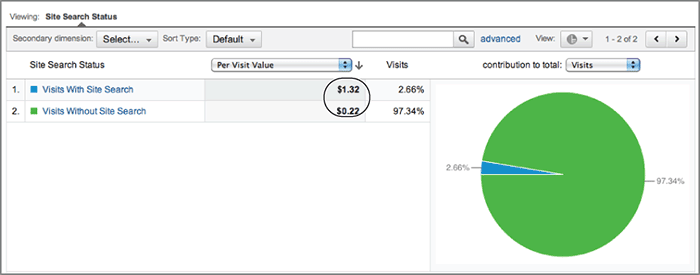
Figure 11-11: The per visit value difference from using site search
In Figure 11-10, you can see that the percentage of visits resulting in a site search is low at only 2.66 percent. However, the Pages/Visit metric for those visitors is almost five times higher compared to those who did not perform a search. Hence, a better user experience is inferred for those visitors.
Other key metrics can be selected from the drop-down list for comparison. A particular favorite of mine is the Per Visit Value (or Per Visit Goal Value if yours is a nontransactional site), as shown in Figure 11-11. For this metric to be available, ensure that you are in a Goal Set or E-commerce section of your reports—refer to label M of Figure 4-4 in Chapter 4 if needed.
Per visit values measure the value of a visitor. That is, did a visitor go on to complete a transaction or monetized goal? The higher the per visit value or per visit goal value for a visitor using site search, the more important that function is to the value of your website. I am assuming that where a visitor has come from, their referral source, is not a factor in whether they use site search or not.
From Figure 11-11, a visitor who uses site search is six times as valuable as a visitor who does not. For this example site, increasing the usage of the site search feature is clearly going to have a positive impact on the site. Armed with this information, meet with your web development team (those responsible for your internal site search engine) and discuss with them what plans they have for developing and growing the site search service. Before doing so, use the following formula to calculate the revenue impact that site search is having on your website:
Using Figure 11-11 and knowing the number of visitors who used site search for this example website (11,463, taken from the Site Search Overview report, not shown), the calculation is
revenue impact of site search = (1.32 – 0.22) × 11,463 = $12,609 per month
To put this value into context, it represents only 2.66 percent of the total traffic to the site. If site search participation can be increased, say to a around quarter of all visits, their value becomes $126,000 per month—a very significant amount. This may at first sound like an unbelievable target. However, I have achieved these types of gains with several e-commerce site search facilities.
What If Site Search Has a Negative Revenue Impact?
In the previous examples, site search was shown to be clearly beneficial for the site, but what if the metrics are reversed—that is, visitors who use site search have lower Per Visit and Per Visit Goal Values than those who don’t. This would result in a negative revenue impact of site search—its use is costing you money!
It is possible that such a result could be valid. That is, in some scenarios, finding information can best be served by a directory-type structure of navigation rather than a search engine—for example, a visitor looking for location-specific information or where jargon may be a barrier to know what to search for. However, I have found this to be rare.
Instead, a negative revenue impact of site search usually indicates an issue with the quality of the results returned. So far, we have assumed that your internal site search engine is working well, producing accurate and informative results regarding visitors’ searches—the visitor just needs to be encouraged to use it. Unfortunately, most often this is not the case. There can be two reasons for this to happen:
- Your site search cannot find content to match the visitor’s query.
- The results returned by your site search are of poor quality.
Other Metrics for Comparing the Performance of Site Search
Other key metrics can be selected from the drop-down list shown at the top of the table in Figure 11-1. These are as follows:
Goal Conversion Rate
Revenue
revenue = goal value + e-commerce value
Average Value
E-commerce Conversion Rate
Per Visit Value
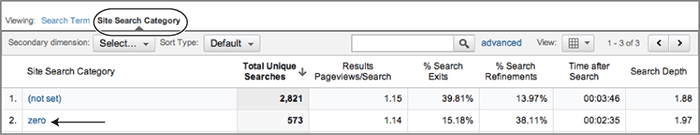
To get a handle on whether the first reason is valid, look at the zero results produced by your site search engine. The method for tracking zero results is discussed in Chapter 8. Assuming you have used the same setup, select the label Zero from your Content Site Search Search Terms Category report. This reveals the keywords used that generated a zero result—as per Figure 11-12.
Figure 11-12: Viewing zero-result keywords from site search
Export this list into Excel, and highlight the keywords that are directly related to your website content. Meet with your web development team to ascertain why such relevant terms produce zero results. Maybe you have overlooked misspellings, regional differences (think “holiday” versus “vacation”), or visitors using terminology they are not familiar with. However, it may be that there is a problem with how your site search engine works or is configured. Is it picking up newly created or modified pages? Can it index PDF files? How is it ranking results?
Identifying the second reason—poor quality results returned by your site search—is harder to ascertain quantitatively. As discussed in Chapter 1, web analytics tools are great at telling you what happened on your website and when. But they cannot tell you why it happened. To understand the quality of a user’s experience, you need to either ask your visitors (deploy a feedback survey) or put yourself in your visitors’ shoes and go through the experience yourself. I recommend the latter method in the first instance—in fact, you should be regularly visiting your site to test the visitor experience.
Poor-quality results are indicated by a negative value, or a low value, of your revenue impact of site search combined with low frequency of zero results. This is the case when your site search returns irrelevant results, such as, for example, reams of press releases—useful for the media though not interesting for the vast majority of your visitors, or when site search returns product sales information when the visitor is looking for help and support information. Investigate this further by looking at the number of search exits (visitors who exit following a search) and search depth (the number of pages viewed after a search). Review the section “Webmaster KPI Examples” in Chapter 10 and in particular Figure 10-25 as needed.
A high search exit rate and low search depth are indicators of poor site search results. It may mean that the results are either irrelevant or are poorly ranked—too many results with a lower relevancy ranking higher. Perform the searches for your 10 most common keywords and judge for yourself. A simple fix is to allow your visitors to categorize their search requests. For example, using the previously mentioned scenarios, search only within the “product details,” “support information,” and “press releases” categories.
Summary of Site Search Impact
Site search engines are often installed and configured once and then forgotten—that’s a mistake. I often find the greatest opportunity for site improvement, that is, conversion and revenue improvement, is found by looking at its site search performance. Websites evolve rapidly, including new content and new technologies. If site search visitors have a lower revenue impact without good reason, then site search is costing you money. Present this figure to the head of your web team and schedule a meeting to discuss enhancements or a replacement. Showing a dollar amount is a much better motivator than saying, “Our site search is not working effectively.”
With your export list of zero-result site search terms, highlight the keywords visitors used that are not relevant to your organization but are related to the business you are in. If the number of these is significant (more than a few percent of the total number of unique searches), then meet with your product or service team to discuss their meaning. Perhaps the product team never thought people would want to search for feature X combined with product Y. Your site search data could provide valuable insight into this. For example, an action item may be to build a specific landing page for product XY to gain further feedback from those visitors.
Optimizing Your Search Engine Marketing
If you own a commercial website, then you want to drive as much qualified traffic to it as possible. Online marketing options include search engine optimization (nonpaid search, also known as organic search), paid search advertising (text ads, also referred to as pay-per-click or cost-per-click), email marketing, display advertising (banners), and social network participation (comments and links left on sites such as Twitter, LinkedIn, Facebook, forums, blogs, and so on).
All of these visitor acquisition methods have a cost—either direct with the media owner or indirect in management fees—though there is nothing stopping you as a do-it-yourself enthusiast. Optimizing your marketing campaigns using Google Analytics data can achieve cost savings and expose significant opportunities for your business. The following sections focus on the essential steps for optimizing your search engine marketing (SEM), both paid and nonpaid, including the following:
- Keyword discovery (paid and nonpaid search)
- Campaign optimization (paid search)
- Landing page optimization and SEO (paid and nonpaid search)
- AdWords day parting optimization (paid search)
- AdWords ad version optimization (paid search)
Keyword Discovery
When optimizing for SEM, one of the things you will constantly be on the lookout for is ideas for adding new, relevant keywords to your campaigns. These can be broad (for example, shoes), bringing in low-qualified visitors in the hope they will bookmark your page or remember your brand and website address for later use, or very specific (for example, blue suede shoes), which are highly targeted to one of your products and could lead to an immediate conversion on a visitor’s first visit.
Several offsite tools are available to help you conduct keyword research:
- Google AdWords Keyword Tool (https://adwords.google.com/select/KeywordToolExternal)
- Wordtracker (www.wordtracker.com)
These enable you to discover what people are searching for on the Web as a whole (hence the term offsite tool) that may be related to your products or services and in what numbers. The tools help you determine which search keywords are most frequently used by search engine visitors and then help you identify related keywords, synonyms, and misspellings that could also be useful to your marketing campaigns. Clearly, being language and region specific is important; for example, tap and holiday are terms used in the UK that in the United States are more commonly known as faucet and vacation, respectively.
Note: The differences between offsite and onsite web analytics are discussed in Chapter 1, “Why Understanding Your Web Traffic Is Important to Your Business.”
In addition to these offsite tools, your Google Analytics reports contain a wealth of onsite information that can help you hunt for additional suitable keywords. There are two areas to look at: search terms used by visitors to find your website from a search engine and internal site search queries, that is, those used by visitors within your website.
Farming from Organic Visitors
The Traffic Sources Sources Search Organic report is dedicated to referral keywords—keywords used by visitors who come from all organic search engines (see Figure 11-13). As an initial exercise, export all of your organic keywords. Compare them with those targeted by your paid campaigns from the Traffic Sources Sources Search Paid report. Organic terms that are not in your paid campaigns are excellent candidates to be added to your pay-per-click account. After all, you will wish to maximize your exposure to relevant search terms.
Figure 11-13: Keyword research from organic visitors

When adding keywords used by organic search visitors to your pay-per-click campaigns, consider your current organic search rankings for those terms. For example, if you are number one for your brand or product name in the organic results, should you also add this to your paid campaigns? If you do, you are likely to cannibalize your own free organic traffic.
My recommendation is to not bid if you have no pay-per-click competitors for a specific brand term (such as your company name)—otherwise you will be paying for traffic that will already come to you. On the other hand, if your competitors are bidding on your brand terms you should also bid on them, even with your number one organic ranking. The hypothesis is that you receive an additional boost in traffic (a 2 + 2 = 5 effect) by picking up traffic from your competitors. The additional traffic comes from pushing down your competitors’ ranking in the paid result and occupying more “shelf space” on the results page itself.
The screen shown in Figure 11-13 is an excellent example of the wealth of information readily available within reports for improving your SEO efforts. In this case I have selected the pivot view to show visits and bounce rates on a per-search-engine basis. The secondary dimension is also used to provide the landing page URL for each keyword. The result is a report of search engines (shown horizontally across the top of the data table) that correlates keywords with landing pages, showing bounce rate and visit metrics. This is information that will surely keep any marketer busy for several hours!
What Does the Keyword (Not Provided) Mean?
Row 4 in Figure 11-13 shows a keyword labeled “(not provided)”. This is the entry that Google sets when a visitor conducts a search on a Google property while they were logged into their Google account—for example, a Gmail user who is logged into their mail account and opens another window to perform a search.
Google’s reasoning for this is privacy—that is, users often access their email via open Wi-Fi networks, and their search query terms could contain personally identifiable information. When logged in to their Google account, the user’s search is encrypted and so not viewable over an open Wi-Fi connection. In October 2011, Google also made the decision to remove any referral keyword information transferred to a website when a user clicks through from a search result. Because the keyword information is removed, this affects all web analytics vendors.
Oddly, this setting does not affect visitors who click ads while logged in and conducting their search. For more discussion on this see
www.advanced-web-metrics.com/blog/2011/10/19/organic-search-terms-blocked-by-google
Farming from Site Search Visitors
If your site has an internal search engine to help visitors find what they are looking for, then this is an excellent feedback mechanism for your marketing department—that is, visitors telling you exactly what they want to see on your website. Your Content Site Search Search Terms report is a rich seam of invaluable keyword information for you to mine. We looked at measuring the success of site search in the preceding section and also in Chapter 10, in the section “Webmaster KPI Examples.”
From within your Google Analytics account, export your site search keywords and compare them with those in your paid search accounts (pay-per-click). Site search keywords not in your pay-per-click accounts are strong candidates to be added. As described for farming from organic search visitors, when selecting new keywords from your Site Search reports, also check your organic rankings for them. If you have a relevant landing page ranked as number one organically for a particular search engine and no pay-per-click competition for that term, I suggest that you do not add that term to your paid campaigns for that search engine. There is no point—you just cannibalize your own free organic traffic.
In addition to comparing keywords from site search with your paid campaigns, also compare them with your nonpaid search terms. Perhaps there are variations in usage or spelling you can take account of in your page content. Perhaps visitors are using relevant keywords after they are on your site that you are not aware of. For example, visitors looking for books may also use keywords such as “how-to guides,” “manuals,” “white papers,” and “tech sheets” on your internal site search. This is a perfect opportunity to build and optimize your website content for those additional, related terms.
Campaign Optimization (AdWords)
After farming for new keywords from organic search engines and site search users, and adding them to your paid campaigns (if applicable) and to the content of relevant pages, the next stage is to ensure that these keywords are optimized—that is, that they give you the best possible chance of conversion.
Within the Advertising side menu is a dedicated section for AdWords. This enables you to drill down into campaign, ad group, and keyword levels for details of conversion rates, return on investment (ROI), margin, and more. As a business entity, you want to invest more in campaigns that produce more conversions and leads for you than in those that merely create visibility for your brand. However, you must take care here because by default Google Analytics gives credit for a conversion to the last referrer. In other words, spending more on campaigns that are reported as generating conversions and culling those that don’t may result in you chopping off the head that feeds the tail.
The Multi-Channel Funnels report discussed in Chapter 5 enables you to see the path and interaction of different referral sources that lead to conversion. Therefore, it is important to refer to this report when optimizing all of your marketing efforts. This is discussed in “Attribution Optimization” later in this chapter.
Calculating Your Real ROI
The calculation performed by Google Analytics for the AdWords Return on Investment is very straightforward, as follows:
ROI = (revenue – cost) / cost
Therefore, if the ROI for a keyword is shown in your reports as 500 percent, this means you are receiving a $5 return for every $1 spent on AdWords. Assuming your revenue is $600 from $100 spent, this is calculated as follows:
However, Google Analytics has no idea what margins you operate under, so the default ROI displayed by Google Analytics is misleading. Figure 11-14 shows the default ROI on a per-keyword basis—available in the Clicks area of your reports in the Advertising AdWords Keywords section.
Figure 11-14: The ROI values of AdWords keywords

You will need to factor in your operating profit to get the true ROI figures. For example, assuming the same revenue and cost figures, if your profit margin (excluding marketing costs) is 40 percent, your real ROI is calculated as follows:
Table 11-1: Comparing ROIreal versus the reported ROI from Google Analytics

Table 11-1 illustrates the importance of taking into account your profit margins when interpreting your ROI values. While the trends will remain the same, the more accurate ROIreal values are important because they determine how much money you can bid for competitive terms in order to stay profitable. This is discussed next.
Note that when a keyword does not generate any revenue, its ROI and ROIreal values show as –100%.
Note: At the beginning of a campaign launch, your ROI may be negative as you build up brand awareness and visibility for your website. Visitors to a new website (new to them) usually require multiple visits before they convert. However, a negative ROI should be acceptable for only a short period of time—on the order of weeks, depending on your circumstances. See also Figure 10-6 in the section titled, “E-Commerce Manager KPI Examples,” in Chapter 10.
The ROI of Other PPC Networks
Within Google Analytics you can track visitors from any search engine, and any referral, right down to campaign and keyword levels. However, at present, cost data can only be imported from AdWords. That is, within your reports, ROI data can be calculated only for AdWords visitors. To perform the same calculations for other marketing channels, export your visit and revenue data to a spreadsheet and merge it with your third-party cost data.
Calculating Your Maximum Bid Amount
Your maximum bid (max bid) is the maximum amount you are prepared to pay for a keyword in the AdWords auction system. The actual amount you pay depends on many factors. For example, how many competitors are also bidding on the same keyword, how effective their ads are at gaining click-throughs, how effective your ads are at gaining click-throughs, how well you retain your visitors—that is, not bouncing them back to AdWords because your landing page failed to meet their expectations. These are the basis of the AdWords Quality Score system.
Being able to calculate your max bid is therefore an important aspect of your AdWords optimization. Your ROIreal determines the amount. That is, the ROIreal you wish to maintain while bidding will determine the max bid amount. The following is a detailed explanation. Unfortunately, describing the process on paper is cumbersome. However, in Excel the process is quite straightforward. I show this in the next section, “Simplifying the Task.”
First, select a ROIreal that you are comfortable with—that is, one that drives more traffic to your website while still providing a healthy profit margin for you. For an online retailer this may be 25 percent, for example (making $0.25 profit for every $1.00 spent). With your preferred ROIreal set, calculate the maximum amount this allows you to spend on customer acquisition—the maximum cost per acquisition (cpamax)—by using the following procedure:
For this example, I use the data for Keyword 1 from Table 11-1. Setting a target ROIreal of 25 percent and a profit margin of 40 percent, the calculation is as follows:
This is the total cost you are willing to pay for a visitor with keyword 1 in order to achieve an average order of $192.78. Of course, not every visitor who clicks your ad is going to become a customer, so knowing your conversion rate for each keyword, you calculate your maximum cost per click (cpcmax) allowed for that keyword. Here I use the e-commerce conversion rate for keyword 1 (0.8 percent), taken from the E-commerce section of the reports (the menu link adjacent to Clicks), though it is not shown.

For this example keyword, you could bid up to $0.49 in AdWords to generate as much traffic as possible and be assured that you will make a gross profit of $1.25 for every $1.00 spent. You will never overbid for your AdWords keywords—even if you reach your cpcmax within your AdWords account, you will still maintain a 125 percent ROIreal. Because the actual bid you pay in AdWords is determined by the market and is in constant flux, your ROIreal is likely to be higher than this for all but your most competitive keywords.
Tip: As you will have noticed from this exercise, the data you are accessing comes from two reports within your Advertising AdWords Keywords report—the Clicks and E-commerce reports. Clicking backward and forward between these is obviously cumbersome. Therefore, use the Better AdWords custom report as described in Chapter 9 to merge the relevant data points. One change is required to this custom report—change the dimension from campaign to AdWords keyword.
Note: If you are a nontransactional site, substitute Total Goal Value for Revenue, Per Visit Goal Value for Average Order Value, and Goal Conversion Rate for E-commerce Conversion Rate in the calculations. Your goals will need to be monetized for this to work—see Chapter 8.
Simplifying the Task
The calculations of cpcmax appear cumbersome when written on paper, but with a spreadsheet it is actually quite simple, as shown in Figure 11-15. First, you need to export your Advertising AdWords Keywords report. However, as explained in the previous tip, the data you require is in two reports—the Clicks and E-commerce reports. To make things easier for you, use the Better AdWords custom report as shown in Chapter 9. This allows you to have all the data in one report (you will need to change the dimension from campaign to AdWords keyword).
Figure 11-15: Excel spreadsheet to calculate per-keyword cpcmax

With the Better AdWords custom report loaded, export the data to a CSV file (or schedule a report email on a regular basis), and open the file in Excel. From this spreadsheet, you require only three columns of data: Keyword, Average Value, and E-commerce Conversion Rate; the rest can be discarded unless you are a nontransactional site—see the previous sidebar note about substituting goal values for transaction values. From the screen shown in Figure 11-15, inputting your profit margin (cell E2) and desired ROIreal (cell E3) will display the cpcmax (column F).
Note: You can download this Excel template from www.advanced-web-metrics.com/chapter11.
As you can see, the cpcmax calculation is at the keyword level throughout. However, if you are bidding on large volumes of keywords (I once reviewed an AdWords account with over a million bid terms!), it is more likely that you will be bidding a single cpc amount for groups of keywords—that is, ad groups. In that case, the more focused your ad groups are, the more accurate the cpcmax calculation will be.
Attribution Optimization
Multi-Channel Funnels reports are described in the section “Top Standard Reports” in Chapter 5. They allow you to view the entire referral path that visitors use when they convert—that is, not just the last click, as has been traditionally the case. An example of this is shown in Figure 11-16, taken from the Conversions Multi-Channel Funnels Top Conversion Paths report.
Figure 11-16: Top conversion paths report

Figure 11-16 shows referrers grouped into color-coded dimension named channels. These are analogous to referral mediums. The default view is to show the basic channel grouping path. This is an insightful report in itself. However, I encourage you to explore other channels, using the links at the top of the report table—for example, source path, campaign path, and keyword path.
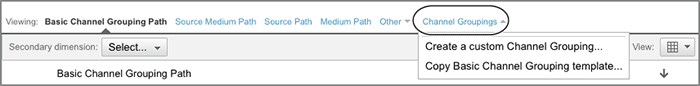
Why Copy the Basic Channel Grouping Template?
The second menu item shown in the drop-down list in Figure 11-17 allows you to copy the existing template used for the basic channel grouping, which is the default display for the Conversions Multi-Channel Funnels Top Conversion Paths report. You will need to alter this template if the default report does not match your existing campaign tracking setup. For example, Google Analytics groups together all referrals where medium=email as the channel named Email. That is obviously correct, but perhaps in your campaign tracking you have set medium=e-mail, e-mail marketing, or e-post (Swedish). With the default template these will not be grouped together in the Email channel. To do so, copy the basic channel grouping and edit accordingly.
Other common edits to the default grouping include Feed and Social Network. For example, Feed is set to use medium=feed by default to detect visits from your RSS feed. Yet you may have custom-tagged your feed as something else—the section “Integrating with Feedburner” in Chapter 6, “Getting Started: Initial Setup,” describes how to do this. The channel Social Network is compiled using a list of over 150 social network sites, determined by Google. Although the list is extensive, you may have niche social sites you wish to include with Google’s list.
As your knowledge of Multi-Channel Funnels reports grows, you will want to go deeper into understanding the finer correlations that exist. To assist with this, you can create your own custom channel groupings—either from scratch or using an existing channel, as shown in Figure 11-17.
Figure 11-17: Creating your own custom channel grouping
A common custom channel grouping I recommend is to compare brand search terms and generic search terms—that is, search engine visitors who already know of your company or product names versus those who are unaware of you. Knowing what interaction exists between these search engine visits clearly impacts your digital marketing. Figure 11-18 shows an example custom channel grouping for this book’s website (advanced-web-metrics.com).
In Figure 11-18, I have used two rules—one using a regular expression to include my specific brand terms. These are brian|clifton|advanced web metrics|measuring success. The second rule is the inverse of this, the same regular expression match but with the condition set to exclude my brand terms; that is, every other keyword used by my visitors. You could be more specific here. For example, using “company brand” keywords, “product A brand” keywords, “product B brand” keywords, and so forth.
Figure 11-18: Custom channel grouping set up for search engine visitors using brand terms versus generic terms

The result of applying my custom channel grouping is the report shown in Figure 11-19. This has branded search terms color-coded as gold and nonbranded search terms color-coded as black and shows conversions where the referral path contains two or more referrals (the default view).
What is interesting to observe from Figure 11-19 is that 51 of 121 transactions have visitor interactions between brand and generic terms, accounting for 21 percent of the revenue. (Note that to illustrate the point, I have used only the data shown for the first 10 conversion paths for this calculation—not the full channel grouping contents of 149 rows).
Figure 11-19: Custom channel grouping report produced from Figure 11-18

As Figure 11-19 clearly shows a strong interaction between brand and nonbranded search terms, I recommend a further refinement of this method. That is, creating two additional custom channel groupings to differentiate between paid and organic search and between head terms and long-tail keyword terms. See Figure 11-20a and b, for example.
Figure 11-20: Refining your custom channel grouping: (a) differentiating paid versus organic terms and (b) differentiating organic head versus long-tail terms
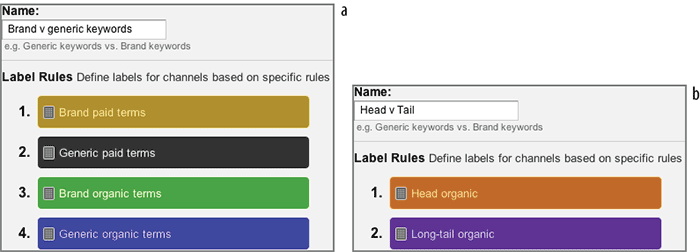
Note: By head terms, I am referring to the key phrases you wish your site to be found for and that therefore should have the highest volume of visitors. By contrast, “long-tail” phrases are more specific and therefore individually generate less traffic. The sum of traffic from the long-tail phrases, however, can be very large—which is why they are important.
Landing Page Optimization and SEO
For search engine marketing, a landing page is defined as the page your visitors land on (arrive at) when they click through from a search engine results page. As such, landing pages need to be focused on the keywords your visitors have used—that is, keywords relevant to what they are looking for—and be as close to the conversion point as possible. That way, you give yourself the best possible chance of converting your visitors into customers.
For paid search, controlling which landing page a visitor arrives at is straightforward: You enter the URL in your pay-per-click campaigns. For example, in AdWords, each ad group can have its own unique landing page relevant to the displayed advertisement. For all paid search campaigns, you need to append tracking parameters to your URLs. This is done automatically for you in AdWords, but you must apply this manually for other paid networks (see “Campaign Tracking” in Chapter 7).
Robots.txt
Not all pages on your site are relevant to search engine visitors, such as, for example, your privacy policy or your mission statement to be carbon neutral by the end of this year. Although both are laudable, unless they are a key aspect of your business, consider removing such pages from the search engine indexes—the file robots.txt is used to do this.
The use of robots.txt stops search engines from indexing pages on your website. If you have an existing page indexed and you add it to your robots.txt file as an exclusion, then over time it will be removed from the indexes.
For example, create a text file in the root of your web space named robots.txt with the following contents:
User-agent: *
Disallow: /images/
Disallow: /offer_codeY.aspx
This file tells all search engines that follow the robots exclusion standard (all the main ones do) to not index any files in the directory named /images or the specific file named offer_codeY.aspx. For more information on the robots exclusion standard, see www.robotstxt.org.
For nonpaid search (organic search), controlling landing pages is much harder to achieve because search engines consider all pages on your website when deciding which are most relevant to a visitor’s search query. If you describe a product on multiple pages, then any or all of the pages may appear in the search engine results. However, the highest-ranked page may not be your best-converting page. By optimizing the content of your best-converting page, you can influence its position within the search engine results, thereby gaining a higher position than other related pages from your site. Landing page optimization is therefore a subset of search engine optimization (SEO).
Principles of SEO and Landing Page Optimization
For both paid and nonpaid search visitors, you want to ensure that the landing page is as effective as possible—optimized for conversion—once a visitor arrives. That does not mean the visitor’s next step is necessarily to convert from this initial landing page; the landing page could be the beginning of the relationship, with the conversion happening much later or on a subsequent visit. By optimizing the content of your landing pages for a better user experience, you not only increase conversions for all visitor types but also improve your organic search engine rankings. Often the effects of this optimization process can be dramatic.
A key part of the optimizing process is understanding why visitors landed on a particular page of your website in the first place. The keywords they used on the referring search engine tell you this. Within Google Analytics you can view keywords for your top landing pages in a couple of ways:
- From the Traffic Sources Sources Search section, select the Organic or Paid report to view the respective keywords from each. Click a keyword, and select Landing Page as the secondary dimension.
- From the Content Site Content Landing Pages report, click a landing page and select Keyword as the secondary dimension.
Generally I prefer the latter: focusing on a landing page and viewing which search keywords led visitors to it. This method is referrer agnostic, meaning you cannot tell whether your visitors arrived on a particular landing page by clicking an organic listing or a paid ad. This difference is not important; a visitor arriving on your website by a well-targeted link (paid or nonpaid) should be just as likely to convert regardless of the referrer used.
For the optimal user experience, focus your landing pages on a particular keyword theme, such as a specific product or service. The exception to this would be your home page, which shouldn’t be used as a landing page except for your company or brand name keywords.
Note: Your home page is generally poor as a landing page for anything other than your company name. This is simply because by its very nature your home page is a generalist page that focuses on creating the right image, branding, and mission statements. Usually you will notice low conversion rates for this page, which is expected. Therefore, focus your efforts on your content pages.
Keyword theme is a term used in search engine marketing to describe a collection of keywords that accurately describe the content of a page. For example, if you sell classic model cars, keyword themes would center on particular makes and models, such as the following:
classic alpha romeo model car
replica model alpha romeo
classic alpha romeo toy car
Less-product-specific pages—for example, a category page—would use a less-specific keyword theme:
model cars for purchase
classic toy cars for sale
scale model cars to buy
As a rule of thumb, themes generally consist of 5 to 10 phrases per page that overlap in keywords (the preceding examples list three such phrases for each page). Having more than 10 overlapping phrases dilutes the impact and effectiveness of the page, from the perspective of both the user experience and search engine ranking. If you already have a page that targets more than 10 keyword phrases, consider creating a separate page to cater to the additional keywords.
At this stage I am assuming you have been through the process described earlier in this chapter under the heading “Identify and Optimize Poor-Performing Pages.” If not, do this first because it ensures that the user experience for each page is optimized; improving the user experience often reaps large rewards. Then, as an exercise, view your top 10 landing pages from your Content Site Content Landing Pages report.
For each page listed in the report, click through and select Keyword as the secondary dimension. Print out the top 10 entrance keywords and repeat this process for each of your landing pages. Visit your website and print out each of your top 10 landing pages. That gives you your top 10 landing pages with a list of the top 10 keywords associated with each.
Note: If your Keywords report for each landing page contains hundreds of table rows, it may be because it is poorly focused or targeted. Also, check the landing page URLs specified in your paid campaigns. Are they pointing to the most appropriate pages? If not, change them accordingly.
For each landing page URL, view the two corresponding printouts. Is the page content tightly focused on its listed Entrance Keywords report? This is quite a subjective process, though as a guide, if you read the first three paragraphs (or approximately the first 200 words) of your landing page and you don’t come across every one of your top 10 entrance keywords, then the page can be said to be unfocused. The extent of this is relative to the percentage of missing entrance keywords from those first paragraphs; for example, three keywords missed and you can say your page is 70 percent focused.
If you determine that a landing page is unfocused, revise its content, ensuring that all 10 of your top target keywords are placed within the first 200 human-readable words (that is, not part of the HTML syntax). Pay particular attention to placing keywords in your paragraph headings—for example, assuming a target keyword of “blue widget,” use a heading of <h1>Our blue widget selection</h1>.
Use Text to Display Text—Not Images
Machine-readable text is text that can be selected within your browser and copied and pasted into another document or other application such as Word or TextPad. If you cannot do that, then the text is likely to be a rastered image (GIF, JPG, PNG, and so on) or in another embedded format such as Flash. Often, design agencies prefer the image format when referring to a product or company name so that nonstandard fonts and smoothing or special effects can be applied. However, it is doubtful this has any impact on conversions over plaintext—if images are necessary, use them elsewhere on your pages—not as a substitute for text.
For SEO rankings, machine-readable text is king. The inappropriate use of images or other embedded content as headings will be detrimental to your SEO efforts. Search engines ignore images for ranking purposes, and embedded objects such as Flash can be only partially indexed. To mitigate this, it is good practice to include an alt tag (alternative text attribute) for each image to improve the usefulness of your document for people who have reading disabilities. However, it has very little positive impact on search engine ranking. Therefore, where possible, use HTML and CSS to style your text because these are the right tools for the job. Use images to display pictures and Flash for movie or animation effects.
Other prominent areas where you should place your target keywords that are not visible on the page include the title tag and description metatag. Using the same keyword examples, these could be written as follows:
<title>Purchase blue widgets from ACME Corp</title>
<meta name="description" content=" ACME Corp, the blue widgets division
of BigCorp, is a US sales and support channel
for the industry-leading blue widget package." />
Page title tags are visible by reading the text in the title bar at the top of your browser (usually blue in Windows, silver on a Mac), but visitors generally do not read this on your page because it is located above the browser menu and navigation buttons—separately from your content. However, the title tag is the same text that is listed as the clickable link on search engine results pages and is therefore very, very (deliberate double emphasis) important for SEO ranking purposes. Ensure that each page has a unique title and description tag relevant to its content, with its most important keywords included.
A best practice tip is to also include your target keywords within call-to-action statements and make them hyperlinks to the beginning of a goal process—an Add to Cart page, for example. This is illustrated with the following text examples (the hyperlink text is underlined italic):
Bad SEO example To purchase and get a free gift click here.
Good SEO example Purchase blue widgets and get a free gift with your first order.
The second example contains three important elements that have proven to be many times more effective than the first (see “An Introduction to Google Website Optimizer,” later in the chapter, for ways to test this hypothesis):
- The call-to-action statement contains the target keywords.
- The call-to-action keywords are highlighted as a hyperlink.
- The hyperlink takes the visitor to the start of the goal conversion process.
The techniques described here for optimizing and focusing your landing pages will undoubtedly increase your conversion rates and decrease page bounce rates regardless of visitor referral source. In addition, as a consequence of improving the user experience, such changes also have a significant and positive impact on your search engine rankings. Therefore, once you have optimized the top 10 landing pages, move on to the next 10.
From a paid search point of view, you need to ensure that campaigns point to one of these optimized landing pages—or create new ones. The worst possible thing you can do is use your home page as the landing page. If you take away only one lesson from this section, it should be to avoid this mistake!
A Note on SEO Ethics
When optimizing your landing pages to place keyword phrases in more prominent positions, always consider the user experience. Overly repeating keywords or attempting to hide them (using CSS or matching against the background color, for example), though not illegal, will inevitably result in your entire website being penalized in ranking and possibly removed from search engine indexes altogether—and this can happen at any time without warning, even years later.
Although it is possible to get back into the search engine indexes once you have removed the offending code, this can be a long, drawn-out process that damages your reputation. Essentially, spamming the search engines is not going to win you any friends, either from your visitors or the search engines themselves, so avoid it.
Summary of Landing Page Optimization and SEO Techniques
Optimizing landing pages for better performance is a complicated business; indeed, it’s a specialized branch of marketing. However, here is a 10-point summary for you to follow that will give you a solid start:
- Always put your visitors and customers first; design for them, not search engine robots.
- Use dedicated landing pages for your campaigns, for both paid and nonpaid visitors.
- Ensure that landing pages are close to the call to action.
- Structure your landing page content around keyword themes of 5 to 10 overlapping keywords and phrases.
- Place your keyword-rich content near the top of the page, that is, within the first 200 words. Think like a journalist writing for a newspaper, with structured titles, headings, and subheadings that contain keywords.
- Use keywords in your HTML <title> tags.
- Use keywords in your anchor links—that is, HTML <a> tags.
- Avoid placing text in images or Flash or other embedded content.
- Use a robots.txt file to control what pages are indexed by search engines.
- Never “keyword stuff” or attempt to spam the search engines; it’s not worth it, and you can achieve better results by legitimate means.
If you have completed all 10 steps and are still thirsting for improvement (pages can always be improved), consider testing alternative page elements, as discussed in “An Introduction to Google Website Optimizer” later in this chapter.
Note: It’s important to recognize that I have attempted to cover only the principles of SEO. Many factors affect your search engine rankings. The more important ones are page content (keyword density, keyword prominence), site architecture, internal link structure, and the number and quality of incoming links from other websites—including social network sites. For further in-depth reading on the subject, see Search Engine Optimization (SEO) Best Practice Guide by Jake Hird et al. (Econsultancy, 2011); Search Engine Marketing, Inc.: Driving Search Traffic to Your Company’s Web Site by Bill Hunt and Mike Moran (IBM Press, 2008); and Search Engine Optimization: An Hour a Day, by Jennifer Grappone and Gradiva Couzin (Wiley, 2011).
AdWords Day Parting Optimization
By knowing at what time of day visitors are accessing your website, you can better tailor your advertising campaigns to match. For example, if you are a business-to-business website, then most of your visits will probably occur during normal working hours. Rather than display your ads in equal distribution throughout the day, it would make sense to run and maximize your pay-per-click campaigns at around the same time your potential audience is looking on the Web.
Other examples of day parting optimization include targeting magazine readers, who are likely to be online in the early evenings; targeting social networking sites, whose potential audience is most likely to be online from 5:00 p.m. to 1:00 a.m.; and coinciding with radio and TV advertisements, where remembering your website URL can be difficult and so the interested audience may subsequently conduct a search to find your site.
By viewing hourly reports, you can view the distribution of your visitors throughout the day. Hourly visitor reports are available in the Advertising AdWords Day Parts report (see Figure 11-21). Of course, time zones should be taken into consideration. For example, if your audience is global, ensure that your reports are first segmented by location—a proxy for time zone.
As with all data analysis, it is important to avoid looking at short time frames such as a single day. Visitors over short periods can vary significantly and randomly, making reports difficult (if not impossible) to interpret. Instead, select a longer period and ensure that the date range includes relevant days of the week for you. For a business-to-business website, for example, select Monday to Friday, or use Friday to Sunday if your target audience is more likely to be looking for your products or services in their leisure time. In addition, try to choose a discrete day range—one that does not overlap with national holidays if that would affect your visitor numbers. Whatever business you are in, also compare weekend visitors to weekday visitors because this can reveal surprising insights.
Figure 11-21: Viewing hourly reports for day parting optimization

From Figure 11-21, which is a business-to-business website with no day parting optimization, you can see that there are very few visitors in the early morning (midnight until 7:00 a.m.), significant numbers climbing to a peak just before lunchtime, a large drop during lunch, and then a steady decline in traffic until the end of the working day around 6:00 p.m. If you have e-commerce reporting enabled, also compare your day parting visitor information with when transactions take place: Go to the E-commerce section (refer to label M of Figure 4-4 to locate this).
Use this information to optimize your paid campaigns by setting ads to display on or around these periods, both when visitors are in a research frame of mind (just visiting) and when they are ready to purchase. Figure 11-22 shows you how to achieve this within the AdWords Ad Schedule page. Not only can you schedule when your ads are displayed, you can also vary your bids for ads on a given time or day. For example, if your default bid is $1.00, you can set a custom percent-of-bid entry for Tuesday from midnight until 7:00 a.m. at 10 percent—that is, your bid for Tuesday only prior to sunrise would be $0.10. By this method, you would be spending money on acquiring paid visitors at periods when they are most likely to be looking and purchasing and at a price that is most advantageous to you. You can customize any day or time period in this way, using 15-minute intervals.
Figure 11-22: Ad scheduling within Google AdWords
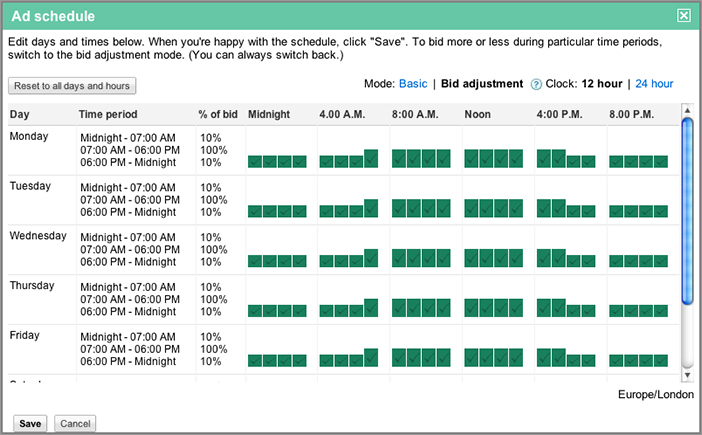
Time Zone Considerations
To take advantage of day parting reports, ensure that your paid campaigns are specific to a particular time zone. For example, don’t mix your paid campaigns by displaying the same ad to both a US and a UK audience. Time zone settings for AdWords are on a per-account basis. If you have audiences in very different time zones, then create separate AdWords accounts for them.
You can configure time zone settings for Google Analytics on a per-profile basis. However, if you link your Google Analytics account to your AdWords account as described in Chapter 6, then your AdWords time zone and country settings take precedence and you cannot realign them within Google Analytics.
If time zone and other regional specifics (language, currency) are important for you, the best practice advice is to use a one-to-one relationship of Google Analytics and AdWords accounts. You can run an aggregate Google Analytics account by adding an additional GATC to your pages (see the section titled “Roll-up Reporting” in Chapter 6).
AdWords Ad Content Optimization
When creating your pay-per-click campaigns in AdWords, how do you know whether one ad creative is more effective at generating click-throughs than another, similar ad? For example, is the headline “Blue suede shoes” better for you than “Turquoise suede shoes” or “Unique suede shoes”? Of course, you don’t know the answer to this, and that’s the point: No one does. It’s up to your audience to decide. Even after you know the answer, it’s like the English summer weather: It can still change quickly and without warning. To determine which ad performs best, use ad content testing.
Ad content testing is a method used by pay-per-click networks that enables you to display different ad content for the same target keywords. Within Google AdWords, the method is known as Ad Rotation and there are three ways in which your ads can be rotated:
Rotate Evenly Ads can be rotated in approximately equal proportion to a random selection of visitors—for example, five ads each showing 20 percent of your total impressions. The proportion is approximate because the ad serving favors ads with higher historic click-through rates and quality scores. For more information on AdWords quality scores, see
http://adwords.google.com/support/bin/answer.py?answer=21388
If you are experimenting with the design and content of your landing pages, use this option to ensure that you measure the impact of your landing pages changes.
Optimize For Clicks You can allow AdWords to optimize the display of your ads, favoring the better-performing ones by showing more impressions of the ad that receives more click-throughs. If your landing pages are optimized, select this option to receive the best traffic volumes for your ads.
Optimize For Conversions Show ads expected to provide more conversions. Use this if you have an e-commerce site or a well-defined conversion goal for your AdWords visitors.
My recommendation is to select your ad rotation options in the order shown in the preceding list. That is, first start with setting your ads to Rotate Evenly. Use the resulting visit data to optimize your landing pages. When you are satisfied that your landing pages are performing well, switch your ad rotation setting to Optimize For Clicks. Use this data to understand the visitor engagement differences between your ads. For example, do visitors from one ad spend more time on site, view more pages per visit, complete more goals than from another ad to the same landing page? In particular, do your visitors complete more than one goal, and which are the highest-value goals? It may be that ads that generate the highest number of click-throughs do not necessarily generate the most engagement. That is, you may be receiving more visitors, but of a lower quality.
Figure 11-23 shows the result of using four different ad contents for a specific ad group. To obtain this report, go to the Advertising AdWords Campaigns report. Drill down by clicking a particular campaign, then click one of its ad groups. By default, the keywords report will show in the table. Select Ad Content instead, as shown in Figure 11-23.
Figure 11-23: The performance of different ad content for the same targeted keywords
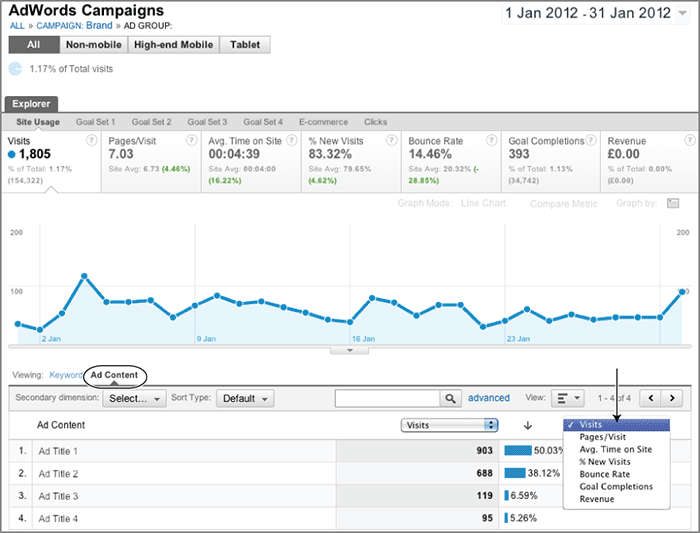
As you can see in Figure 11-23, the Ad Title 1 ad is receiving the vast majority of click-throughs from AdWords (set to Optimize For Clicks for this example). From the drop-down menu shown, view other metrics for each ad version. In addition to the Site Usage report, you should view the ad content data in your Goal and E-commerce sections (refer to Label M in Figure 4-4 if needed).
For example, it may be that Ad Title 1 is better for visitor acquisition, but when it comes to visitors interacting with your website, perhaps Ad Title 2 converts better and generates more revenue. If that is the case, then take advantage of this discrepancy and create separate ad groups for each so you can run separate bidding strategies.
Assuming the Goal and E-commerce reports show a trend similar to that in Figure 11-23, you can then either disable (pause) the remaining ad versions and focus all your pay-per-click efforts on Ad Title 1 or switch to Optimize For Conversions, as discussed next.
Warning: Each of the AdWords ad content variations shown in Figure 11-23 has a unique headline (Ad Title). This is defined when you create your ad and is what Google Analytics uses to differentiate ads for the same keywords. Note that it is not yet possible to report on ad variations that use the same headline, differing only in body text. Turning off AdWords auto-tagging and attempting to use manual tracking parameters will not work as an alternative.
Ad Content Optimization for Other PPC Networks
Google Analytics tracks different AdWords ad content with no additional configuration required. Ad content results appear automatically in your reports as long as you have the Google Analytics auto-tagging box checked within your AdWords account (see Chapter 6).
To track ad content for other paid referral sources, such as Yahoo! Search Marketing and Microsoft adCenter, you need to add tracking codes to your landing page URLs as discussed in Chapter 7 in the section “Campaign Tracking.” Specifically, the utm_content parameter is required to differentiate ad versions.
When to Set Optimize for Conversions
The reason for going through a second step rather than directly to Optimize For Conversions, which you might assume is the best option, is because the result of Optimize For Conversions is very black and white—either a visitor converts or not. Other engagement metrics, such as time on site, bounce rate, time on page, and so forth, are not taken into account. Also, the goal or transaction amount is not considered when serving the ad—just the conversion rate (though the goal and transaction amount is displayed in your AdWords Conversion Tracking reports). These values become important if you have a wide range of values and prices on your site. Optimize For Conversions has no sense of your website value.
If you are an e-commerce site with a narrow range of prices, say within ±50 percent of your average order value, it can make sense to jump straight to Optimize For Conversions after optimizing your landing pages. After all, that is where the money is! To do so requires conversion tracking to be set up in your AdWords account. This is a straightforward import from AdWords, as shown in Figure 11-24.
Note that a goal will be imported only if it has registered at least one conversion in Google Analytics that can be attributed to AdWords. This can be a little bit complicated if you have multiple AdWords accounts linked to Google Analytics because in order for a goal to be imported to multiple AdWords accounts, each of those accounts must have registered at least one conversion from that AdWords account. This is another reason you should use one of the other ad rotation methods first, before switching to Optimize For Conversions.
For Optimize For Conversions to work, you need to have at least 30 conversions in the last 15 days. If there isn’t sufficient conversion data to determine which ad will provide the most conversions, ads will rotate using Optimize For Clicks data. For more information about AdWords ad rotation settings, see
http://support.google.com/adwords/bin/answer.py?hl=en&answer=112876
Figure 11-24: Importing Google Analytics goal settings into your AdWords account: (a) initial import screen, (b) setup and confirmation screen
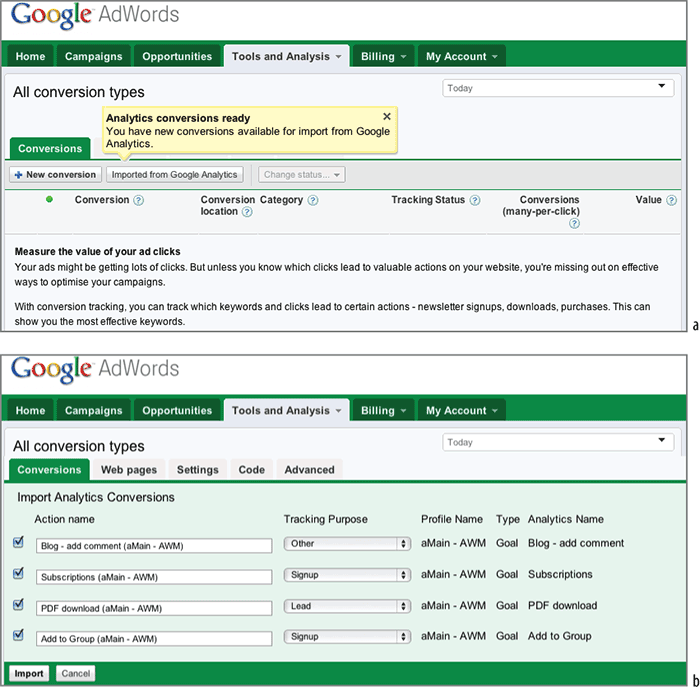
As an aside, you can also use ad version testing for non-pay-per-click campaigns by using the utm_content tracking parameter. For example, if you use a mix of banners for a display campaign, you could test the effectiveness of different formats such as header versus skyscraper or static versus animated. You achieve this by appending utm_content values to the landing page URLs on the banners, such as, for example, utm_content=flash or utm_content=static. If you use the utm_campaign tracking parameter in this way, then also take advantage of using the other campaign tracking parameters available to you (see “Campaign Tracking” in Chapter 7).
Factors to Be Aware of When Importing Your Google Analytics Goals
Depending on when a Google Analytics goal becomes available for AdWords import, AdWords will grab the goal name at that point in time. Therefore, if your Goal was named My Goal 1 and later changed to My Different Goal 1, you may see My Goal 1 when you attempt the import. Once the goal is imported, mouse over the Tracking Status comment bubble to view the Google Analytics goal name and profile so you can verify which goal is which. If you are not happy with the imported goal name, or it has subsequently been redefined in Google Analytics, delete the imported goal and manually configure it by clicking on the + New Conversion button, shown in Figure 11-24a.
If an imported goal is deleted, you will not see it available for import again because technically it has already been imported.
Imported goals can have up to a 48-hour delay. So even if you have registered a conversion for that goal that is attributed to AdWords, it may be 48 hours before you can import that goal into AdWords.
Monetizing a Non-E-commerce Website
For non-e-commerce websites, understanding and communicating website value throughout your organization are key to obtaining buy-in from senior management. After all, you want to make changes to improve your bottom line, but without an associated dollar value, that can be difficult to achieve. By gaining executive support, you will be able to procure investment for content, infrastructure, and online marketing. The problem is that many executives’ eyes glaze over when they see yet another set of charts on visitor metrics. “Our site doesn’t sell anything, so who cares?” is a common response, and you’ll need to address this head on or face a very frustrating job role. Identifying the monetary value of your visitor sessions is a proven way to get executive attention, and it can help keep the company website from becoming just someone’s pet project.
Google Analytics provides two mechanisms for demonstrating website monetary value:
- Assigning goal values
- Enabling e-commerce reporting for your non-e-commerce site
The key to both approaches lies in knowing the value of website goal conversions to your business. For example, if a PDF brochure is downloaded 1,000 times and you estimate that one of these downloads results in a customer with an average order value of $250, then each download is worth $0.25 ($250/1,000). If 1 in 100 downloads converts into a customer, then each PDF download is worth $2.50 to you, and so on. Therefore, to attain a monetary value for each goal, you need to ask two fundamental questions: How many goal conversions are required to create a customer, and what is the average lifetime value (LTV) of a customer?
The Google Analytics Conversions Goals Overview report shows how many conversions you get to each of your site goals. From this, you’ll need to estimate the percentage of goal conversions that result in paying customers. To get the process started, if a visitor’s goal conversion provides personal information, such as name and email address, that you can later use as a sales follow-up, I guesstimate 10 percent of these will result in a sale. If no personal information is provided—for example, a visitor clicking a PDF download link—I use 1 percent for my guesstimate of sales. These are just initial guesstimates to start off the conversation with your organization’s sales team. This process is not an exact science, and you’ll be able to fine-tune later as you collect more information. However, aim to get these numbers formalized within a quarter—if you don’t and they continue to change, you will not be able to compare long-term trends.
Determining the average value of a customer should be more straightforward. Assuming a customer attributed as a lead from your website has the same value as any other customer, simply ask your sales team for the average LTV of your customers. However, for non-retail businesses, the LTV may not be known. If your business is new or your average customer lifetime is particularly long or difficult to obtain, use the average revenue generated in 12 months per customer as your LTV.
Once you can estimate the value of each of your site goals, it is straightforward to monetize your website—as described next.
Tip: If you are struggling to estimate goal values, start off the process by first evaluating your least-significant goal. Give this a value of 1 (as with assigning all goals in Google Analytics, the actual amount is unitless—the symbols $, £, €, and the like are labels). For more valuable goals, use a multiple of the least valuable one. For example, if your least valuable goal is a PDF download and your next more valuable goal is a subscription request that is five times more valuable to you, then assign goal values of 1 and 5, respectively.
Approach 1: Assign Goal Values Method
This is the simplest of the approaches and requires little or no changes to your website pages. As such, the control of these values is in the hands of the marketers—the best place for them in my opinion! The caveat, however, is that with simplicity comes a lack of flexibility. That is, goal values are fixed on a per-goal basis, though event tracking has a little more flexibility.
Consider that every site has at least one goal; quite often it has several. For a non-e-commerce site there can be PDFs and other files to download, video demonstrations and interviews, brochure requests, quote requests, subscription signups, registrations, account logins, blog comments, social media shares (Tweet, Like, Google +1, and so forth), content ratings, printouts—even the humble mailto: link (email address link) can be considered a goal and tracked with Google Analytics.
With your goals defined, assigning a goal value is straightforward. Essentially, all that is required is for an amount (the goal value) to be assigned when the goal is triggered. As described in “Goal Conversions and Funnels” in Chapter 8, there are four goal types:
- URL destination
- Time on site
- Pages per visit
- Event
For the first three, the goal value set is a constant value that is applied to all goal completions. For example, if you determine that a subscription confirmation page is worth $5, then this amount is applied to all subscriptions—even though some subscriptions may be more valuable to you than others. Event tracking is slightly different. In addition to being able to set a constant goal value, you can specify a value at the point when the event is set—so the value can vary for each goal event triggered (see “Event Tracking” in Chapter 7).
Adding values to goals enables you to gain additional metrics in your Google Analytics reports, such as the average per-visit goal value ($/Visit) as shown in the Traffic Sources section—select a goal set from the report sections (refer to label M in Figure 4-4 if required). In addition, you can view individual and total goal values in the Conversions Goals Goal URLs report.
Assigning goal values is a fundamental configuration step and a prerequisite for understanding the value of your nontransactional website. However, you obtain far more detailed reporting by using the technique outlined in the second approach.
Approach 2: Pseudo E-commerce Method
By setting up your nontransactional site as an e-commerce website in Google Analytics, you’ll be able to do the following things that are not possible with the Assign Goal Values method:
- Have an unlimited set of goals. Without this goals are limited to 20.
- See the amount of time and number of visits it takes for visitors to convert (see the following sidebar note).
- View a breakdown of how much each “product” (goal) contributes to your website revenue.
- Group goals into unlimited categories. Without this, goals are limited to four categories (goal sets).
- List specific “transactions”—that is, individual goals, rather than collective goals as for the Assign Goal Values method (individual file downloads, for example).
Note: For the Assign Goal Values method, you can view the amount of time and number of visits to conversion using the Conversions Multi-Channel Funnels Path Length report. However, there is a current limitation with the report in this respect—you can view these metrics only on an individual goal basis. That is, you cannot roll up all goals to view them as an aggregate whole. The Conversions E-commerce Time to Purchase report does not suffer this limitation.
Here is an example to illustrate the last bullet point and the capability the expanded reports will give you. Imagine you are a publisher of content with hundreds of file downloads available. These could be software programs, music files, video downloads, podcasts, or a PDF library, for example. Perhaps you also have multiple subscription types. By enabling e-commerce tracking, more detailed, richer reports are available to you. The caveat, however, is that this method does require changes to your GATC and therefore is more technical—that is, in the hands of your web development team.
Figure 11-25 is an example for a file download catalog site. Note there are a total of 96 different files (products), grouped into categories and monetized. Using this approach, you gain additional aggregate information as well as more specific goal and goal-conversion information. How this is achieved is discussed next.
Figure 11-25: An e-commerce report for non-e-commerce goals (file downloads)

Tracking a Non-E-commerce Site as Though It Were an E-commerce Site
The following examples were developed for the corporate website of a global industrial manufacturer. Beyond content updates, investment in the website had trailed off a number of years ago because no one in the organization considered it an opportunity—more of a dot.com necessity. Monetizing visitor actions and hence monetizing the visitors themselves reinvigorated senior executive interest and allowed the digital manager to seek additional budget for further development.
Note: Before continuing with this section, it’s a good idea to review the section “Tracking E-commerce Transactions” in Chapter 7.
Generating Unique Order IDs
In all of the pseudo e-commerce examples given, it is important that you assign a unique order ID to each transaction. An e-commerce system would do this for you automatically. However, here you will need to apply some additional code on your pages. Add the following just above the </head> HTML tag of each page that you are tracking with e-commerce fields:
<script type="text/javascript">
function getOrderID(){
 // generate a random order id
 var randomnumber = Math.floor(Math.random()*1000);
 var current = new Date();
 var month = current.getMonth()+1
 var timeStamp = current.getFullYear() +month +current.↵
  getDate() + "-" +current.getHours() + current.getMinutes()↵
  + current.getSeconds() +"-" + randomnumber;
 return(timeStamp);
}
</script>
With this in place, when the goal page is loaded, a unique order ID is generated of the form YYYYMMDD-hhmmss-XXX, where XXX is a random number between 0 and 999. This provides tracking of up to 1,000 orders per second and enables you to keep order IDs in a logical structure that can be searched for later within the reports. If you receive significantly fewer than 1,000 orders per day, you can simplify the order ID by removing the hhmmss element.
With the script in place, generate an order ID by calling the JavaScript function getOrderID(), as shown in the examples.
Essentially, the approach is to tag each goal page with e-commerce tracking information. In summary, the e-commerce fields are a comma-separated set of values as follows:
_gaq.push(["_addTrans", "OrderID", "Affiliate", "Total amount",↵
"Tax amount", "Shipping amount"]);
_gaq.push(["_addItem", "OrderID", "SKU", "Product name","Category",↵
"Unit price","Quantity"]);
Some of the e-commerce fields will be left blank. For example, assume that one of your goals is for a visitor to click a mailto: link. Visitors who click this do not require any tax or shipping amounts to be calculated, so you will not be entering anything for this particular e-commerce field.
There are two steps for implementing this technique: first, defining the e-commerce field values for your goals, and second, calling the function _trackTrans so that Google Analytics tracks these when the goal is completed. The following are example goals that we’ll track with e-commerce fields:
- Pseudo e-commerce for a mailto: goal
- Pseudo e-commerce for a file download goal
- Pseudo e-commerce for a form-submission goal
- Pseudo e-commerce for multiple file-goal downloads
Step 1: Defining Your Pseudo E-commerce Values
For each example, add the e-commerce fields to the page with the goal to be tracked. You must place this after your GATC:
Pseudo e-commerce fields for an email click-through goal Add the following e-commerce fields to the page with the mailto: link to be tracked:
<script type="text/javascript">
   orderNum = getOrderID();
   _gaq.push(["_addTrans", "orderNum", "", "1", "", ""]);
   _gaq.push(["_addItem", "orderNum", "[email protected]", ↵
   "Email link", "General inquiries", "1", "1"]);
</script>
As you can see, several e-commerce fields are blank—you do not require the tax and shipping amounts for someone who simply clicks your email link. A value of $1 and a quantity of 1 have been assigned and categorized under General Inquiries.
Pseudo e-commerce fields for a file download goal In this case, I have used a PDF file as the example. Add the following e-commerce fields to the page with the download link to be tracked:
<script type="text/javascript">
   orderNum = getOrderID();
   _gaq.push(["_addTrans", "orderNum", "", "10", "", ""]);
   _gaq.push(["_addItem", "orderNum", "brochure-2012.pdf", ↵
   "PDF Brochure", "Download", "10", "1"]);
</script>
Here, a PDF download has been categorized as Download and given a value of $10; the quantity remains 1. Note that I have used the filename for the SKU value. If you have multiple PDF files on the same page, then you could categorize them and value each differently, perhaps by language or by content. This is discussed as a special case in the section “Special Case: Pseudo E-commerce Fields for Multiple File Downloads.”
Pseudo e-commerce fields for a form submission goal Add the following e-commerce fields to the page with the form submission to be tracked:
<script type="text/javascript">
   orderNum = getOrderID();
   _gaq.push(["_addTrans", "orderNum", "", "50", "", ""]);
   _gaq.push(["_addItem", "orderNum", document.location.pathname, ↵
   "Form submission", "Subscriptions", "10", "1"]);
</script>
This example assumes a value of $50 per form submission with a quantity of 1 and categorized under Subscriptions. Note that I have used the form page path and file filename for the SKU value.
Step 2: Calling the Function _trackTrans
With your e-commerce fields in place on the pages that contain goals, the second part of the implementation is to decide how to get these values into Google Analytics. This is done using the JavaScript call to the _trackTrans function. For the preceding three examples, use the following calls:
Email click-through goal
<a href = "mailto:[email protected]" onClick = "_gaq.push(['_trackTrans']);">
File download goal
<a href = "brochure-2012.pdf" onClick = ↵
  "gaq.push(['_trackPageview, '/downloads/brochure-2012.pdf']);
  _gaq.push(['_trackTrans']);">Brochure 2012</a>
Form submission goal
<form action = "formhandler.php" onSubmit = "_gaq.push(['_trackTrans']);">
Note the use of _trackPageview for the second example. This is not directly related to what we wish to achieve, but it should be used as a best-practice technique—that is, capturing the PDF download as a virtual pageview. For more details on virtual pageviews, see “_trackPageview: the Google Analytics Workhorse” in Chapter 7.
Special Case: Pseudo E-commerce Fields for Multiple File Downloads
The preceding file-download example is a simplified case that is useful to illustrate the method. However, if file downloads are important to your website performance, then it is highly likely you will have multiple links to downloads on the same page and the visitor may “purchase” many of them while on that page. This is a special case because the e-commerce event handler needs to be called for each file download link. That way, each click on a download link receives a different transaction ID. This is an important requirement because you cannot have multiple items for a single transaction by this method—after all, this is not a real shopping cart. To overcome this limitation, use the following format for each download link:
<a href = "brochureA-2012.pdf" onClick =
  "gaq.push(['_trackPageview, '/downloads/brochureA-2012.pdf']);↵
  orderNum=getOrderID();
  _gaq.push(["_addTrans", "orderNum", "", "10", "", ""]);
  _gaq.push(["_addItem", "orderNum", "brochureA-2012.pdf", ↵
  "PDF Brochure", "Download", "10", "1"]);
  _gaq.push(['_trackTrans']);">Brochure A 2012</a>

<a href = "brochureB-2012.pdf" onClick =
  "gaq.push(['_trackPageview, '/downloads/brochureB-2012.pdf']);↵
  orderNum=getOrderID();
  _gaq.push(["_addTrans", "orderNum", "", "5", "", ""]);
  _gaq.push(["_addItem", "orderNum", "brochureB-2012.pdf", ↵
  "PDF Brochure", "Download", "5", "1"]);
  _gaq.push(['_trackTrans']);">Brochure B 2012</a>
Here, for the same page, two PDF downloads have been categorized and given values of $10 and $5, respectively. If a visitor clicks both of these files (or repeatedly clicks the same file), then each is tracked as a separate transaction because the function getOrderID() is called on each occasion. Assuming there is a minimal delay in loading the HTML page in question, the transaction IDs for these two files will be very similar—for example, varying only in the ss-XXX part of the string YYYYMMDD-hhmmss-XXX.
Approach 2 Provides Significant Benefits
By enabling pseudo e-commerce reporting on your non-e-commerce website, you can see at a glance the referring sources that lead to specific product “purchases,” time to purchase, visits to purchase, average order value, which keywords convert best, and more.
If you were to use the first approach only, you would need to navigate to each goal page and determine the information separately—and that can be quite tricky with 500 PDF white papers, 10 application downloads, 3 mailing list subscriptions, 2 quote request forms, and a contact-us form!
Having a unified metrics system that can report on key performance indicators from the Web, print, display, radio, and TV—all in one place—and one that can track the correlation between all visitors who start in one channel and cross over into others before converting has been a long-sought analytics nirvana for many a marketer.
Some vendors have attempted to achieve such a system, with varying degrees of success. The barriers of technical difficulty (bringing information from disparate systems together) and issues with data alignment (for example, how do you compare a web visitor who has specifically searched for information to a passive TV viewer?) mean that, to date, few organizations have made such a high-cost and resource-intensive investment.
However, vendors are making many inroads to overcome these difficulties. The open-source nature of Google’s application programming interface (API) model for making data accessible goes some way toward making this happen. Google APIs include AdWords, Google Maps, Google Earth, and Google Analytics. With an API, Google Analytics users are able to stream their data directly out and into their own applications—and potentially in the future to import data back into Google Analytics. This could be as simple as real-time updates to KPI tables in Excel or the merging of web data with CRM data. The use of the Google Analytics Core Reporting API is discussed in Chapter 12.
Note: This section assumes you have a strong understanding of Google Analytics Campaign Tracking as described in Chapter 7 and that you understand the principles of URL redirection.
Even without a complete one-stop unified metrics system (will one ever exist?), there is a great deal you can do to track your offline marketing efforts. I explain five such methods here. All are based on the central idea of combining offline campaigns with unique landing page URLs:
Vanity URLs Recommended when you have strong product brand awareness, with all web content hosted on a single central domain. Examples include Galaxy S, iPad, Castrol, Gillette, Colgate, Aquafresh, Big Mac, Fanta, Snickers, and so on. Requires a technical setup of redirects.
Coded URLs Recommended when you have a strong company brand or when your products already have separate websites. Examples include IBM, Microsoft, Google, Kellogg’s, Kodak, BMW, and any product that relies on model numbers for identification, such as cell phones, cars, printers, and cameras. Requires a technical setup of redirects.
Combining with search Recommended when your brand values are less significant than your product or service values or your target audience is more price oriented than brand oriented. Examples include the vast majority of small to medium-size businesses, the travel industry, the insurance sector, utilities, groceries, and office supplies; that is, industries where there is little brand loyalty. No technical setup required.
Combining with URL shorteners Recommended only for print campaigns and where many links may be required within the same campaign, document, or article. Examples include the publishing industry (newspapers, magazines), white papers, catalogs, and brochures. No technical setup required.
Combining with Quick-Response (QR) codes Recommended only for print campaigns where you wish to engage with a mobile audience. Examples include the publishing industry (newspapers, magazines), billboard advertising, posters, flyers and handouts, and business cards. No technical setup required.
Note: The example names given for tracking offline visitors are for brand recognition only. They do not reflect the actual website architecture or strategies of the sites in question.
Using Vanity URLs to Track Offline Visitors
If your website content is held at www.mysite.com and you have a strong product brand that has greater awareness than your company brand, consider using a vanity URL of www.myproduct.com for your offline campaigns such as television, radio, and print. Use your website (www.mysite.com) only to promote via online marketing.
Clearly, you don’t want to build two separate websites to promote to offline and online audiences. Their needs are the same; the only difference is how they find your website. Apart from the resource overhead, you should not build duplicate pages because the search engines will penalize you for this.
To avoid duplicate content, apply permanent redirects to your vanity URLs, such as www.ProductSiteA.com. Redirects on your web server capture the different URLs used by your offline visitors, append tracking parameters, and then automatically forward them through to your main content website, such as www.MainWebsite.com. The process takes a small fraction of a second to perform and shows no visible difference to your offline visitors. They type in a vanity URL (www.ProductSiteA.com) and arrive on your official website (www.MainWebsite.com) with tracking parameters appended. In effect, you are pretending to have product-specific websites for your offline visitors, using this to differentiate, and then redirecting them to your actual content. Schematically this is shown in Figure 11-26.
Figure 11-26: Schematic representation of using vanity URLs to track offline visitors

With a redirect in place, you can view offline visitors by identifying the campaign variables used. I illustrate the approach in Figure 11-27, using a fictitious example for Apple. I have assumed that for its products Apple uses ipod.com and iphone.com for all print campaigns, with all content actually hosted on its main apple.com website. The redirects add the following campaign parameters:
utm_source=Print&utm_medium=Print&utm_campaign=iphone5%20launch
utm_source=Print&utm_medium=Print&utm_campaign=ipod%20classic
Note: Although I use Apple as a fictitious example, it is actually using this technique. However, Apple is not a Google Analytics user, and hence it uses different campaign tracking parameters for its redirected URLs.
Figure 11-27: Fictitious example of Apple using vanity URLs to track offline visitors

You can then view the performance of all offline print ads in your report where medium is set to Print. An example of what such a report looks like is shown in Figure 11-28.
Figure 11-28: Fictitious visit details from an offline (print) campaign tracked using a vanity URL and redirect

Technical Details of Using Redirects for Vanity URLs
Redirects are an important aspect of using vanity URLs because they avoid any duplicate content issues (bad for SEO) and allow campaign variables to be appended to the final URL destination.
Two types of redirects are possible: permanent (status code = 301) and temporary (status code = 302). From a search engine optimization point of view, it is important to apply permanent redirects so that the final destination URL is the one that is indexed by the search engines; otherwise, the search engines ignore the content.
The following is an Apache example of redirecting the vanity URL www.myproduct.com, used only for print campaigns, to the official web address containing the actual content, www.mysite.com. The rewrite code is placed in the virtual host configuration section for www.myproduct.com in the httpd.conf file. Other web servers use a similar method:
<VirtualHost>
 ServerName www.myproduct.com
 RewriteEngine on
 RewriteCond %{HTTP_USER_AGENT} .*
 RewriteRule .* http://www.mysite.com/?utm_source=magazineX↵
 &utm_medium=print&utm_campaign=March%20print%20ad [R=301,QSA]
</VirtualHost>
The rewrite code requires the mod_rewrite module to be installed. Most Apache servers have this by default (see http://httpd.apache.org/docs/mod/mod_rewrite.html). Ensure that the RewriteRule is contained on one line within your configuration file (up to and including QSA]), and if spaces are required, use character encoding (%20).
In this example, Google Analytics campaign variables are used so that you can uniquely identify the offline campaign. These are then permanently passed on to the official website using the Apache mod_rewrite option. The query string append (QSA) ensures that any other query parameters are also redirected. After a redirect takes place, you should see your campaign variables in the address bar of your browser. If not, the redirect has not worked correctly, and this will need to be resolved.
Using the Vanity URL in Other Offline Campaigns
For the example redirect given, the offline visitor can be identified in your Google Analytics reports anywhere the source, medium, and campaign variables are displayed. In this case, the source is “magazine,” the medium is “print,” and the campaign is “March print ad.” This is effective when the only offline campaign running is a print ad, that is, you can redirect to only one place at a time. If this vanity URL is required for other offline campaigns running at the same time (TV, radio, other print campaigns), then change the utm_source, utm_medium, and utm_campaign tracking variables to the generic text “offline.” You then track your offline marketing in aggregate.
Using vanity URLs for managing offline campaigns is very effective, assuming you have multiple domains to use and the product you are selling is not trademarked or protected by someone else, preventing you from using it as part of a domain. Don’t use this method if you already have your products hosted on separate websites—see the following section on using coded URLs.
Using Coded URLs to Track Offline Visitors
If there is greater awareness of your company brand than of your products, then consider using coded URLs within your offline campaigns. These are of the following form:
www.MainWebsite.com/offer1
www.MainWebsite.com/offer2
Coded URLs are unique to your offline campaigns; they are not displayed anywhere on your website and are not visible to the search engines. That means your content should be visible to the search engines, but this will be via a different online-only URL such as www.MainWebsite.com/productX. See Figure 11-29.
Figure 11-29: Schematic representation of using coded URLs to track offline visitors
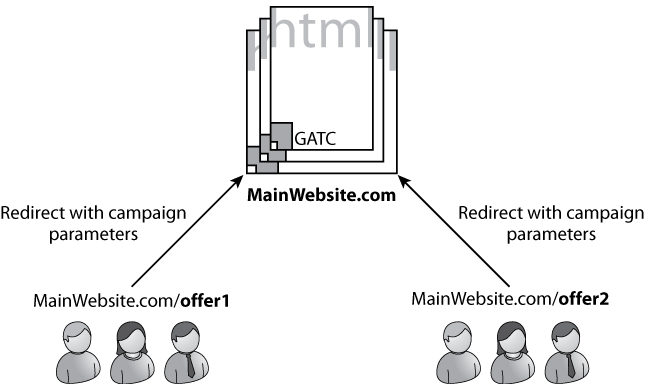
By using coded URLs in your offline marketing, you will know that visitors to the subdirectory /offer1 must have come from your offline ad; there is nowhere else to find it. Of course, there is always the possibility that the visitor will remember only your domain (MainWebsite.com) and not the specific landing page (offer1) required to distinguish them from direct visitors; this is common for strong brands. It is therefore important that your offline campaign provide a compelling reason for the visitor to remember your specific coded URL. This can be the promotion of special-offer bundles, voucher codes, reduced pricing, free gifts, competitions, unique or personalized products, and so on that are available only by using the specific coded URL you display in your offline campaigns.
A useful tip when employing this technique is to use a landing page URL that can be remembered easily, tying it in with your message and the medium. This sounds like common sense, but you would be surprised what a little thought can achieve for you. For example, for a TV campaign you could consider the following:
www.MainWebsite.com/tvoffer
www.MainWebsite.com/10percent
www.MainWebsite.com/getonefree
www.MainWebsite.com/twofourone (or /2for1, /241)
www.MainWebsite.com/xmas
www.MainWebsite.com/sale
Identifying with your TV branding slogan or campaign message can be a very effective way of keeping your full URL in the viewer’s mind because this associates your website with their viewing activity.
As with the use of vanity URLs, redirecting visitors is required. This enables you to avoid producing duplicate content and appends tracking parameters to the landing page. The only difference here is that the redirection is applied to a subdirectory, not the entire domain. This is desirable if your products are already hosted as separate websites.
I illustrate the approach using the fictitious example advanced-web-metrics.com/25percent. This would be something that I would use as an advertisement flyer—included in welcome packs at relevant digital marketing conferences, for example. The driver for using the full coded URL is the 25 percent discount code available to conference attendees. The URL is not available anywhere on my website. You would only know that it existed if you saw the printed flyer.
To track the impact of such a marketing initiative, the printed URL redirects to a specific landing page with the following campaign parameters added:
utm_source=eMetrics%20London&utm_medium=print&utm_campaign=book%20launch
Visitors then appear in my Google Analytics reports as shown in Figure 11-30. For each conference event at which I advertise, I simply need to adjust the utm_source campaign value.
Even without redirection, as long as the URLs remain unique to your offline campaigns and are neither shown as links within your website nor indexed by the search engines, you will still be able to measure the number of offline visitors to these specific pages. The purpose of the redirection is to help you compare different campaigns within your Google Analytics reports. This is key for marketers attempting to understand the performance of numerous marketing channels.
Figure 11-30: Fictitious visit details from an offline (print) campaign tracked using coded URLs and redirects

Redirecting Coded URLs
This example uses the Apache mod_rewrite module, which most Apache servers have installed by default. See http://httpd.apache.org/docs/mod/mod_rewrite.html.
<VirtualHost>
   ServerName www.myproduct.com
   RewriteEngine on
   RewriteCond %{HTTP_USER_AGENT} .*
   RewriteRule /xmas.* /productX/?utm_source=channel123↵
   &utm_medium=tv&utm_campaign=March%20tv%20ad [R=301,QSA]
</VirtualHost>
Ensure that the RewriteRule is contained on one line within your configuration file (up to and including QSA]), and if spaces are required within the URL, use character encoding (%20). Adjust your campaign-tracking parameters accordingly—as described in Chapter 7.
Combining with Search to Track Offline Visitors
When your brand values are less significant than your product or service values or your target audience is more price oriented than brand oriented, remembering a URL can be difficult for your potential visitors; your brand is simply not strong enough to gain traction. An alternative technique is to use search as part of your offline message, such as running a radio ad that uses something like “Find our ad on Google by searching for the word productpromo and receive 10 percent off your first order.”
By creating an AdWords ad just for this campaign, targeting a unique word or phrase that is relevant only to people who have heard your ad, you not only provide a strong incentive for visitors but also directly assign these visitors to a specific offline campaign—this is very difficult to achieve with the two previously described techniques. The process is schematically shown in Figure 11-31.
Figure 11-31: Schematic representation of using search to track offline visitors

This extra step of asking your potential audience to first go elsewhere (to a search engine) has two small drawbacks:
- You pay for the click-through on your AdWords ad.
- The visitor is further away from your goal (there is an extra step) and may be distracted by other search results.
However, using a unique search phrase means you should be the only bidder and hence would pay as little as one cent per click-through. For such a small price, the upside is considerable: You have full control of the ad message and landing page URL. That means each campaign (print, TV, display, radio) can have a separate landing page and hence is completely traceable, without the need of going to your IT department and asking for redirections to be set up.
Here are some example keywords to use in your AdWords campaign:
- 10percent
- productX101
- whyCompanyName
- 1-800-123-BIKE (your toll free number; United States)
- 207-123-4567 (your telephone number)
- Signal House, London Road (the first line of your address)
Tip: Check your AdWords listing regularly because competitors may pick up your campaigns and start to bid on the same keywords!
I often use this technique when speaking at conferences and events. For example, it would be great if this book and my marketing material were at hand for conference attendees. That way I could refer them to specific chapters and sections whenever I am asked a question that requires a detailed answer. Of course, that is rarely the case. Instead, I can say, “Go online and search for track offline to find a white paper from me that discusses this in detail.” An example of the search results for this search is shown in Figure 11-32.
Figure 11-32: Using search to track offline visitors

For this example, all that is required is an AdWords ad configured for the keywords I use and perhaps a few related ones, such as tracking offline. The method for doing this would be exactly the same if I were advertising on TV or radio. The beauty of this technique is that I can control the landing page to match the specific campaign at any time. For my example, I would customize the landing page to match the event name and content of where I am mentioning the white paper.
Combining with URL Shorteners
This method is relevant to print publishers and print advertising only, simply because the landing page URL is too complicated to remember to be of use in any other form of offline marketing. As the name suggests, URL shorteners are tools that enable you to shorten a long URL into a short one. Although around since 2002, they became popular with the rise in prominence of Twitter because Twitter has a message limit of 140 characters. Example tools include bit.ly, ow.ly, tinyURL.com, and goo.gl.
Shortening a URL has advantages for marketers because you can include all your campaign tracking parameters prior to shortening. That way, two things are achieved—a neater, fixed-length URL and one that is trackable offline. The method is particularly useful when used in social media marketing and engagement—see Chapter 7 for median example of this.
The New York Times uses this technique in its print newspapers. The use of a shortened URL avoids the need to print overly long URLs within articles. Crucially, it also provides the means for the newspaper to track reader engagement at a sophisticated level never before possible. For example, printing “Follow this story online at nyti.ms/Byjdi89” potentially enables them to understand which newspaper is being read (they have several), what edition and date the reader saw, which section of the paper, on what page, and which specific article is driving engagement. That has huge implications for content optimization and advertisement placement for the publisher of offline content. Here is an example of the campaign parameters that could be used:
utm_source=IHT&utm_medium=newspaper&utm_campaign= ↵
politics&utm_content=page3-col2
Note: Although the New York Times uses URL shorteners in its print publications, it is not a Google Analytics user.
Combining with Quick Response Codes
Quick response (QR) codes are two-dimensional bar codes, readable by QR scanners, mobile phones with a camera, and smartphones. The code consists of black modules arranged in a square pattern on white background. The information encoded can be text, a URL, or other data. An example is shown in Figure 11-33. For this example, the text encoded is the URL to advanced-web-metrics.com with campaign parameters appended.
Figure 11-33: An example QR code with an embedded URL

The technique is applicable to print-based advertising such as newspaper ads, ads in magazines, flyer handouts, billboards, posters, business cards, and so forth—essentially anywhere that a person with a mobile phone is likely to make use of it. Example campaign tracking parameters could be:
utm_source=book%20flyer&utm_medium=print&utm_campaign=eMetrics%20London
Note: The use of QR codes is very popular in Japan. See, for example, the huge LCD billboard at http://en.wikipedia.org/wiki/File:Japan-qr-code-billboard.jpg
Summary and Case Study
To help guide you through the decision-making process of which method to choose, I describe here the approach I used for this book. That is, I wanted to track whether readers use the URLs provided in the book text to visit www.advanced-web-metrics.com. Fortunately, I possess the skills to fully manage the IT requirements of my Apache server. Therefore, all offline tracking methods were available to me: vanity URLs, coded URLs, combining with search, URL shorteners, QR codes.
First, I ruled out combining with search because my offline marketing extends only to print—the book itself. In addition, my target keywords, for example, Google Analytics, would attract a very broad and poorly qualified audience. I discarded URL shorteners because my domain name is an important part of my branding. QR codes would occupy too much page space, and in any event I did not see any value in my readers going to the book website via a mobile device. I therefore needed to consider which type of redirection URLs are most suitable—vanity URLs or coded URLs.
For my situation as an author of content wishing to track reader engagement, my brand is the book title and its web address, www.advanced-web-metrics.com. My “products” are chapters of this book, and I wish to track reader engagement on a per-chapter basis. Therefore, relatively speaking, I have strong company brand awareness and low product brand awareness (Chapter 11 is meaningless unless you are aware of the book). Hence I use coded URLs in this book to track you. For example, www.advanced-web-metrics.com/chapter11 redirects to the website with campaign parameters appended, allowing me to view the activity of offline readers in my Google Analytics reports. As you will see if you try this link, I use the parameter utm_id=81 to differentiate such visitors (campaign parameters are added in the background).
Using these methods, tracking offline marketing activity is relatively straightforward and most important, scalable—1 thousand, 1 million, or 100 million offline visits can be tracked this way. However, despite this, tracking offline marketing efforts has long been a frustrating experience for marketers. Essentially you need a savvy IT person who understands the requirements of marketing and can advise on which of the three methods is the best fit for you on a per-campaign basis—a rare breed indeed.
If that is not available to you, or you are an organization where brand values are less significant than your product or service values, you should combine offline marketing with search marketing. This gives you complete control over tracking without any IT to worry about. Even large brands (for example, Pontiac) have used this technique to great effect.
An Introduction to Google Website Optimizer
Google Website Optimizer is a free web page testing tool that enables you to seamlessly run experiments on your website visitors—comparing either different versions of the same page (A/B testing) or elements within a page, that is, multivariate testing (MVT). The technology displays a test version to your visitors at random, which is maintained throughout their visit. That is, they see only one particular test and are unaware of other versions. Hence, the process does not interfere with your visitors’ browsing experience. By defining a goal—analogous to Google Analytics—the test that drives the most goal conversions is the one your visitors prefer. With this knowledge, the idea is that you adopt the winning test page as your permanent content.
Marketers will be familiar with A/B testing—a binary test to compare the effectiveness (usually a conversion rate) of a statistical element, such as one product image versus another. For example, page A is shown to 50 percent of new visitors selected at random, while page B is shown to the remaining 50 percent of visitors. If page A is better at generating conversions than page B, then page A is declared the winner and subsequently shown to all visitors. Another page, or page section, can then be tested, such as product title A versus product title B. Despite its name, you can also perform multiple side-by-side tests, that is, A/B/C/D... tests.
Multivariate testing is used to evaluate multiple page elements such as images, headlines, descriptions, colors, fonts, content, and so on within a page in order to understand which combinations provide better conversions. According to Wikipedia (http://en.wikipedia.org/wiki/Multivariate), multivariate statistical analysis describes “a collection of procedures which involve observation and analysis of more than one statistical variable at a time.” The key phrase “more than one statistical variable at a time” is what distinguishes MVT from A/B testing.
If you have used AdWords or another pay-per-click search marketing network, you may have already experimented with A/B testing. AdWords ad rotation, discussed earlier in this chapter in the section “AdWords Ad Content Optimization,” uses the same statistical methods to display different ad creatives to Google search visitors, where you have more than one ad version available for the same keywords. AdWords ad rotation is a testing technology that compares the performance of different ad versions. Google Website Optimizer extends the methodology for testing page content once a visitor has arrived on your website.
Similar to the launch of Google Analytics, the release of Website Optimizer was a pivotal moment in the short history of the landing page optimization industry. Previously, such tools were complicated to deploy and came with a hefty price tag to implement and use. Google changed that with a simplified setup and free availability to all. Unlike with Google Analytics though, the launch of Website Optimizer in 2007 was the result of internal product development, not an acquisition.
Common Misconceptions
Like all page optimization tools, Google Website Optimizer does have a few limitations. There are, however, many things that have been said and published about Google Website Optimizer that simply aren’t true. Here are some of the more common areas of misconception.
Only works for AdWords visitors Google Website Optimizer allows you to run tests on your pages regardless of visitor referral source; it’s not just AdWords visitors. You also do not need to be an AdWords advertiser to use it. This misconception came about because when Google Website Optimizer was first released, it was accessible only through the AdWords interface.
Does not run on secure pages Google Website Optimizer code (and the GATC) contains logic that determines whether or not a page is secure or nonsecure and automatically runs the appropriate code for each. Therefore it does not matter whether part of a test, or even the entire test, is contained on SSL pages.
Does not work with dynamic content Google Website Optimizer tests are easiest to set up with static content. However, tests can be set up on pages that include dynamic content, used with sections to swap out CSS, scripts, or other dynamic elements. It is also possible, with more advanced techniques, to have elements persist across pages or even work with server-side delivered content.
Does not allow for multiple conversions The Google Website Optimizer interface asks for the conversion page of the experiment. However, the conversion point is actually determined by the code that is subsequently provided. This means you can have a conversion register on multiple pages or in an onClick or onSubmit event.
Genuine Google Website Optimizer Limitations
As variations are chosen randomly, it is not currently possible to present specific test variations based on a visitor segment. For example, it is not possible to show test variation A only if the visitor’s country = UK and test variation B only if the visitor’s country = US.
Although conversions can be set on multiple pages, it is not possible to weight conversions. Each conversion is equally weighted and each visitor can convert only once, regardless of the number of conversion pages they see.
AMAT: Where Does Testing Fit?
Consider the following scenario: You have set up your website, initiated marketing to bring relevant traffic, and viewed your visitor reports and you notice that an important page is underperforming. You’ve identified the problem, and various teams have come up with suggestions to improve the situation. These include changes to the page layout and its design, different product images, snappier headlines, revised descriptive text, and stronger calls to action (bigger buttons!). Now you have to advise which suggestion to pick as the replacement, or should you select all of them?
This common problem can sometimes halt the entire optimization process; people just don’t know what to do next—there are too many choices and all (or none) could be right. Often the highest-paid person in the organization (HIPPO) or most vocal person determines the way forward. But the reality is that they know much less about the behavioral patterns of visitors on your website than you do because you look at the data on a regular basis. Are you prepared to put your credibility on the line by taking an educated guess or going with the HIPPO’s opinion? That’s a dilemma expert consultants as well as novice analysts face.
The answer is you don’t need to and shouldn’t. Let your visitors decide because theirs are the “expert” opinions you need to listen to. This is precisely where testing comes in. Multivariate and A/B testing are crucial elements that dovetail into the web-marketing life cycle that I refer to as AMAT:
1. Acquire visitors.
2. Measure interactions.
3. Analyze results.
4. Test alternatives.
As Figure 11-34 shows, AMAT allows for a continuous cycle of improvement, providing a measurable process by which you can optimize conversion rates on your website, right down to a page-by-page basis if required.
Figure 11-34: The web-marketing life cycle (AMAT)
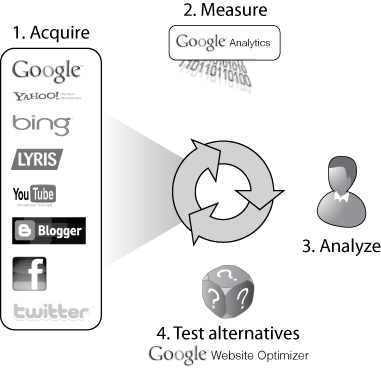
Choosing a Test Type
At this stage I assume you have been through the process of optimizing poor-performing pages and search engine marketing campaigns—as described earlier in this chapter. Do these first to ensure that you get the basics right before performing a test—there is no point in testing just for the sake of it. Employ testing when you have a fundamental best practice web design and search marketing strategy in place. Otherwise, you waste a great deal of time and effort looking for statistical significance in areas that are basic and can be identified quickly by a good web optimization consultant.
With these in place, next have a clear definition of what page you wish to test. Some practitioners propose “test everything.” However, for all but the smallest of websites, that is unrealistic. Instead, focus your efforts on funnel steps to your goal completions and pages with high and low bounce rates.
Funnel steps are the well-defined linear micro-conversions that take the visitor to the end goal—the purpose of your website. High-bounce-rate pages indicate poor performance and are obvious candidates for testing. Low-bounce-rate pages are strong-performing pages that are excellent candidates for testing promotions, new ideas, and so on. Experimenting with any of these can have a huge impact on your website performance—as discussed in “Identify and Optimize Poor-Performing Pages” at the beginning of this chapter.
With a test page defined, log in to your Website Optimization account and click Create A New Experiment. The first thing to decide is what type of test (referred to as experiment from now on, with test used to describe a particular experiment combination) is most suitable for your needs. As shown in Figure 11-35, you have two choices:
A/B Experiment A/B tests, often referred to as split testing within the industry, allow to you to test two (or more) entirely different versions of a page. Choose this if you are considering a page redesign or new layout or if you simply wish to change one item on a page.
Multivariate Experiment Multivariate tests allow you try multiple combinations of content on the same page. Choose this to test combinations simultaneously where the design and layout remain constant.
In both cases you define a conversion goal that signifies success.
Figure 11-35: Google Website Optimizer initial setup screen
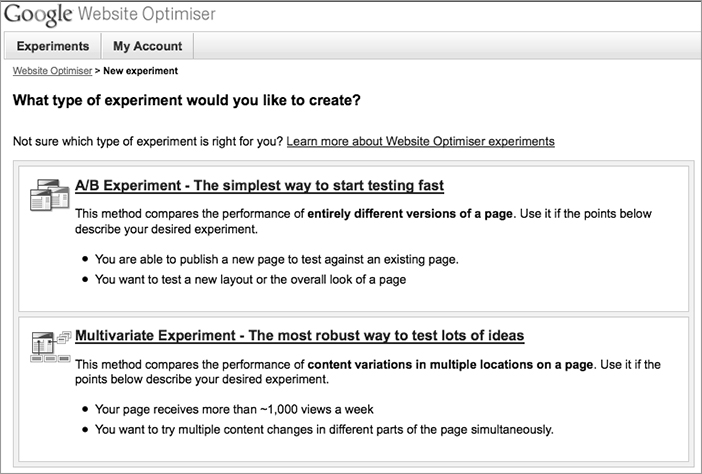
When A/B Experiments Are Appropriate
The great advantage of A/B testing is that it is simple to set up and quick to obtain results and make changes. It is often used to test design layout—for example, should the menu-navigation system be at the top or left side of the page, or is a black-and-white theme preferred to a multicolored alternative? The iterative nature of A/B testing and the few alternatives presented to the visitors (as few as two—the original and an alternative) enable you to gain results quickly. This is particularly useful when answers to macro-questions are required—is version A better than version B or not?
The advantage of A/B experiments diminishes as the number of alternatives grows (A, B, C... Z) because each page must be created and hosted on your servers.
When Multivariate Experiments Are Appropriate
With multiple page elements—for example, multiple product images, titles, and descriptions on the same page—A/B testing is too laborious to implement and too time consuming to obtain results. Another caveat is that A/B testing cannot tell you whether one page element affects the conversion rate of another; for example, what if the product title affects how visitors perceive the product image?
Use multivariate testing to test multiple elements on a page simultaneously. It determines what, if any, correlations exist between elements and evaluates the best combination of all page elements to create a winning recipe—that is, generate more conversions.
The caveat is that multivariate experiments can take a long time to complete as many combinations are generated and each needs to receive significant conversion for the test to be valid. Therefore, multivariate experiments are only suitable for high-traffic websites, that is, websites where you are likely to receive at least several hundred conversions over a period of a month.
Use A/B Testing for Dynamic Content
For multivariate (MVT) experiments, Website Optimizer hosts your alternative combinations on Google servers. In this way, when a visitor views a page under test, Website Optimizer replaces the original (control) version of the section you wish to test with one of your alternatives. Because this process takes place on-the-fly, test versions must be defined within Website Optimizer.
The advantage of this approach is that it removes a large part of the technical overhead required to perform a multivariate test—a savvy marketer can set up and control an MVT experiment without changes to the website architecture. However, a consequence is realized when the page alternatives depend on dynamic variables, such as the visitor’s input prior to the test page being viewed.
For example, consider testing a product-page template of a shopping cart system. Which image, headline, description, and so on are displayed depends on the link the visitor clicked in the preceding product-category page. Website Optimizer has no way to determine which product was selected because this is dynamically generated at the point of click-through. Therefore, you cannot use MVT in this scenario. Instead, perform an A/B test with your alternative combinations.
Note: Depending on what elements you are specifically testing, there are advanced methods allowing you to run MVT tests on dynamically generated content, such as, for example, using server-side logic in conjunction with JavaScript and CSS. In addition, if you use Website Optimizer to inject CSS and JavaScript rather than “content,” you can rearrange elements on a page to present different variations to the visitor. However, these are advanced techniques.
Getting Started: Implementing a Multivariate Experiment
In the following sections I consider the setup of a multivariate experiment and two resulting case studies—a retail website (Calyx Flowers) and a large, well-known(!) content publisher (YouTube).
As you may have suspected, there is a close relationship between Website Optimizer and Google Analytics—the conversion data used in Website Optimizer reports comes from the same database system Google Analytics uses. In addition, a modified version of the GATC is used for tracking purposes.
Further Information on Website Optimizer
These sections outline the principles of a Website Optimizer implementation. A fuller description is available from www.google.com/websiteoptimizer with more technical information available at the official Website Optimizer blog:
http://websiteoptimizer.blogspot.com/2009/03/introducing-techie-guide-to-google.html
Similar to Google Analytics, Website Optimizer is integrated with AdWords and is accessed from within your AdWords account or directly from www.google.com/websiteoptimizer. Figure 11-35 shows the initial experiment setup screen.
After selecting Multivariate Experiment, you have four steps to complete:
1. Set up a test page and conversion goal.
2. Install JavaScript tags on both pages.
3. Create alternative variations to test.
4. Review and launch.
Step 1: Set Up a Test Page and Conversion Goal
Your choice of a test page is determined during the consideration of test type, described previously. As already mentioned, don’t test for the sake of it. Plan your experiments with care or you risk being swamped with even more data (isn’t Google Analytics enough for you?). Pages with a high bounce rate or high exit rate are suitable candidates for testing. If you are a transactional site, your checkout funnel is a prime starting point.
For your goal conversion page, you can use the same goal URLs as those defined in your Google Analytics configuration, or define others. An important difference of Website Optimizer goals is that your goal must define success for your test—that’s not always going to be the same as for Google Analytics, which uses goals to define success of your website.
Website Optimizer goals may be virtual pageviews and wildcards; /download/*.pdf and /cgi-bin/*.pl can be defined as goals as long as such files are being tracked by the Website Optimizer tracking script—for example, using an onClick event handler for PDF downloads. You can even define multiple goals on the same page or on subsequent pages. Each conversion is summed and added to the total, though it is currently not possible to weight different goals; all goals are considered equally.
Tip: A conversion goal does not have to immediately follow the test page—it can be much further down the visitor journey. However, bear in mind the longer that path is, the fewer conversions the test will receive and hence the longer the experiment will need to run in order to provide statistically significant results.
Step 2: Install JavaScript Tags on Both Pages
With your test and goal page URLs selected, you need to insert page tags to control the experiment and track the results. Figure 11-36 schematically shows the three different tags required for this. These tags are snippets of JavaScript code that are provided in the Website Optimizer interface during setup. The tracking and conversion scripts are simple modifications of the GATC.
Figure 11-36: Schematic tagging of pages for a multivariate experiment

The three different page tags required are as follows:
Control script The control script governs the progress of the experiment. It contacts Google servers to retrieve appropriate content variations (the actual variations are maintained on Google servers). The control script also ensures that a repeat visitor views the same variation and that multiple views of the same page by the same user do not affect the experiment statistics.
The control script must be placed before any section scripts and before all displayable content. The recommended placement is immediately after the opening <head> tag of the test page.
Section scripts Section scripts are used to define sections of page content that will vary in the experiment. Most things can be included within a section—for example, text, script, graphics, and so on—or all of these can be in one contiguous block. Currently the combined limit for all alternatives of a section is 150 KB, though this can vary depending on the size and number of other sections.
If you are testing more than one section, then each section requires a unique name. Section names are case sensitive and can be up to 25 characters long. Try to use meaningful names—for example, headline 1 or product photo X—to make it easier to interpret your reports.
Tracking scripts (two) These scripts trigger Google Analytics data collection and ensure that page refreshes are counted properly. The first tracker script is part of the control that’s placed on the test page. The second tracker script (also known as the conversion script) goes on the conversion page immediately after the opening <head> tag.
A generic example illustrating the positioning of the scripts is shown here:
<html>
 <head>
   ...
   <script><!-- Control script ---><script>
   <script><!-- Optimizer tracking script ---><script>
   <script><!-- Your regular GATC ---><script>
 </head>
 <body>
   ...
   <script><!-- Page section 1 script ---><script>
   <script><!-- Page section 2 script ---><script>
   ...
</body>
</html>
Once you have installed all the tags, validate them within Website Optimizer. If errors are detected, fix them before continuing. Website Optimizer will not let you proceed to the next step without validation. There are two methods of doing this:
- Provide the URLs for your test and conversion pages. Website Optimizer will access them and validate.
- If your test pages are not externally visible—for example, if they are part of a purchase process, behind a login area, or inaccessible for some other reason—you can upload the HTML source files.
Custom Tracking Settings
If you have the following custom variables in your GATC, then you will also need to customize the control, tracking, and conversion scripts for your experiment to match:
_gaq.push[('_setDomainName', somevalue')]
_gaq.push[('_setCookiePath', /some/path/ofcookie')]
To do this, create a new script setting the customized variables to the same values set in your GATC. This new script should be in its own set of <script> tags and placed immediately above the Website Optimizer control script, in the header area of your page. Note that the control script needs the old legacy urchin.js-style customization, as follows:
<html>
<head>
<script>
   _udn = "somevalue";                // from _setDomainName
   _utcp = "/some/path/ofcookie";     // from _setCookiePath
</script>

<script><!-- Control script ---><script>
   ...
</head>
Step 3: Create Alternative Variations to Test
At this step, you add variations of section content within the user interface by simply pasting plaintext or HTML content into the box provided, as shown in Figure 11-37. This is required for each variation. Once you’ve completed this, you can preview each combination that your visitors might see.
Tip: In addition to using plaintext or HTML, you can do some interesting experiments by inserting CSS and JavaScript.
Note that the content variations used for testing are hosted on Google servers; the original content remains hosted by you or your hosting provider. Each time a visitor views your test page, Google servers insert your variations randomly. Once a visitor has received a particular combination, the combination remains fixed for that visitor. For example, if the visitor returns to the same test page later during their visit or at a later visit, the same combination will be displayed to that visitor—provided, that is, they use the same device and browser when viewing your site and have not deleted or lost their cookies. If they have, they will receive another random variation.
Figure 11-37: Adding variations for your test page

It is tempting to create lots of alternatives for a section under test because it is so easy to do. However, you should avoid making superfluous changes such as bold highlighted text versus nonbold or “Click here” versus “Read more” because the number of combinations is important. When your test page is displayed during an experiment, Website Optimizer is testing the performance of not only individual variations but also the combined effect of all page sections on the page. For example, in an experiment with two page sections—headline and image with two and three variations, respectively—the following six combinations will be tested (2 × 3 combinations):
- Original headline + original image
- Original headline + new image
- Original headline + new image2
- New headline + original image
- New headline + new image
- New headline + new image2
Extending this to four page sections with four variations for each, you will have 256 combinations (4 × 4 × 4 × 4). As you can see, the number of combinations grows rapidly. This has obvious implications regarding the length of time the experiment needs to run in order to produce meaningful results (see the section “How Long Will an Experiment Take?”).
Step 4: Review and Launch
This is where you enter the percentage of traffic to include in the experiment (1 to 100 percent); the more traffic included, the faster the experiment will run. I generally recommend you set this to 100 percent unless you have a specific reason for not doing so. Before launching the experiment, it is worthwhile to make a final check of your experiment settings. Once you start the experiment, you will not be able to change the parameters; instead, you must create a new experiment.
Once you click Start, you will return to the experiment workflow page, which has an additional section describing the progress of this experiment and the number of impressions and conversions tracked so far. Your test page will start showing different combinations immediately, but there is a delay of about an hour before reports begin displaying data. Figure 11-38 is a schematic representation of how Website Optimizer works.
Figure 11-38: Schematic representation of how Website Optimizer works
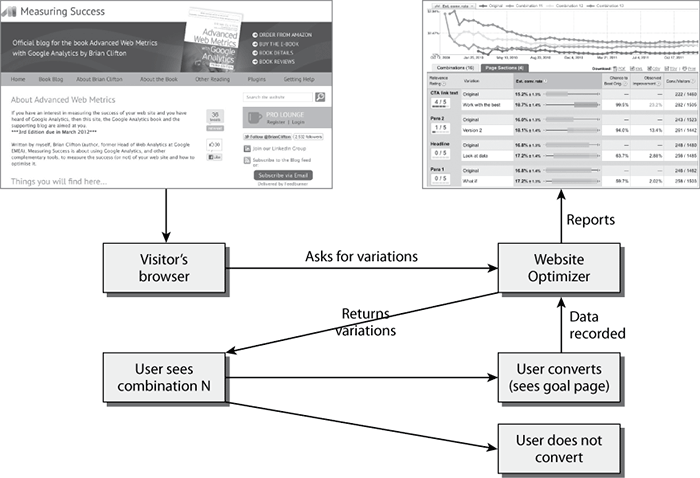
How Long Will an Experiment Take?
The progress of the experiment and the estimated duration depend entirely on the amount of traffic seen on your test and conversion pages. As a guide, when selecting test pages choose pages that receive thousands of pageviews and are part of a conversion process that results in hundreds of goal conversions. The period it takes to achieve this in your Google Analytics reports is a good guide to how long it will take for your experiment to run for each variation.
For example, if you are testing three page sections, each with two variations, that is eight combinations to test in total (2 × 2 × 2). Each combination needs to receive approximately 100 conversions to show statistically significant test results. Assuming an average conversion rate from the test page to each goal page of 10 percent, then approximately 8,000 views of your test page are required. If that is achievable on your website within a week, then it will take approximately the same time to achieve meaningful results within Website Optimizer. If you have 256 combinations and a conversion rate of 5 percent, you require approximately 500,000 pageviews of your test page for the experiment to complete.
This highlights two important points when conducting multivariate experiments:
- Select high-traffic pages as candidates to test in order to obtain results in a reasonable time frame. As a guide, consider a multivariate test only for pages that receive in excess of 5,000 pageviews per week.
- Define a test goal as “close” as possible to the page being tested—as opposed to using your ultimate goal conversions defined in Google Analytics; for example, use “adding to the cart” or “proceeding to the next step” instead of “purchase confirmation.”
Estimating Experiment Time
A handy calculator to help you estimate the potential duration of your experiment is available at
www.google.com/analytics/siteopt/siteopt/help/calculator.html
As a guide, a reasonable time frame for achieving useful experimental results is two to four weeks; otherwise, you risk losing momentum. If you estimate an experiment taking considerably longer, use A/B testing instead. Once you have narrowed the combinations in this manner, say within 64 combinations, you can return to a multivariate test.
In addition, Website Optimizer has two pruning options to improve the speed of running experiments: auto-disable and manual disable. Auto-disable allows you to automatically prune variations that underperform. Manual disable allows you to manually achieve the same thing on a per-combination basis. These features are useful in decreasing the time it takes to run an experiment to statistical significance and when you wish to prevent underperforming pages from being served to visitors, distracting them from the pages that have proven to be more effective.
Once you start seeing impressions and conversions recorded in Website Optimizer, view the preliminary results by clicking View Report. However, be careful drawing any conclusions at these early stages. At the beginning of an experiment, sample sizes will be small and results therefore highly inaccurate, that is, with large fluctuations.
For example, imagine spinning a coin 10 times. There is a possibility that all 10 spins will result in heads showing. That does not mean that heads should be favored over tails and the experiment ended—such a result can be accounted to pure chance and the butterfly effect. If you repeat the coin experiment 1,000 times, then overall you will observe a more even distribution, maybe 550 heads and 450 tails. Repeating the experiment a million times will give you a near-perfect prediction for the probability of receiving heads: 0.5.
The point is that patience is a virtue when it comes to testing. Allow enough data to be collected for each combination before analyzing, pruning, or selecting a winner—at least until the green or red conversion bars appear in your experiment reports.
The following case studies illustrate the abilities of Website Optimizer.
Calyx Flowers: A Retail Multivariate Case Study
This case study was produced by EpikOne (www.epikone.com) as part of its work for Calyx Flowers (www.calyxandcorolla.com) and is reproduced here with the kind permission of both parties.
As the name suggests, Calyx Flowers is a flower-distribution company, founded in 1988 and based in Vermont. Initially, Calyx Flowers had begun to invest significantly in its online marketing—particularly search engine optimization and pay-per-click advertising. However, the company felt that the increase in visitor numbers did not match the modest increase in conversions received, that is, flowers purchased. Furthermore, Google Analytics revealed significant exit rates for visitors who had viewed a product page but did not add to the cart.
In designing the Website Optimizer experiment, EpikOne chose to test whether the product page could be more effective at producing conversions. In this example, a conversion was considered successful if a visitor added a product to the shopping cart. As shown in Figure 11-39, three sections of the product page were identified for testing:
1. Change of messaging
Would the addition of trust factors, such as customer testimonials, help?
2. Stronger call to action
Would larger, brighter buttons for “Buy Now” help?
3. Change of brand image
Would a different (more emotive) product image help?
Figure 11-39: The Calyx Flowers original product page, with three test sections highlighted

For the experiment, each section had two combinations: the original and an alternative (2 × 2 × 2 = 8 combinations). Table 11-2 shows the combinations with all alternatives displayed.
Table 11-2: Multivariate test alternatives for Calyx Flowers
| Section Name | Original | Alternative |
| Subhead | None |

|
| Featured CTA | None |
|
| Hero shot |

|

|
The experiment was launched to test which sections and which combinations would lead to better conversions. For this test, a conversion was defined as adding a product to the shopping cart. Enough conversions were gathered to complete the experiment within a week.
Results and Impact
When viewing results, there are two reports to consider: the Page Sections report and the Combinations report. These are shown in Figure 11-40a and Figure 11-40b, respectively.
Figure 11-40: (a) Page Section results, (b) Combination results

The Page Sections report identifies which sections of the experiment have the greatest impact. This is indicated graphically with green and gray bar charts and numerically in the adjacent table. The Chance to Beat Orig. column is a measure of the overlap of the two (gray and green bars) conversion distributions. The smaller the overlap, the greater the separation of the distributions and therefore the higher the probability of beating the original variation. In other words, was the change in the observed conversion rate real, or did it just occur by chance (within error bars)? A clear separation of green and gray indicates it is real, with a 95 percent confidence level.
In Figure 11-40a, we can see that the addition of a testimonial has the greatest impact on conversion rate, closely followed by the change in product image. The enhanced call-to-action buttons show a negative impact (red bar)—that is, they decreased the conversion rate. However, the decrease is minimal (–0.48 percent) and the distribution overlap is large, as indicated by the Chance to Beat Orig. (42.9 percent). This means there is a 57.1 percent chance that the original section could have also had the same effect. Thus, the call-to-action section is considered to have no significant impact on conversions.
Viewing the Combinations report in Figure 11-40b, we can see that there are two superior combinations (5 and 7). Both of these contained the testimonial, with the winner also including the more emotive product image and the original call-to-action links; see Figure 11-41.
Figure 11-41: Winning combination for the Calyx Flowers product page

The best improvement of a 14.3 percent increase in conversions equates to a significant dollar improvement for the Calyx Flowers bottom line—of the order of millions of dollars per year. This has provided the evidence required that its online marketing efforts are working and provided impetus to further invest in its online channel.
YouTube: A Content-Publishing Multivariate Case Study
This case study was produced by Google in association with VKI Studios (now Cardinal Path, www.cardinalpath.com) and is reproduced here with the kind permission of both parties.
YouTube is synonymous with video sharing and has grown into one of the most highly trafficked sites on the Web. According to comScore Media Metrix, for the month of October 2011, 797 million people watched almost 88.3 billion videos.
Because of its daily visitor volume, small changes on a website such as YouTube can make a very big difference, and it’s an excellent case for a multivariate test. The goal was to increase the number of people who sign up for an account.
Three sections were tested on 100 percent of the YouTube US English home page. Figure 11-42 shows the original test page with test sections highlighted. The hypothesis was that if the prominence of the sign-up link were increased (via changes to sections 1 and 2) along with clearer highlighting of the benefits of having an account (via section 3), more people would sign up.
Figure 11-42: The YouTube home page with three test sections highlighted
For the experiment, each section had multiple possible alternatives, giving a total of 1,024 combinations (2 × 16 × 32 = 1,024). As shown in Figure 11-43, section 1 is a simple change of text style using all uppercase for accentuation. Section 2 is new content that in the original is empty space. Its purpose is to highlight that having a YouTube account provides additional benefits and draw attention to the call to action. There are 16 alternatives (15 plus the original blank space). Section 3 provides additional supporting information of the benefits of having an account with 32 alternatives.
Figure 11-43: Experiment alternatives: (a) call-to-action text, (b) encouragement banners, (c) engagement banners

Results and Impact
The report of Figure 11-44 shows the presence of several winners. Although 12 are visible, the results page is paginated, so the winners stretch beyond what is shown in the screen shot. All of the top four provide a conversion uplift of greater than 15 percent and are predicted to beat the original 99.9 percent of the time, that is, almost certain. This high level of certainty is due to the very large sample size of pageviews and is therefore quite rare for most sites.
Although Combination 28, shown in Figure 11-45, is the winner with an increase in performance of 15.7 percent, all 12 combinations show overlaps in predicted conversion rates. That is, the green bars representing the spread of conversion rates at 95 percent confidence overlap. This means it is entirely possible for, say, Combination 76 to outperform Combination 28. The report shows both are better than the original, but the difference between the two could be the result of random chance. If you wanted to conclusively select a winner, further testing would be needed on the top performers.
The increased sign-up rate for YouTube of 15.7 percent represents thousands of more signups every day for YouTube. Putting this achievement into perspective, the entire experiment, including planning, execution, and result analysis, lasted less than two weeks. In addition, this large experiment with 1,024 combinations (the largest Website Optimizer test to date) shows the robustness of the technique and the promise for very-large-scale multivariate experiments.
Figure 11-44: Combination results: Website Optimizer highlights the top four winners, though this is arbitrary.

Figure 11-45: Winning combination for YouTube home page

In Chapter 11, you have learned the following:
To identify and optimize pages You have learned how to identify and optimize poor-performing pages using a mix of methods, including a detailed funnel analysis.
To benchmark internal site search I discussed how to measure the success of site search and put a dollar amount on its importance to your organization.
To optimize search engine marketing You have seen how to optimize your search engine marketing efforts for both paid and nonpaid search.
To monetize a non-e-commerce website You can ensure that your nontransactional site is not a pet project by monetizing it, either by assigning values to defined goals or by faking transaction calls to Google Analytics.
To track offline campaigns You have learned how to track offline marketing by using modified landing page URLs and redirection or combining with search engine marketing.
Multivariate and A/B testing We explored how to use Website Optimizer as a way to test a hypothesis or alternative design.