Chapter 1 Getting Started
Elementary Statistics Using SAS helps you analyze your data in SAS. This chapter discusses the following topics:
- gives an overview of the book that explains the purpose, audience, organization, and how to use the book
- introduces basic concepts for using SAS
- describes how to start SAS, get help, and exit
- gives a simple example of using SAS
- introduces several SAS statements
Understanding the Ways of Using SAS
Identifying Your On-Site SAS Support Personnel
Summarizing the Structure of SAS Software
Syntax and Spacing Conventions
Output Produced by SAS Software
Introducing Several SAS Statements
This section summarizes how to use this book.
This book shows how to use SAS for basic statistical analyses and explains the statistical methods used—when to use them, what the assumptions are, and how to interpret the results.
This book is for people who have minimal knowledge of SAS or statistics or both. You might be a manager, researcher, or analyst. Or, you might be a student or professor. The range of example data used in the chapters and sample data in the exercises is relevant to a broad audience. The book assumes only that you want to learn to use SAS to perform analyses.
Consider this book a task-oriented tool for basic data analysis. The book integrates analysis methods with SAS steps, and then explains the results. Through the use of examples, the book describes how the analysis leads to decisions about the data.
This book is intended to be a companion to SAS. As you use the chapters, follow along with the examples. Looking at the SAS results as you read through the book will help you learn.
If you are familiar with statistical terms, the book discusses descriptive summaries and graphs, testing for normality, hypothesis testing, two-sample t-tests, paired-differencet-tests, Wilcoxon Rank Sum tests, Wilcoxon Signed Rank tests, analysis of variance (ANOVA), basic regression, and basic contingency table analysis. The book does not discuss analysis of variance for designs other than completely randomized designs. It does not discuss multivariate analysis, time series methods, quality control, operations research analysis, or design of experiments.
The book concentrates on data analysis. Although you can perform analyses using only the information in this book, you might want to refer to statistical texts for more theory or details. The book includes very few formulas. Formulas for the statistical methods are available in many texts and in SAS documentation. See “Further Reading” at the end of the book for a list of references.
This book is divided into five parts.
Part 1: The Basics
Chapter 1, “Getting Started”
Chapter 2, “Creating SAS Data Sets”
Chapter 3, “Importing Data”
Chapter 4, “Summarizing Data”
Part 2: Statistical Background
Chapter 5, “Understanding Fundamental Statistical Concepts”
Chapter 6, “Estimating the Mean”
Part 3: Comparing Groups
Chapter 7, “Comparing Paired Data”
Chapter 8, “Comparing Two Independent Groups”
Chapter 9, “Comparing More Than Two Groups”
Part 4: Fitting Lines to Data
Chapter 10, “Understanding Correlation and Regression”
Chapter 11, “Performing Basic Regression Diagnostics”
Part 5: Data in Summary Tables
Chapter 12, “Creating and Analyzing Contingency Tables”
The first part of the book shows how to get your data into SAS and summarize it. The second part gives a statistical foundation for the analyses discussed in Parts 3, 4, and 5. Parts 3, 4, and 5 show how to perform various analyses.
Using Part 1
Part 1 is essential for everyone. Chapter 1 gives a brief introduction. Chapters 2 and 3 explain how to get your data into SAS. Chapter 4 shows how to summarize your data with descriptive statistics and plots.
Each chapter ends with three summaries. The “Key Ideas” summary contains the main ideas of the chapter. The “Syntax” summary provides the general form of SAS statements discussed in the chapter. The “Example” summary contains a SAS program that will produce all of the output shown in the chapter.
Using Part 2
Part 2 focuses on statistical concepts and provides a foundation for analyses presented in Parts 3, 4, and 5. Topics include populations and samples, the normal distribution, the Empirical Rule, hypothesis testing, the effect of sample size and population variance on estimates of the mean, the Central Limit Theorem, and confidence intervals for the mean. Chapter 5 shows how to test for normality in SAS, and Chapter 6 shows how to get confidence intervals in SAS.
Using Part 3
Part 3 shows how to compare groups of data. The list below gives examples of comparing groups.
- New employees must take a proficiency test before they can operate a dangerous and expensive piece of equipment. Some new employees are experienced with this equipment and some are not. You want to find out if the average test scores for the two groups (experienced and inexperienced) are different.
- Heart rates of students are measured before and after mild exercise on a treadmill. You think the “before” heart rates are likely to be lower than the “after” heart rates. You want to know whether the changes in heart rates are greater than what could happen by chance.
- A study compared the effects of five fertilizers on potted geraniums. At the end of six weeks, you measured the height of the geraniums. Now, you want to compare the average heights for the geraniums that received the five different fertilizers.
- You recorded the number of defective items from an assembly line on the workdays Monday through Friday. You want to determine whether there are differences in the number of defective items made on different workdays.
Chapter 7 shows how to use SAS to summarize data from two independent groups, and how to perform the two-sample t-test and Wilcoxon Signed Rank test.
Chapter 8 shows how to use SAS to summarize paired data, and how to perform the paired-difference t-test and Wilcoxon Rank Sum test.
Chapter 9 shows how to use SAS to summarize data from more than two groups, and how to perform the analysis of variance, Kruskal-Wallis test, and multiple comparison procedures.
Using Part 4
Part 4 shows how to fit a line or curve to a set of data. The list below gives examples.
- You want to determine the relationship between weight and age in children. You want to produce a plot showing the data and the fitted line or curve. Finally, you want to examine the data to find atypical points far from the fitted line or curve.
- You have varied the temperature of an oven in a manufacturing process. The goal is to estimate the amount of change in hardness of the product that is caused by an amount of change in temperature.
Chapter 10 shows how to use SAS for correlations, straight-line regression, polynomial regression (fitting curves), multiple regression, prediction intervals, and confidence intervals.
Chapter 11 shows how to use SAS to plot residuals and predicted values, residuals and independent variables, and residuals in a time sequence. Chapter 11 discusses investigating outliers and using lack of fit tests.
Using Part 5
Part 5 includes Chapter 12, which discusses how to analyze data in contingency tables. The list below gives examples.
- You want to know whether color preferences for shampoo are the same for men and women.
- You have conducted an opinion poll to evaluate how people in your town feel about the proposal for a new tax to build a sports arena. Do people who live close to the site for the proposed arena feel differently than people who live farther away?
- In conducting a test-market for a new product, your company used a survey that asked shoppers if they had bought the product. You asked other questions about the packaging of the product. Are the opinions on packaging different between people who have bought the new product and people who have not?
Chapter 12 shows how to use SAS for creating contingency tables, measuring association, and performing the statistical tests for independence.
References
Appendix 1, “Further Reading,” gives a list of references. Appendix 2 includes a table that identifies the first time the book discusses a SAS procedure, statement, or option. Appendix 3 gives a brief introduction to the SAS windowing environment. Appendix 4 gives a very brief overview of SAS Enterprise Guide.
The typographic conventions that are used in this book are listed below:
regular
is used for most text.
italic
defines new terms.
bold
highlights points of special importance.
bold
identifies the general form of statements and options in SAS syntax, and identifies menu choices in SAS. This font is also used in lists that explain items in SAS output tables or graphs, to refer to specific aspects of SAS code, and for the first reference to a procedure, statement, or option in a chapter.
plain
is used for all other references to SAS syntax, output, data sets, or variables.
Some chapters include “Technical Details,” which give formulas or other details that add to the text, but aren’t required for understanding the topic.
If you have never used SAS, first, read Part 1. Then, if you aren’t familiar with statistics, read Part 2. Otherwise, you can go to other parts of the book.
If you have used SAS, but you are not familiar with statistics, skim Part 1. Then, read Part 2, which explains several statistical concepts. Then, go to other parts of the book that best meet your needs.
If you have used SAS, and you are familiar with statistics, but don’t know how to handle your particular problem, first, skim Part 1. Then, go to the chapter that best meets your needs.
Caution: While the book shows how to use SAS to perform analyses and describes the statistical methods and SAS results, it is not a replacement for statistical texts.
This section describes information that will be useful to know as you begin to use SAS. To run all of the examples in this book, you need Base SAS, SAS/STAT, and SAS/GRAPH software. For many examples, this book provides an alternative that uses low-resolution graphics for people who do not have SAS/GRAPH.
You need to know the basics of using your computer. You should understand single-click, double-click, the CTRL key and click, and so on. The book assumes that you know how to print from your computer. Also, this book assumes that SAS software is already installed on a personal computer (PC). If it is not, you’ll need to install it.
You need to know a few things about how to use your computer’s operating system to access SAS software. For example, on a mainframe system, you need to know how to submit a SAS program to the computer. For more advanced uses, such as permanently saving a data set or a program, you need to know some file management techniques such as how to create files, list a directory of files, or delete files.
You also need to know how to print from your computer. You might use a printer that is directly connected to your PC. Or, you might use a network printer instead. This book does not discuss installing printers.
Understanding the Ways of Using SAS
You can use SAS software in four ways: batch mode, noninteractive mode, interactive line mode, or the windowing environment mode. In each of these modes, you prepare a SAS program that creates a data set and performs analyses. (In addition to these four modes, SAS includes point-and-click products, such as SAS Enterprise Guide. This book does not discuss the other products.)
In batch mode, you submit a batch program by submitting a file that contains the batch program. To submit a file, you need to be familiar with your operating system because this file contains the necessary operating system-specific statements to start SAS software, run the batch program, and route the output. The output prints at either a remote printer or on your terminal, depending on what you specify in the file that is submitted. Some systems refer to batch mode as background processing.
In noninteractive mode, you prepare a file that contains a SAS program, but no operating system-specific statements. Then, you run SAS software using the SYSIN option, which reads the SAS program in your file. Your SAS program runs and the operating system creates a file that contains the output.
In interactive line mode, SAS software responds to statements as you enter them. You can enter your data, perform an analysis, look at the results, and perform another analysis without exiting from SAS. In this mode, you see a question mark (?) as a prompt to enter the next statement.
In the windowing environment mode, SAS software responds to statements as you enter them, but you see a set of windows on your terminal or PC screen. This mode provides you with all of the capabilities of interactive line mode, as well as a built-in text editor. In this mode, you can select choices from the menu bar. Or, you can use a command line and enter SAS commands directly. As you learn SAS, we recommend that you use the menu choices. On PCs, SAS software automatically starts in the windowing environment mode.
If your site doesn’t have interactive capabilities, you need to use batch mode or noninteractive mode. You will find a SAS program in the “Example” summary at the end of each chapter. This program produces all of the output shown in the chapter. For batch mode, you need to add any necessary operating system-specific information to the program.
If your site has interactive capabilities, you can use either interactive line mode or the windowing environment mode. If you are learning to use SAS software for the first time, we recommend the windowing environment mode. Most people prefer this mode once they are familiar with SAS software. See Appendix 3, “Introducing the SAS Windowing Environment,” for more detail.
SAS is available for many operating systems, and different releases of SAS software might be available for different operating systems.
This book shows results and reports from SAS 9.2. In most cases, the differences between output for this release and output from other releases are cosmetic. For example, different releases might have different spacing between columns of information in the output. As another example, displays shown in this book might differ slightly for earlier releases. Where needed, this book highlights important differences between releases. Table 1.1 summarizes how to find your release of SAS.

Identifying Your On-Site SAS Support Personnel
At every site where SAS software is licensed, someone is identified as on-site SAS support personnel. This person is usually available to answer questions from other users. Find out who your on-site SAS support personnel is before you begin using SAS software.
In addition, many locations have a Help Desk that answers questions about SAS software. You might know other people who are experienced SAS users and can answer questions if you run into problems. It’s always handy to know who to call if you encounter some unexpected situation.
Summarizing the Structure of SAS Software
When working with data, first, you organize it. Second, you perform some analysis on the organized data. For example, you might collect all of your paycheck stubs for the year (organizing), and then add the net salary from each to find your total income for the year (analyzing).
SAS software follows the same approach. First, the DATA step helps you organize your data by creating a SAS data set. Second, PROC steps use SAS procedures to analyze your data. Once you create a SAS data set, you can use any SAS procedure without re-creating the data set.
Chapter 2 discusses the DATA step. Chapter 3 shows how to import data that you have already saved in a format other than SAS. The rest of the book discusses a series of PROC steps that correspond to the different procedures that you use for different analyses.
The DATA and PROC steps consist of SAS statements. Most statements have one or more keywords that must be spelled exactly as shown. Depending on the statement, keywords might be followed by additional information that you supply. When this book shows the general form of SAS statements, keywords and required punctuation appear in bold, and the information that you need to supply appears in italic.
Syntax and Spacing Conventions
The DATA and PROC steps are part of the SAS language. Like any language, it has its own vocabulary and syntax. Some words have special meanings, and there are rules about how words are put together. Fortunately, there are very few restrictions.
Syntax
There is just one basic syntax rule you must always follow. SAS statements must end with a semicolon. The semicolon tells the software that you have completed one statement and that the next word starts a new statement. If you complete a statement and forget the semicolon, SAS software continues to read your program as one statement. When the software finds something it doesn’t understand, you receive an error message. However, in most cases, the error message won’t tell you that you have forgotten a semicolon. Anytime you get an error message, you should first look to see that all statements end with semicolons.
Spacing
With some computer languages, the spacing of your statements and of parts of your statements is important. This isn’t true with SAS software. You can put several statements on one line. You can spread one statement over several lines. You can put spaces between statements or not. You can indent statements or not. The key point is that semicolons, not spacing, determine where SAS statements start and end. As an example, three SAS statements are shown below. Each of the methods of spacing in the statements has the same result.
data new; input x; datalines;
data new;input
x;
datalines;
data new;
input x;
datalines;
data new;input x;datalines;
data new;
input x;
datalines;
data new;
input x;
datalines;
The final example shows the form used in this book. This form is used simply for convenience and readability. You can choose whatever spacing works best for you.
Notice that the sample SAS statements are in lowercase type. You can use either lowercase or uppercase in SAS statements. This book uses lowercase in sample programs and uppercase to show you the general form of SAS statements.
Output Produced by SAS Software
After you run a SAS program, you receive output. The output is in two parts: the log and the procedure output.
- The log shows the program that you submitted.
- The log tells you what the software did with the program.
- The log prints any error or warning messages.
For example, if your program creates a data set, the log tells you that the data set is created, and gives you some information about the data set. The procedure output gives the results of your program. For example, if your program calculates and prints the average of a group of numbers in your data set, the procedure output contains the printed average.
In this book, the log is shown only for the sample program later in this chapter. However, you need to remember that a log exists for every program. If you run into problems, the first step you should take is to look at the log to find error messages and investigate mistakes. Also, as a general strategy, it’s a good idea to look at the log to verify that the program ran as expected. For example, checking the notes in the log will help you confirm the number of observations in a data set.
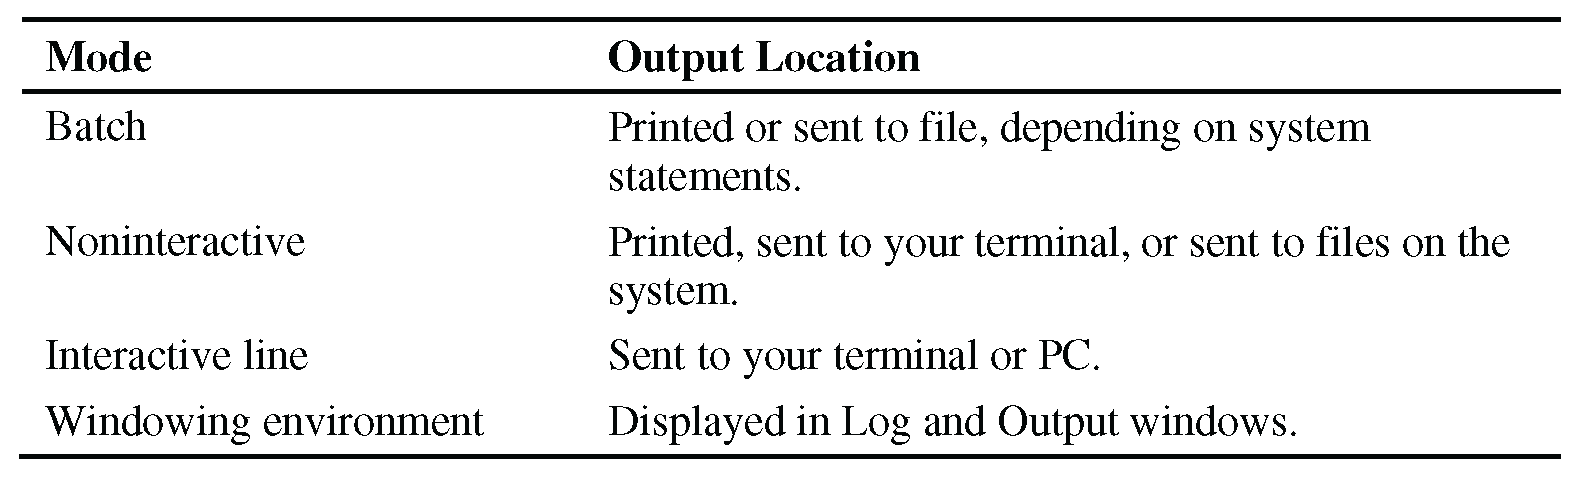
Table 1.2 identifies where your procedure output appears, which depends on how you use SAS.
For sites with PCs, you double-click on the SAS icon on your desktop. For most other sites, you just type the word “sas” to start SAS. Or, you can select Start, then Programs, then SAS, and then SAS 9.2. You need to determine what convention your site uses for starting SAS.
Whether SAS is installed on your PC or you access it over a network, you typically see the Editor, Log, and Explorer windows (assuming that you are in the windowing environment mode). You also typically see a menu bar and toolbars at the top of the SAS window. The details might differ, depending on how SAS was installed on your PC.
This section shows you an example of a SAS data set and the results from an analysis.
One indicator of an individual’s fitness is the percentage of body fat, which is measured with a special set of calipers. (Calipers look like pliers that have a dial on them.) The calipers are used at three or four different places on the body to measure the amount of skin that can easily be pinched. Women are measured on the triceps, the abdomen, and near the hips. Men are measured on the chest, the abdomen, near the hips, and at the midaxillary line. Skinfold measures are averaged from the different places to provide a measure of the percentage of body fat. Depending on whose guidelines you look at, the normal range for men is 15–20% body fat, and the normal range for women is 20–25% body fat. Table 1.3 shows body fat percentages for several men and women.[1] These men and women participated in unsupervised aerobic exercise or weight training (or both) about three times per week for a year. Then, they were measured for their percentages of body fat.

The SAS statements below create a data set that contains the body fat data, print the data, and summarize it.
options nodate nonumber pagesize=50 linesize=80;
data bodyfat;
input gender $ fatpct @@;
datalines;
m 13.3 f 22 m 19 f 26 m 20 f 16 m 8 f 12 m 18 f 21.7
m 22 f 23.2 m 20 f 21 m 31 f 28 m 21 f 30 m 12 f 23
m 16 m 12 m 24
;
run;
proc print data=bodyfat;
title 'Body Fat Data for Fitness Program';
footnote 'Unsupervised Aerobics and Strength Training';
run;
proc means data=bodyfat;
class gender;
var fatpct;
title 'Body Fat for Men and Women in Fitness Program';
run;
Figure 1.1 shows the SAS log from the statements above, and Figures 1.2 and 1.3 show the output.
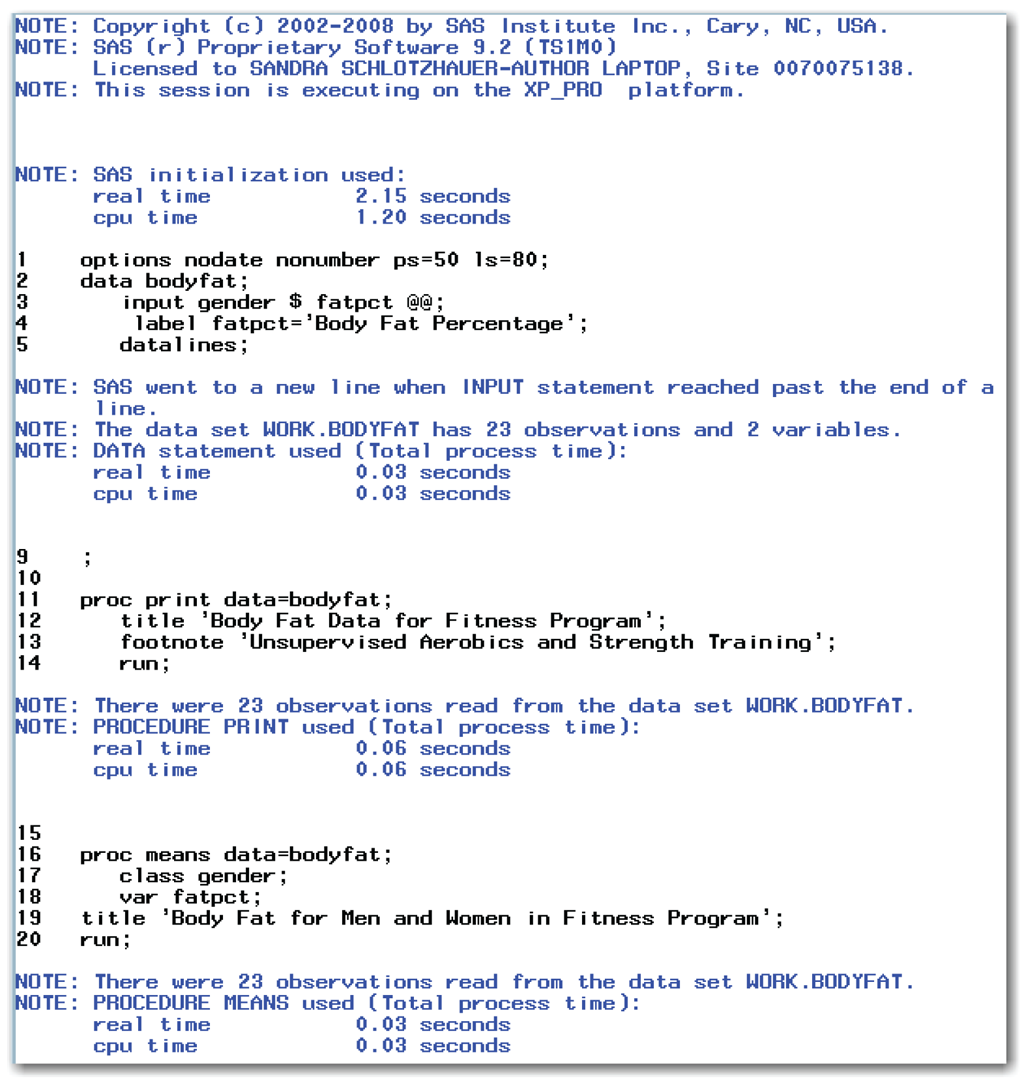
The second line of the log identifies the release of SAS

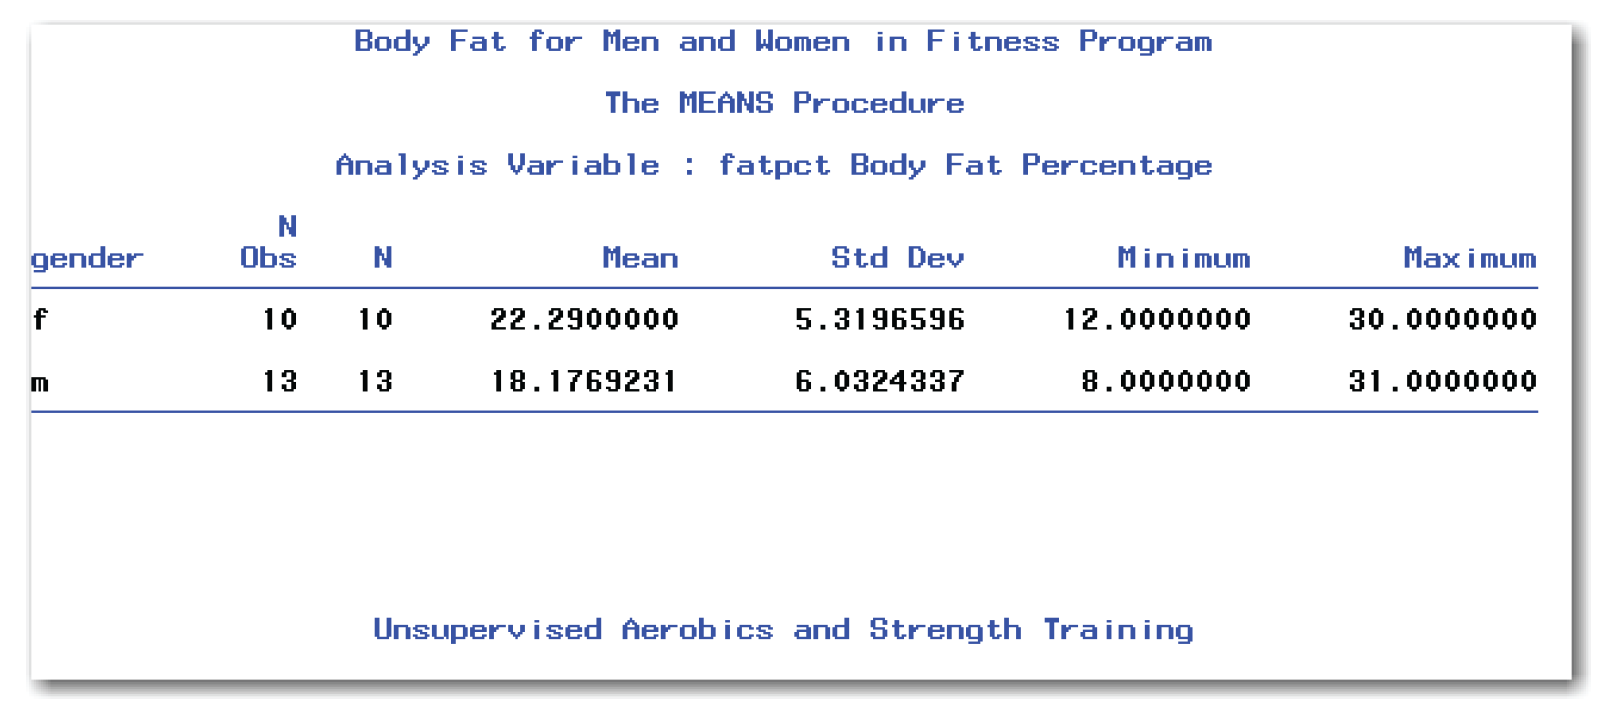
The average body fat for women in the fitness program is 22.29%, and the average body fat for men in the fitness program is 18.18%.
The easiest way to get help is by clicking Help in the menu bar. If you do not use SAS in the windowing environment mode, you can use online resources or the printed documentation.
You can find help about SAS at support.sas.com. Visit this site occasionally to view articles about and examples of using SAS. This is where you will learn about upgrades, new releases, and user conferences. In addition, the Knowledge Base includes documentation, white papers, and a searchable database of known SAS issues. The Learning Center lists SAS courses, provides a bookstore for ordering manuals and other books, and provides details on certification as a SAS programmer.
In batch or noninteractive mode, the computer runs your SAS job, and then automatically exits from SAS.
In interactive line mode or the windowing environment mode, the ENDSAS statement exits SAS. The general form of this statement is shown below:
ENDSAS;
If you use the automatic menus in the windowing environment mode, selecting File, and then Exit ends the SAS session. You typically see a message window asking if you are sure you want to exit; just click OK. If you have switched from the menus to a command line in the windowing environment mode, you can also type bye on any command line to exit SAS.
Introducing Several SAS Statements
This section explains the OPTIONS, TITLE, FOOTNOTE, and RUN statements. These statements are not exclusively part of the DATA step or of a PROC step, but they can be used in either. You might want to skip this section until you are ready to run your own SAS program.
The TITLE statement provides a title on the top line of each page of output. The TITLE statement is not required. If you don’t specify a title, each page of output has the automatic title The SAS System.
In the TITLE statement, enclose the text of the title in single quotation marks or double quotation marks. The text between the quotation marks appears as the title for the output. For example, if you use all uppercase, the output title will print in uppercase. If your title contains an apostrophe, enclose the title text in double quotation marks and use a single quotation mark to get an apostrophe. Or, enclose the title text in single quotation marks and use two single quotation marks to get the apostrophe. The code below shows examples of valid TITLE statements:
title 'PRODUCTION SUMMARY FOR FY 2009';
title 'Experiment to Test Emotions under Hypnosis';
title 'Children"s Reading Scores';
title 'Children's Reading Scores';
Each time you use a TITLE statement, the previous title is replaced with the new one. Look again at Figure 1.2 and Figure 1.3. The title changes as a result of the second TITLE statement.
You can specify up to 10 levels of titles. For a second title to appear on a line below the first title, type TITLE2, followed by the title text enclosed in single quotation marks. For example:
title 'BODY FAT DATA';
title2 'Men and Women in Fitness Program';
title3 'Data Property of SAS Institute Inc.';
You might find that using two or three levels of titles is more informative than using one long title.
You can suppress both the automatic title (The SAS System) and titles that are specified in previous TITLE statements. To do so, omit the quotation marks and the title text from the TITLE statement. For example, to suppress all three titles shown above, type:
title;
To suppress the second and third titles in the example statements above, type:
title2;
Similarly, you can suppress a title and all titles below it in the output by typing TITLEn, where n is the first title you want to suppress.
The general form of the TITLE statement is shown below:
TITLEn 'title text ' ;
where n is a number between 1 and 10 for titles 1 through 10. For the first title, you can use either TITLE1 or TITLE. To suppress titles, omit both the quotation marks and the title text.
Text shown in a FOOTNOTE statement appears at the bottom of the page of output. Unlike titles, there is no default footnote.
The syntax of the FOOTNOTE statement is very similar to the TITLE statement. The footnote text is enclosed in single quotation marks, and an apostrophe is indicated by using two single quotation marks together. Or, enclose the footnote text in double quotation marks and use a single quotation mark for an apostrophe. You can specify up to 10 levels of footnotes. A new FOOTNOTE statement replaces a previous one. You can suppress footnotes by simply omitting the quotation marks and footnote text from the FOOTNOTE statement.
Look again at Figure 1.2 and Figure 1.3. The FOOTNOTE statement in the program created the footnote at the bottom of each page. (To save space, several of the blank lines between the output and the footnote have been omitted.)
The general form of the FOOTNOTE statement is shown below:
FOOTNOTEn 'footnote text ' ;
where n is a number between 1 and 10 for footnotes 1 through 10. For the first footnote, you can use either FOOTNOTE1 or FOOTNOTE. To suppress footnotes, omit both the quotation marks and the footnote text.
The RUN statement executes the statement or group of statements immediately above it. If you use batch or noninteractive mode, you don’t need to use this statement. However, if you use SAS software interactively, you need to use the RUN statement.
If you use interactive line mode, you should use a RUN statement at the end of each DATA or PROC step. If you use the windowing environment mode, you only need a RUN statement at the end of each group of statements that you submit. However, using a RUN statement at the end of each DATA or PROC step helps to identify where one step ends and another step begins and to find errors in a program that doesn’t run.
The general form of the RUN statement is shown below:
RUN;
The OPTIONS statement sets certain system-specific options. Although there are many system options, this book uses only four. Your site might have set these four options already, and it might also have set some of the other system options that are available. Although you can override the default settings with an OPTIONS statement, your site probably has these options set in the best way for your system. In the sample program in the previous section, the first SAS statement is:
options pagesize=50 linesize=80 nodate nonumber;
This statement begins with the keyword OPTIONS. Then, the PAGESIZE= keyword is followed by the number 50, which sets the page size to 50 lines. Next, the LINESIZE= keyword is followed by the number 80, which sets the line size to 80 spaces. You can think of the PAGESIZE= option as giving the number of lines of text on a page, and the LINESIZE= option as giving the number of spaces in each line of text.
Next, the NODATE keyword suppresses the date that is normally printed on the same line as the page number.
Next, the NONUMBER keyword suppresses the page number that usually appears.
Finally, the statement ends with a semicolon.
Most of the output in this book uses PAGESIZE=60 and LINESIZE=80. When different page sizes or line sizes are used for a program, the SAS code shows the OPTIONS statement. All of the output in this book uses the NODATE and NONUMBER options.
For your own programs, you want to be able to look at the output and see when you ran the program, so you probably don’t want to use NODATE. Also, you will find page numbering helpful in your own output, so you probably don’t want to use NONUMBER.
The setting of 60 for PAGESIZE= works well for 11-inch-long paper. If your site uses a different paper size, you might want to use another setting. Typical settings for LINESIZE= are 80 for terminal screens, 78 for 8.5-inch-wide paper, and 132 for output printed on 14-inch-wide paper.
- The SAS language consists of DATA steps, which organize your data by creating a SAS data set, and PROC steps, which analyze your data. These steps consist of SAS statements, which contain keywords and additional information about your data.
- All SAS statements must end with a semicolon.
- SAS statements can start anywhere on a line, and can continue for several lines. Several SAS statements can be put on one line. Either uppercase or lowercase text can be used.
- SAS output consists of the log and the procedure output. The log displays the program and messages. The procedure output gives the results of the program.
- To print a title on your output:
TITLEn 'title text ' ;
where n is a number between 1 and 10 for titles 1 through 10. For the first title, you can use either TITLE1 or TITLE. To suppress titles, omit both the quotation marks and the title text.
- To print a footnote on your output:
FOOTNOTEn 'footnote text ' ;
where n is a number between 1 and 10 for footnotes 1 through 10. For the first footnote, you can use either FOOTNOTE1 or FOOTNOTE. To suppress footnotes, omit both the quotation marks and the footnote text.
- To use the same option settings as most of the output in this book:
OPTIONS PAGESIZE=60 LINESIZE=80 NODATE NONUMBER;
PAGESIZE= identifies the number of lines of text per page, LINESIZE= identifies the number of spaces in each line of text, NODATE suppresses the automatic date in the output, and NONUMBER suppresses page numbers in the output.
- To execute one or more statements:
RUN;
- To exit SAS:
ENDSAS;
The program below produces all of the output shown in this chapter:
options pagesize=60 linesize=80 nodate nonumber;
data bodyfat;
input gender $ fatpct @@;
datalines;
m 13.3 f 22 m 19 f 26 m 20 f 16 m 8 f 12 m 18 f 21.7
m 22 f 23.2 m 20 f 21 m 31 f 28 m 21 f 30 m 12 f 23
m 16 m 12 m 24
;
run;
proc print data=bodyfat;
title 'Body Fat Data for Men and Women in Fitness Program'; footnote 'Unsupervised Aerobic and Strength Training';
run;
proc means data=bodyfat;
class gender;
var fatpct;
title 'Body Fat for Men and Women in Fitness Program';
run;
ENDNOTES
[1]Copyright © 2009, SAS Institute Inc. All rights reserved. Reproduced with permission of SAS Institute Inc., Cary, NC, USA.