
Chapter 15 NetWare 6 Troubleshooting Tools
This chapter covers the following testing objectives for Novell Course 3005: Advanced Novell Network Management:
![]() Upgrade Novell Network Management Tools
Upgrade Novell Network Management Tools
![]() Identify the Troubleshooting Features of Novell Network Management Tools
Identify the Troubleshooting Features of Novell Network Management Tools
![]() Identify the Purpose and Function of IP/IPX Troubleshooting Tools
Identify the Purpose and Function of IP/IPX Troubleshooting Tools
![]() Identify Additional Network Troubleshooting Resources
Identify Additional Network Troubleshooting Resources
It’s alive! It’s alive!
Your network is alive. It’s a living, breathing, silicon-based lifeform. It has a brain (server hard drive) for processing, and an elaborate nervous system (disk controller) for support. It uses a sophisticated skeletal system (network communications and protocols) to distribute information and connect all of its moving parts. It can even flex its muscles and generate hard copy output (printing). Finally, your network relies on sophisticated workstations for sensory input—seeing, hearing, tasting, smelling, feeling, and ESP (Extra-Sensory Processing). You probably didn’t realize that you had so much in common with your network. In some strange way, it helps you to understand it.
Welcome to NetWare medical school! As a CNE, you are the LAN doctor. In the final three chapters of “Advanced Network Management,” we’ll explore the two main components of network medicine: the server and eDirectory. But first we must arm ourselves with the essential tools of the trade—all contained within a magical medical bag.
When you arrive at NetWare medical school, you bring two tools with you: your brain and your hands. When you leave, you’ll have a bigger brain and more agile hands. But that’s not enough. In the world of silicon medicine, you’ll need a medical bag full of troubleshooting tools as well.
When troubleshooting networking problems, you should focus on the three main areas (in order) that Novell Customer Services sees from their customers: the LAN, the server, and eDirectory. To troubleshoot the LAN,server, and eDirectory, you must have a solid understanding of network fundamentals. With the knowledge you’ve gained in the 14 chapters before this one, you should have a firm understanding of these components and be able to determine where in the network communication process a specific problem might occur.
In this first troubleshooting chapter, I’ll arm you with several NetWare and client troubleshooting tools for LAN, server, and eDirectory medicine. And as we’re studying these various troubleshooting tools, you’ll be learning how they’re used to diagnosis and repair LAN problems. In the two chapters that follow this one, we’ll study server and eDirectory troubleshooting, specifically.
So, where do we start? Here’s a preview of the four main compartments within our new NetWare medical bag:
![]() NetWare management troubleshooting tools—We’ll begin by exploring the troubleshooting capabilities of five familiar network administration tools: ConsoleOne, Remote Manager, iMonitor, iManager, and Novell.com. Although these tools should be very familiar to you by now, you might not be fully aware of their hidden troubleshooting capabilities.
NetWare management troubleshooting tools—We’ll begin by exploring the troubleshooting capabilities of five familiar network administration tools: ConsoleOne, Remote Manager, iMonitor, iManager, and Novell.com. Although these tools should be very familiar to you by now, you might not be fully aware of their hidden troubleshooting capabilities.
![]() NetWare IP/IPX troubleshooting tools—Next, we’ll shift our focus to the central server and learn what it has to offer from a protocol troubleshooting perspective. In this second lesson, we’ll explore the following six IP/IPX commands: CONFIG, NSLOOKUP, HOSTS, TCPCON, PING, and DEBUG.
NetWare IP/IPX troubleshooting tools—Next, we’ll shift our focus to the central server and learn what it has to offer from a protocol troubleshooting perspective. In this second lesson, we’ll explore the following six IP/IPX commands: CONFIG, NSLOOKUP, HOSTS, TCPCON, PING, and DEBUG.
![]() Client IP troubleshooting tools—After we’ve mastered the server compartment, we’ll bounce over to the client and learn what it has to offer from a troubleshooting perspective. In the third lesson, we’ll explore the following client-based protocol troubleshooting tools: IPCONFIG, PING, ROUTE, TRACERT, NSLOOKUP, ARP, and NETSTAT.
Client IP troubleshooting tools—After we’ve mastered the server compartment, we’ll bounce over to the client and learn what it has to offer from a troubleshooting perspective. In the third lesson, we’ll explore the following client-based protocol troubleshooting tools: IPCONFIG, PING, ROUTE, TRACERT, NSLOOKUP, ARP, and NETSTAT.
![]() General network troubleshooting tools—Finally, we’ll leave the server and client behind as we dive into the LAN itself. This last troubleshooting compartment includes protocol analyzers, TCP/IP toolkits, and IP addressing calculators. If the server and/or client can’t solve your network problems, it’s good to know that there are other utilities available to help.
General network troubleshooting tools—Finally, we’ll leave the server and client behind as we dive into the LAN itself. This last troubleshooting compartment includes protocol analyzers, TCP/IP toolkits, and IP addressing calculators. If the server and/or client can’t solve your network problems, it’s good to know that there are other utilities available to help.
These 21 tools are a great start for your troubleshooting medical bag. You should plan on making them an integral part of your CNE arsenal right away. There’s no time like the present, so let’s take a moment to explore each of these four compartments from the LAN’s point of view.
Remember—no exploratory surgery!
Test Objectives Covered:
![]() Upgrade Novell Network Management Tools
Upgrade Novell Network Management Tools
![]() Identify the Troubleshooting Features of Novell Network Management Tools
Identify the Troubleshooting Features of Novell Network Management Tools
![]() Identify Additional Network Troubleshooting Resources
Identify Additional Network Troubleshooting Resources
NetWare 6 breaks down the walls of the IP server room. As a result, you’re no longer trapped in the dungeon of server console administration. In fact, NetWare 6 includes five very powerful management utilities that enable you to securely administer your network anytime/anywhere. In addition, these five powerful management tools have hidden troubleshooting capabilities as well.
In this lesson, you’ll learn how to use the following five anytime/anywhere administration tools to troubleshoot the LAN, server, and eDirectory:
![]() ConsoleOne—ConsoleOne is a network-compatible Java tool that enables you to administer network resources from a central browser. As a Java GUI tool, ConsoleOne supports cross-platform compatibility from both the Novell Client workstation and NetWare 6 server. Furthermore, ConsoleOne includes a powerful reporting feature to help you troubleshoot network problems.
ConsoleOne—ConsoleOne is a network-compatible Java tool that enables you to administer network resources from a central browser. As a Java GUI tool, ConsoleOne supports cross-platform compatibility from both the Novell Client workstation and NetWare 6 server. Furthermore, ConsoleOne includes a powerful reporting feature to help you troubleshoot network problems.
![]() Remote Manager—Remote Manager provides all the functionality available at the server console from a distributed Web browser. Using Novell Remote Manager, you can monitor the health of your servers, their processes, and CPU usage.
Remote Manager—Remote Manager provides all the functionality available at the server console from a distributed Web browser. Using Novell Remote Manager, you can monitor the health of your servers, their processes, and CPU usage.
![]() iMonitor—iMonitor provides monitoring and diagnostic capability to all servers in your eDirectory tree from a Web browser. Furthermore, iMonitor enables you to troubleshoot several aspects of eDirectory, including partitions, replicas, and/or synchronization.
iMonitor—iMonitor provides monitoring and diagnostic capability to all servers in your eDirectory tree from a Web browser. Furthermore, iMonitor enables you to troubleshoot several aspects of eDirectory, including partitions, replicas, and/or synchronization.
![]() iManager—iManager is a Web-based application for managing, maintaining, and troubleshooting eDirectory from a browser interface. Traditionally, eDirectory has been managed through utilities such as NetWare Administrator and ConsoleOne. Today, iManager includes all the capabilities of those tools plus a variety of powerful troubleshooting capabilities.
iManager—iManager is a Web-based application for managing, maintaining, and troubleshooting eDirectory from a browser interface. Traditionally, eDirectory has been managed through utilities such as NetWare Administrator and ConsoleOne. Today, iManager includes all the capabilities of those tools plus a variety of powerful troubleshooting capabilities.
![]() Novell.com—The Novell Web site has several useful troubleshooting tips and tools. And as a 21st Century silicon doctor, you must take advantage of all available resources.
Novell.com—The Novell Web site has several useful troubleshooting tips and tools. And as a 21st Century silicon doctor, you must take advantage of all available resources.
Now let’s explore each of these old friends from a troubleshooting perspective, starting with ConsoleOne.
NetWare 6 includes a browser-based administration tool called ConsoleOne. ConsoleOne is designed like a file manager utility with a left pane (where you browse containers) and a right pane (where you manage network resources and eDirectory objects). Check it out for yourself in Figure 15.1.

As a browser-based GUI tool, ConsoleOne supports cross-platform compatibility from both the Novell Client workstation and NetWare 6 server. Both platforms require Java support. On the server, that support is provided by Java Virtual Machine (JVM), which is loaded by default when the server boots. On the workstation, the Java platform is installed as a Custom option during Novell Client setup.
When you upgrade NetWare or any of its components by installing a new Support Pack, you should also upgrade the NetWare management utilities—including ConsoleOne. By upgrading these tools, you can take advantage of improved performance, remote management capabilities, and additional features that will enhance your troubleshooting duties.
From a troubleshooting perspective, ConsoleOne for Windows enables you to generate pre-defined troubleshooting reports. Keep in mind that the other ConsoleOne platforms do not support reports functionality. To run reports, ConsoleOne must be installed on a Windows workstation with at least 128MB of RAM. In addition, the eDirectory tree must contain at least one NetWare volume for installation of report catalog files.
After you’ve extended the schema to support reporting, you must install the desired reports. The following pre-defined report categories are available:
![]() eDirectory General Object Reports—Includes NetWare file servers, print servers, and printers. These reports provide information and status for each object.
eDirectory General Object Reports—Includes NetWare file servers, print servers, and printers. These reports provide information and status for each object.
![]() eDirectory User Utility Reports—Includes report forms that enable you to generate specific reports on eDirectory login and rights security for all users in your tree. Some of the ConsoleOne security reports available include disabled user accounts, security equivalences, trustee assignments, and users with multiple workstation logins.
eDirectory User Utility Reports—Includes report forms that enable you to generate specific reports on eDirectory login and rights security for all users in your tree. Some of the ConsoleOne security reports available include disabled user accounts, security equivalences, trustee assignments, and users with multiple workstation logins.
![]() eDirectory User and Group Reports—Includes report forms that enable you to generate reports on the users, groups, and organization roles within your eDirectory.
eDirectory User and Group Reports—Includes report forms that enable you to generate reports on the users, groups, and organization roles within your eDirectory.
Don’t forget, you must use the Windows version of ConsoleOne to enable troubleshooting reports. This functionality is not available on the other ConsoleOne platforms—NetWare, Linux, Solaris, and Tru64 Unix.
Remote Manager is the most robust of the five anytime, anywhere troubleshooting utilities offered by NetWare 6. You can use Remote Manager to monitor server health, to change the configuration of your server, and to perform diagnostic and debugging tasks.
To access Remote Manager from any Web browser, simply enter the following URL in the Address field:
https://{Server IP Address}:8009
The NetWare 6 Remote Manager window is shown in Figure 15.2. This screen is organized into five different management frames: Health Indicator, Header, Navigation, Main Content, and Online Help.

Using Novell Remote Manager, you can monitor the health of your servers, their processes, and CPU usage. You can also perform common server management tasks such as mounting and dismounting volumes, managing server connections, configuring SET parameters, and shutting down, restarting, and resetting your server. Even though Remote Manager is designed for server-specific administration, it includes a link to iMonitor for eDirectory administration.
From a troubleshooting perspective, Remote Manager might surprise you with its versatility. Using the Console Screens feature, you can view and run all the console screens just as though you were using the keyboard at the server console. In addition, you can monitor a server’s health or access the DEBUG console. In addition, Remote Manager includes a variety of report and log files, including server personal log book, system error log files, abend log, and server health log.
Novell iMonitor enables you to monitor and diagnose servers in your eDirectory tree—regardless of platform. All you have to do is point your Web browser at the server’s 8009 port and NetWare 6 takes over from there. In addition, iMonitor is very secure. It uses the eDirectory ACL (access control list) to deliver frame tools based on the user’s administrative rights.
To use iMonitor, you must first ensure that the appropriate application is running on your eDirectory server. When using NetWare, NDSIMON.NLM is automatically placed in the AUTOEXEC.NCF; therefore, it is launched upon server startup. When the iMonitor application is running on your server, you can access it by entering the following URL in the Address field of your browser:
https://{Server IP Address}:8009/nds-summary

iMonitor enables you to explore the eDirectory environment in great depth. You can also use it to examine what processes are running on your server, when they are running, and what their results are. In fact, iMonitor was created by Novell developers to enable them to diagnose and troubleshoot their code as they were writing NetWare. Cool!
Now you can benefit from all of these hidden troubleshooting capabilities by accessing the following navigation frame tools:
![]() Trace Configuration—This button provides access to NetWare’s DSTRACE eDirectory DEBUG utility.
Trace Configuration—This button provides access to NetWare’s DSTRACE eDirectory DEBUG utility.
![]() Repair—Enables you to view problems with your eDirectory database and back up or clean them as needed. Remember that you must be logged in as Administrator (or Console Operator) to access this iMonitor tool.
Repair—Enables you to view problems with your eDirectory database and back up or clean them as needed. Remember that you must be logged in as Administrator (or Console Operator) to access this iMonitor tool.
![]() Reports—Enables you to configure and display eDirectory and server reports. This tool also allows you to run your own customized reports for troubleshooting diagnosis. See Chapter 17, “Novell eDirectory Troubleshooting,” for more details.
Reports—Enables you to configure and display eDirectory and server reports. This tool also allows you to run your own customized reports for troubleshooting diagnosis. See Chapter 17, “Novell eDirectory Troubleshooting,” for more details.
iManage; therefore, I am.
iManager is an anytime, anywhere advanced administration utility that enables you to perform almost all the eDirectory management tasks typically handled by NetWare Administrator and/or ConsoleOne. iManager is platform independent and Web browser–based. Furthermore, iManager enables you to customize its capabilities based on pre-assigned or customized admin roles.
You can access iManager from any Web browser by entering the following URL in the Address field:
https://{Server IP Address}:2200/eMFrame/iManager.html
The iManager main page (shown in Figure 15.4) consists of the following three functional frames: Header, Navigation, and Main Content. iManager depends on administrative roles to customize its interface. Furthermore, this facility is controlled by an eDirectory feature called Role-Based Services (RBS). As the administrator, you can assign roles to other administrative users in your organization. If assigned a role, that user has the same rights assigned to the role enabling him to perform all tasks contained in that role.

Several new administrative and troubleshooting tools have been added to iManager Version 1.5, which ships with eDirectory 8.7 on the Web Applications CD-ROM. The following is a list of some of the more impressive new iManager categories:
![]() eDirectory Administration
eDirectory Administration
![]() eDirectory Maintenance Utilities
eDirectory Maintenance Utilities
![]() Group Management
Group Management
![]() Novell Certificate Server Manager
Novell Certificate Server Manager
![]() Partition and Replication Management
Partition and Replication Management
![]() Rights Management
Rights Management
Many of these new iManager capabilities contain some key troubleshooting actions. For example, iManager includes a link to iMonitor for performing certain repair tasks. iManager also includes a link to Remote Manager for server-specific maintenance. In addition to these two links, iManager includes some native troubleshooting features, including rights management, schema troubleshooting, server maintenance, and WAN traffic management.
The Novell Web site at www.Novell.com has links to several useful troubleshooting tips and tools. And, as a 21st Century silicon doctor, you must take advantage of all available resources.
The following is a brief description of Novell’s best troubleshooting tools available online:
![]() Solutions—You can access white papers that describe Novell eBusiness solutions that enhance your existing systems. These solutions are designed to help you make sure that every dollar you spend on technology translates directly into lower costs and higher revenues.
Solutions—You can access white papers that describe Novell eBusiness solutions that enhance your existing systems. These solutions are designed to help you make sure that every dollar you spend on technology translates directly into lower costs and higher revenues.
![]() Products—You can access products listed from A–Z. From this page, you can link to any product for information, FAQs, highlights, What’s New, and Novell AppNotes.
Products—You can access products listed from A–Z. From this page, you can link to any product for information, FAQs, highlights, What’s New, and Novell AppNotes.
![]() Training—You can access information about Novell Education products, services, certification, events, and Novell Press. You can also use the training link for access to Novell AppNotes.
Training—You can access information about Novell Education products, services, certification, events, and Novell Press. You can also use the training link for access to Novell AppNotes.
![]() Support/Novell documentation—You can access all Novell product documentation on-line. This documentation includes troubleshooting sections and error code information.
Support/Novell documentation—You can access all Novell product documentation on-line. This documentation includes troubleshooting sections and error code information.
![]() Support/Knowledgebase—Knowledgebase is a convenient way to search Novell Technical Information Documents (TIDs) and product manuals. Many TIDs contain links to downloadable files, patches, and drivers. Novell Technical Support representatives write TIDs as the resolution to support calls. To help you determine which TID is most appropriate for your problem, Knowledgebase includes a sophisticated searching capability.
Support/Knowledgebase—Knowledgebase is a convenient way to search Novell Technical Information Documents (TIDs) and product manuals. Many TIDs contain links to downloadable files, patches, and drivers. Novell Technical Support representatives write TIDs as the resolution to support calls. To help you determine which TID is most appropriate for your problem, Knowledgebase includes a sophisticated searching capability.
![]() Cool Solutions—This hip Web site is dedicated to helping you get the most out of Novell products. Here you’ll find tips, articles, Q&As, and free tools to fill up your medical tool bag. In addition, Cool Solutions includes articles posted by readers who want to share their learning experiences and real-life case studies. These case studies might not fit your specific problem exactly, but they do provide an excellent starting point.
Cool Solutions—This hip Web site is dedicated to helping you get the most out of Novell products. Here you’ll find tips, articles, Q&As, and free tools to fill up your medical tool bag. In addition, Cool Solutions includes articles posted by readers who want to share their learning experiences and real-life case studies. These case studies might not fit your specific problem exactly, but they do provide an excellent starting point.
This completes our first lesson in NetWare Medical School. So, what have you learned? First, you learned that you can use some of our favorite ol’ management utilities for troubleshooting the LAN, server, and eDirectory. Second, you learned that network troubleshooting encompasses more than just file servers. It extends to all other network components, including protocols and clients.
Now let’s extend our medical bag of tricks to include a variety of server and client protocol commands.
Test Objective Covered:
![]() Identify the Purpose and Function of IP/IPX Troubleshooting Tools
Identify the Purpose and Function of IP/IPX Troubleshooting Tools
The next category in our NetWare 6 medical bag is server IP/IPX troubleshooting tools. NetWare’s built-in configuration files and console commands help you troubleshoot IP and IPX problems by giving you information about network configurations, the status of network communications, and links within your internetwork.
In this lesson, you’ll discover the following six NetWare IP/IPX troubleshooting tools:
![]() CONFIG
CONFIG
![]() NSLOOKUP
NSLOOKUP
![]() HOSTS
HOSTS
![]() TCPCON
TCPCON
![]() PING
PING
![]() DEBUG
DEBUG
The good news is all of these tools are built into the NetWare 6 server operating system. Most of them are console commands that you simply type into the server console. The only exception is HOSTS—which is an IP addressing configuration file. Let’s take a closer look at all of these server-based protocol troubleshooting tools.
One of the first things you should do when troubleshooting your NetWare server or protocol is enter CONFIG at the server console. CONFIG returns the following information:
![]() File server name
File server name
![]() Internal network number (of the file server)
Internal network number (of the file server)
![]() Loaded LAN drivers
Loaded LAN drivers
![]() Hardware settings on all network boards
Hardware settings on all network boards
![]() Node (station) addresses of the network boards
Node (station) addresses of the network boards
![]() Communication protocols bound to each network board
Communication protocols bound to each network board
![]() Network number of the cabling scheme for each network board
Network number of the cabling scheme for each network board
![]() Frame type assigned to each network board
Frame type assigned to each network board
![]() Unique distinguished name assigned to each network board
Unique distinguished name assigned to each network board
Domain Name Services (DNS) is a fancy network-based database that matches user-friendly computer names to device IP addresses. DNS naming operates similarly to fully distinguished naming in the eDirectory tree. In the IP world, an absolute DNS domain name is constructed by listing all domains on the path from the end device to the root. Just like eDirectory, a period (.) is used to resolve the labels in the domain name.
If your server is using TCP/IP to communicate with distributed clients, you can use NSLOOKUP to query DNS name servers. This tool enables you to identify your server’s DNS configuration, diagnose DNS setup problems, and identify DNS problems in a server application.
Using NSLOOKUP, you can perform two types of naming searches:
![]() Forward DNSLOOKUP—Matches a domain name to its host IP address
Forward DNSLOOKUP—Matches a domain name to its host IP address
![]() Reverse DNSLOOKUP—Matches an IP address to its friendly domain name
Reverse DNSLOOKUP—Matches an IP address to its friendly domain name
NSLOOKUP is a server console command. To activate this tool, you simply enter the command NSLOOKUP at the server console and press the Enter key. When you do so, the DNS server and its IP address appear. To view a list of NSLOOKUP commands, simply type ? and press the Enter key. When you’re finished using NSLOOKUP, exit the utility by typing EXIT.
All NetWare troubleshooting tools we’ll discuss in this lesson are server console commands except HOSTS. HOSTS, and its big brother HOSTNAME, are configuration files stored in the SYS:ETC directory. If you aren’t using DNS, these files store information about host devices on your IP network. Each entry in the HOSTS file provides alias information (up to 10) for a single HOST and cannot extend beyond one line. The alias is another, shorter name for the same system.
The HOSTS configuration file uses the following syntax:
IP_ADDRESS HOST_NAME [ALIAS1 ALIAS2 ALIAS3 ...]
The HOSTNAME file uses the same syntax; however, it doesn’t include any alias information. In both configuration files, the HOST_NAME entry defines a link between the device IP address and DNS naming information. This name cannot contain a space, tab, number sign (#), or end-of-line character, and each HOST_NAME must be unique.
TCPCON is a server console utility that monitors TCP/IP operations and provides detailed information on the status of network segments, protocols, routing tables and the SNMP trap log. TCPCON enables you to view the configuration and statistics for an SNMP target only, and is an excellent troubleshooting utility for viewing errors that occur within your server’s TCP/IP stack.
To use the TCPCON utility, type TCPCON at the server console and press the Enter key. The initial TCPCON screen displays an IP Forwarded field. If any value is entered into this field (including 0), the server is configured to act as an IP router. Check out Table 15.1 for a brief overview of the areas and statistics available in TCPCON.

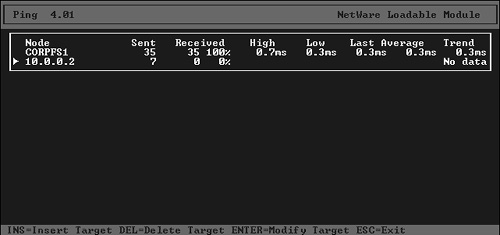
PING is network yodeling. PING continuously transmits echo requests to specific devices and waits for a response. When your system is configured correctly, you can PING a device from the server using the device’s HOSTSNAME or IP address. You can also PING the loopback address (127.0.0.1) to validate the TCP/IP stack within your local server.
When you initially PING another host, the ICMP echo request (type 8) and ICMP echo reply (type 0) are used to verify communications between the server and target device. If you don’t hear a response, the target device is not communicating.
As you can see in Figure 15.5, the NetWare PING utility provides the high and low roundtrip times, as well as the last roundtrip time between your server and target device. It can also tell you the average roundtrip time and trend of roundtrip times to measure distance and network performance. The default packet size for PING is 64 bytes.
The NetWare server supports many DEBUG screens that help you identify and resolve TCP/IP communication problems. Be careful though: Many of these DEBUG screens are IO intensive and can affect server performance. See Table 15.2 for a list of some of the most useful DEBUG settings.

That completes our detailed lesson in NetWare troubleshooting tools available for IP/IPX communications. Remember, the central server is the cornerstone of your network. As such, you should begin there when troubleshooting communication problems. Of course, the answer doesn’t always present itself at the server. Sometimes you must travel to the distributed clients to zero in on a potential solution. Now, let’s explore seven LAN troubleshooting tools available at the Windows Client.
Test Objective Covered:
![]() Identify the Purpose and Function of IP/IPX Troubleshooting Tools (continued)
Identify the Purpose and Function of IP/IPX Troubleshooting Tools (continued)
Your network relies on sensory input from workstations and users for external and internal data. Without data, there would be nothing left to do. In some strange way, workstations give the network a reason to live. As a NetWare doctor, you must make sure that your distributed clients are communicating effectively with the server and its centralized resources.
Both Windows 2000/NT/XP and Windows 95/98/Me workstations provide a variety of troubleshooting tools to help you monitor network communications and provide feedback concerning workstation performance. These tools also enable you to investigate problems associated with workstation connectivity and help you diagnose problems with routers and servers on your internetwork.
In this lesson, we’ll explore seven client-based IP troubleshooting tools:
![]() IPCONFIG
IPCONFIG
![]() PING
PING
![]() ROUTE
ROUTE
![]() TRACERT
TRACERT
![]() NSLOOKUP
NSLOOKUP
![]() ARP
ARP
![]() NETSTAT
NETSTAT
So far, we’ve explored a few of these features from the server’s perspective. Now let’s take a long hard look at what these tools can do for you from the workstation’s point of view.
IPCONFIG is a Windows 2000/2003/NT/XP console command that displays the client IP address, subnet mask, and default gateway for each network adapter bound to TCP/IP (see Figure 15.6). In addition, IPCONFIG /ALL adds WINS and DNS configuration information.
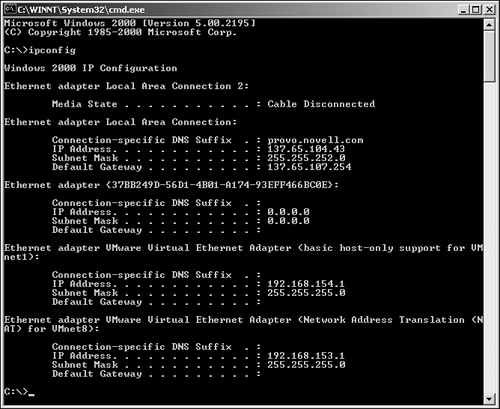
As a Windows console command, IPCONFIG requires that you enter DOS command mode by choosing CMD from the Windows Start menu. In addition to the /ALL parameter, you can also use /RELEASE to release the IP address for a specific adapter or /RENEW to renew the IP address for a specific adapter. This is helpful for resolving DHCP address assignments.
Similar to the PING tool available on the NetWare server, you can use this command from the Windows console as well. PING is one of the first places you should start when troubleshooting client connectivity. Begin by entering PING 127.0.0.1 at the DOS command line. This will cause the client to PING its own internal IP stack, thus validating that communications are active on the network. If a workstation cannot PING its own internal stack, verify that IP address information within the Control Panel is automatically assigned using a DHCP server. If not, there should be a dedicated IP address for the client.
See Table 15.3 for a detailed list of the parameters supported by the client PING command.

Routing is the process of moving packets from point A to point Z on an internetwork. The next two client troubleshooting tools enable you to display and configure information about client-server routing: ROUTE and TRACERT.
See Figure 15.7 for a sample routing scenario. Suppose that the internetwork consists of five subnets (A through E). In this example, workstation 100 sends a message to workstation 300. First, the packet travels directly to router AB, which recognizes that it is for segment C. This is accomplished using an internal routing information table (RIT). Router AB changes the logical address and sends the packet to router BC. Router BC then forwards the packet to the correct segment. In this example, subnets D and E are untouched, and the packet travels a minimum path instead of being broadcasted throughout the network.

Routing uses the following two-step process to enable intermediate network devices to make intelligent decisions about how a package should travel from point A to point Z:
1. Route discovery—During route discovery, the internal Routing Information Protocol builds a Routing Information Table (RIT) for each router that lists all possible paths from the host router to a given destination. Each router builds its own table and continues to modify it as needed.
2. Route Selection—After the RIT information has been gathered, the router uses it to determine an optimal path or route selection.
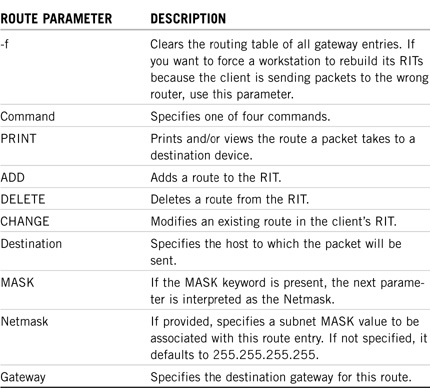
The ROUTE Windows command tells you how a packet is traveling from your client to the central server. When the client needs to route a packet to a remote destination, it looks at its own internal RIT first. This RIT is dynamically learned from the network; however, entries can be placed in the table manually. Examine Table 15.4 for descriptions of all available ROUTE parameters.
Trace Route (TRACERT) is the second of our two client routing troubleshooting tools. If ROUTE tells you how a packet travels from point A to point Z, TRACERT tells you where along the route the packet bogs down. This troubleshooting tool helps define the time needed to reach the routers along the path and identify sluggish bottlenecks. Figure 15.8 shows one possible path to http://www.Novell.com.
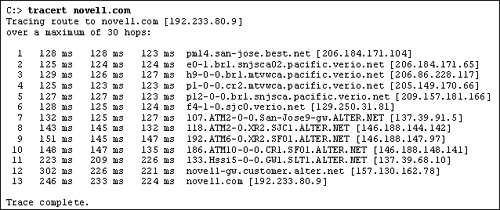
TRACERT uses the Time To Live (TTL) value of each packet to obtain the routers along the path. The following is a list of the four parameters you can use with the Windows TRACERT console command:
![]() -d : Do not resolve addresses to hostnames
-d : Do not resolve addresses to hostnames
![]() -h {maximum_hops}: Sets the maximum number of hops to search for the target
-h {maximum_hops}: Sets the maximum number of hops to search for the target
![]() -j hosts-list: Sets the loose source route along the host list
-j hosts-list: Sets the loose source route along the host list
![]() -w {timeout}: Sets the weight time (in milliseconds) for each reply
-w {timeout}: Sets the weight time (in milliseconds) for each reply
TRACERT responses are not always accurate. If a network supports load balancing (as the Internet does), separate TRACERT tests can yield different paths. In addition, some companies disable ICMP responses to TRACERT to deter hackers from exploring their network and exposing the path to specific devices. In these cases, TRACERT will time out before it reaches the destination device.
Just like at the server, NSLOOKUP at the client provides configuration information for DNS name servers. NSLOOKUP is a Windows console command, and therefore requires access to the DOS command line. This is available using the CMD option within the Start menu.
Remember NSLOOKUP works only if the client is communicating with the network using the TCP/IP protocol.
ARP is the Address Resolution Protocol. ARP combines the client’s logical address with its physical address to create a complete Internet address. In addition, ARP assigns logical names to make addressing more user friendly.
The ARP command enables you to view the workstation’s ARP cache. In addition, you can force an ARP broadcast in an attempt to resolve an IP-to-Ethernet address. This troubleshooting tool will help you determine how ARP entries are being acquired and provide a solution for deleting incorrect entries from the client’s table.

The NETSTAT console command displays details for the protocol operations of the client’s TCP/IP connection. NETSTAT shows statistics for the following Internet protocols: TCP, UDP, ICMP, and IP.
NETSTAT can be used with the -r parameter to show routing tables in dynamic form. For example, if you want to watch the NETSTAT information in real-time, enter an interval (in seconds) following the parameters. Here’s a list of the other parameters supported by NETSTAT:
![]() -a : Shows all connections and listening ports.
-a : Shows all connections and listening ports.
![]() -e : Shows Ethernet statistics (and can be combined with the –s parameter).
-e : Shows Ethernet statistics (and can be combined with the –s parameter).
![]() -n : Shows addresses and port numbers in numerical form.
-n : Shows addresses and port numbers in numerical form.
![]() -p TCP (or UDP) : Shows connections for the protocol specified.
-p TCP (or UDP) : Shows connections for the protocol specified.
![]() -s : Shows protocol-specific statistics. By default, statistics are shown for TCP, UDP, and IP.
-s : Shows protocol-specific statistics. By default, statistics are shown for TCP, UDP, and IP.
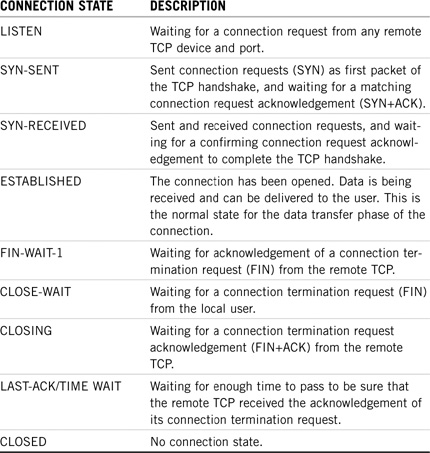
When you use NETSTAT at the client command line, it will provide the local address, foreign address, and connection state for each of the protocols specified. Look over Table 15.6 for a description of the different connection states supported by NETSTAT.
Congratulations! So far, you’ve acquired three separate compartments and 18 troubleshooting tools for your NetWare medical bag. In these lessons, we’ve discovered some hidden troubleshooting capabilities within NetWare’s five central management utilities—ConsoleOne, Remote Manager, iMonitor, iManager, and Novell.com. Then we explored six built-in NetWare commands and seven Windows-based client troubleshooting tools. That’s enough to keep any NetWare troubleshooter way ahead of the game.
However, you’re no ordinary NetWare troubleshooter. You’re a CNE. Because of that, I’ll arm you with three more valuable network troubleshooting tools: protocol analyzers, TCP/IP Toolkit, and IP address calculators. Sometimes you need an extra-power tool to get the job done.
Test Objectives Covered:
![]() Identify the Purpose and Function of IP/IPX Troubleshooting Tools (continued)
Identify the Purpose and Function of IP/IPX Troubleshooting Tools (continued)
![]() Identify Additional Network Troubleshooting Resources (continued)
Identify Additional Network Troubleshooting Resources (continued)
Network troubleshooting tools encompass more than just file servers and workstations. These tools must extend to all of the networking components, including network adapters, cabling, and data. In addition, you must identify performance bottlenecks and implement solutions to troubleshoot and optimize network communications.
Network bottlenecks slow you down. If the disk is full, you cannot print. If the printer’s down, you cannot access a file. As a network troubleshooter, you must be able to quickly identify bottlenecks and take steps to resolve them. In addition, bottlenecks are interdependent, which means that a problem in one of your network’s components can bring the entire network to its knees.
In this lesson, we’ll explore three final network troubleshooting tools to help us optimize network communications:
![]() Protocol analyzers
Protocol analyzers
![]() TCP/IP toolkits
TCP/IP toolkits
![]() IP addressing calculators
IP addressing calculators
The most important thing to remember in this lesson is that your LAN is only as strong as its weakest component. Now, let’s start one of the most powerful troubleshooting toolsets: protocol analyzers.
Protocol analyzers enable you to monitor network performance, troubleshoot network errors, optimize the network, and plan for growth. One of the most popular protocol analyzer is LANalyzer. This combination of software and hardware gathers, sorts, and reports data about how your network is running.
During a typical protocol analysis session, you must perform the following five tasks:
1. Access the network—Protocol analysis begins by plugging the device into the same hub as the central server.
2. Capture the traffic—Next, you must capture trend data for a minimum of one month. This information isolates bandwidth, kilobytes, packets, and errors. A baseline is established as a simple measurement of your network’s typical performance.
3. View the captured traffic—The baseline information is gathered over time and plotted on trend graphs to create the foundation of your fitness program. To complete your baseline, you should track the most active users, servers, and routers on your network. This will indicate basic network load balancing for future planning.
4. Filter out and view just the needed traffic—In addition, you can use the analyzer’s display filter to view just the packets you’re interested in. Filtered packets enable you to focus on anomalies in your network.
5. Document your findings—After you’ve established a baseline and built a display filter, you can document your findings. A seasoned CNE will be able to quickly identify communication problems within the network and implement appropriate solutions.
Every network can benefit from a quick review of network performance. You can use a protocol analyzer to analyze your network’s performance regardless of the protocol media access type. For example, you can use an analyzer to identify excess ICMP redirection messages and reconfigure devices to use a more appropriate default gateway. Similarly, you can identify and remove devices causing excessive broadcasts on the network.
Protocol analyzers also enable you to tune up your router configurations to reduce the routing protocol overhead caused by these excessive periodic broadcasts. Finally, you can use protocol analyzers to remove unsuccessful discovery processes that are running on the network.
When you test an application or plan for growth, you can use a protocol analyzer to determine how much bandwidth a single user requires to run a particular application on the network. Then you can multiply this number by the number of users who will ultimately use the application to determine whether you have enough bandwidth on the segment to support the application. This is just another example of how protocol analyzers help you troubleshoot and optimize your network.
So far, we’ve discovered several built-in network troubleshooting tools at the NetWare server and Windows workstation. In addition, there is a whole world of third-party TCP/IP toolkits available out there. Two of the most popular are iNetTools and NetScanTools.
A company called WildPackets provides iNetTools. In addition to standard features, such as PING and TRACERT, iNetTools provides the following:
![]() PINGSCAN—PINGs a range of addresses
PINGSCAN—PINGs a range of addresses
![]() Finger—Gathers user information on an email address
Finger—Gathers user information on an email address
![]() WHOIS—Queries a WHOIS server for intranet directory information
WHOIS—Queries a WHOIS server for intranet directory information
![]() Throughput—Tests the throughput of FTP and HTTP downloads
Throughput—Tests the throughput of FTP and HTTP downloads
![]() Network Statistics—Runs the NETSTAT –r –s command
Network Statistics—Runs the NETSTAT –r –s command
![]() ARP Cache Content—Displays any locally cached results of ARP requests
ARP Cache Content—Displays any locally cached results of ARP requests
![]() Internet Port Descriptions—Lists Internet port numbers and descriptions downloaded from the IANA (Internet Assigned Numbers Authority) site
Internet Port Descriptions—Lists Internet port numbers and descriptions downloaded from the IANA (Internet Assigned Numbers Authority) site
NetScanTools Pro 2004 was developed by Northwest Performance Software as a comprehensive protocol analyzer. The following is a list of the network troubleshooting features included in NetScanTools Pro 2004:
![]() DHCP Test—Enables you to discover DHCP servers on your local subnet and use this information to document dynamic IP addressing.
DHCP Test—Enables you to discover DHCP servers on your local subnet and use this information to document dynamic IP addressing.
![]() Echo—Echo is a TCP or UDP service that echoes back all characters received on specific monitoring ports.
Echo—Echo is a TCP or UDP service that echoes back all characters received on specific monitoring ports.
![]() Finger—Provides a client interface to a remote Finger server. The server provides user information via email addressing.
Finger—Provides a client interface to a remote Finger server. The server provides user information via email addressing.
![]() IP Packet View—Launches a separate application to capture IP packets and analyze network communications on Windows 2000/XP workstations.
IP Packet View—Launches a separate application to capture IP packets and analyze network communications on Windows 2000/XP workstations.
![]() NetTopography—Provides a map of the routers and gateways along the various routes to a user-defined list of target hosts.
NetTopography—Provides a map of the routers and gateways along the various routes to a user-defined list of target hosts.
![]() NetScanner—Sweeps a sequential IP address range and PINGs every IP address to verify communication.
NetScanner—Sweeps a sequential IP address range and PINGs every IP address to verify communication.
![]() Port Probe—This tool is an active scanning feature to determine which ports on a target computer are active and being used by specific services.
Port Probe—This tool is an active scanning feature to determine which ports on a target computer are active and being used by specific services.
![]() Whois—A client utility that interfaces with remote WHOIS server databases.
Whois—A client utility that interfaces with remote WHOIS server databases.
![]() WinSock Info—Provides basic information about the active Windows sockets software interface layer running on your client.
WinSock Info—Provides basic information about the active Windows sockets software interface layer running on your client.
IP addressing is one of the most challenging aspects of network troubleshooting. Logical IP addressing uses a combination of physical addressing and logical network addressing. This address consists of a 32-bit, dotted-decimal value that contains both network and host address components.
It’s fairly common to express IP addresses in binary (base 2) format. This is especially helpful when implementing or decoding addresses on the network. In this notation, each bit represents a value ranging from 128 (leftmost position) to 1 (rightmost position). Using this scheme, IP can identify any network using one of the following five classes: Class A (small number of networks and large number of hosts), Class B (equal support for networks and hosts), and Class C (large number of networks and small number of hosts). In addition, Classes D and E are reserved for special addressing.
Fortunately for you, WildPackets offers a free IP subnet calculator to help you configure your network design and/or check existing IP addressing. Subnetting enables you to extend IP addresses by breaking up the internal network address into “sub” nets. With this scheme, external Internet devices cannot access internal devices directly, but they are aware that a network has been subnetted.
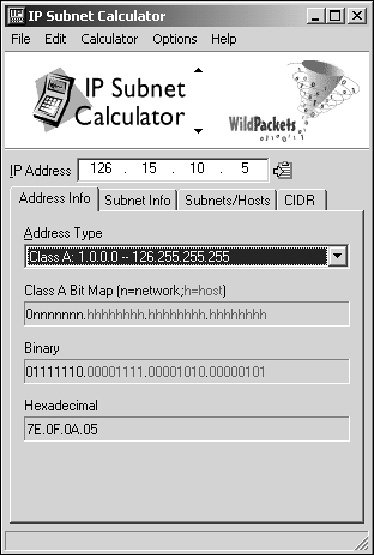
The IP subnet calculator computes subnet information based on the IP address and class and the number of subnet bits being used. As you can see in Figure 15.9, the WildPacket calculator includes the following four tabs:
![]() Address Info—This tab provides information about address fields given an IP address class. Using color coding, you can easily detect the role of individual bits in the address class. This tab is activated in Figure 15.9.
Address Info—This tab provides information about address fields given an IP address class. Using color coding, you can easily detect the role of individual bits in the address class. This tab is activated in Figure 15.9.
![]() Subnet Info—This tab contains user-configurable parameters to setup a subnet policy. The following options can be used to determine the number of subnet bits to use when calculating the subnet mask: mask bits, subnet mask, max subnets, and max hosts per subnet. In addition, the Subnet Host Address Range lists all possible addresses that hosts can own on the same subnet.
Subnet Info—This tab contains user-configurable parameters to setup a subnet policy. The following options can be used to determine the number of subnet bits to use when calculating the subnet mask: mask bits, subnet mask, max subnets, and max hosts per subnet. In addition, the Subnet Host Address Range lists all possible addresses that hosts can own on the same subnet.
![]() Subnets/Hosts—This tab displays a table of the subnet number, subnet ID address, host address range, and the subnet broadcast address for each possible subnet in the current addressing scheme.
Subnets/Hosts—This tab displays a table of the subnet number, subnet ID address, host address range, and the subnet broadcast address for each possible subnet in the current addressing scheme.
![]() CIDR—This tab enables you to specify the number of bits to use in the CIDR (Classless Interdomain Routing) mask.
CIDR—This tab enables you to specify the number of bits to use in the CIDR (Classless Interdomain Routing) mask.
And that completes our NetWare medical bag! Yeah!
Let’s review: It all started with five ol’ friends in the NetWare management arena: ConsoleOne, Remote Manager, iMonitor, iManager, and Novell.com. I bet you didn’t realize how much life these old tools still have in them.
Next, we explored five console commands and one configuration file at the NetWare server. These server-based IP/IPX troubleshooting tools armed us with some excellent diagnostic and troubleshooting capabilities from the server’s point of view. Then, we bounced over to the client and discovered seven IP troubleshooting tools built into Windows. Finally, our NetWare medical bag was complete with protocol analyzers, TCP/IP toolkits, and IP addressing calculators.
Well, there you have it: your NetWare medical bag in a nutshell. See what you have to look forward to? So, are you prepared for the rigors of medical school? If you think this first chapter was fun, wait until you see what’s in store in Chapter 16, “Novell Server Troubleshooting,” and in Chapter 17, “Novell eDirectory Troubleshooting.”
Scalpel not included.