
6. Beyond the Basics
This chapter contains guidelines for dealing with several aspects of documentation that either span views or are not specific to any particular category of views:
6.1 Refinement. Refinement is a way to reveal more information over time as it becomes available. Refinement reflects how architectures develop over time, and it lets architects present information in more or less detail to serve various audiences. This section discusses two kinds: decomposition refinement and implementation refinement.
6.2 Descriptive completeness. Does your architecture document tell the truth, the whole truth, and nothing but the truth? There may be good reasons why it doesn’t.
6.3 Documenting context diagrams. A context diagram establishes the boundaries for the information contained in a view. A context diagram for the entire system defines what is and is not in the system, thus setting limits on the architect’s tasks. This section discusses how to document context diagrams, and how to tailor context diagrams for each view.
6.4 Documenting variation points. Some architectures provide built-in variation points to facilitate building a family of similar but architecturally distinct systems. Other architectures are dynamic, in that the systems they describe change their basic structure while they are running.
6.5 Documenting architectural decisions. Why we made architectural decisions the way we did is just as important as the results of those decisions. This section discusses how to record the rationale behind your design.
6.6 Combining views. Prescribing a given set of rigidly partitioned views is naive; there are times and good reasons for combining two or more views into a single combined view.
6.1 Refinement
Architects need a way to carry out their designs and present information in a view in manageable chunks. Refinement allows the architect to present information in separate, digestible pieces. A refinement elaborates on (adds information to) an existing representation. Refinement allows the architect to capture and present information with more or less detail. Less detail is useful in early stages of design, and excellent for introductions, overviews, and early conceptualizing.
![]()
Refinement is the process of gradually disclosing information across a series of descriptions.
There are two important kinds of refinement: decomposition refinement and implementation refinement.
6.1.1 Decomposition Refinement
A decomposition refinement elaborates a single element to reveal its internal structure and then recursively refines each member of that internal structure. The text-based analogy of this is the outline, whereby major sections (denoted by roman numerals) are decomposed into subsections (denoted by capital letters), which are decomposed into sub-subsections (denoted by Arabic numerals), and so forth.
![]()
Decomposition refinement is a refinement in which a single element is elaborated to reveal its internal structure. Each member of that internal structure may be recursively refined.
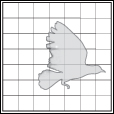
Using decomposition refinements in a view carries an obligation to maintain consistency with respect to the relation(s) native to that view. For example, suppose that the relation shown in Figure 6.1(a) is send-data-to. Because element B is shown as both receiving and sending data, the refinement of B in Figure 6.1(b) must show where data can enter and leave B: in this case, via B1.
Figure 6.1 (a) A hypothetical system consisting of three elements: A, B, and C. Arrows signify data flow.
(b) Element B is refined to show that it consists of elements B1, B2, B3, and B4. Because B has two inputs and one output, B’s decomposition refinement must satisfy that obligation. Children B1 and B3 receive the inputs; B3 produces the output.
Decomposition refinement is straightforward to depict in UML if the UML construct representing the elements supports nesting, such as a component or a package. Inside the refined element, use delegation connectors to show the association between the outer element’s interfaces and the inner elements. Figure 6.2 shows an example.
Figure 6.2 Showing decomposition refinement in UML 2.x. Figure 6.2(b) is a decomposition refinement of Figure 6.2(a).

6.1.2 Implementation Refinement
Another kind of refinement, called implementation refinement, shows the same system—or portion of the system—in which many or all the elements and relations are replaced by new ones, usually of a different type. Unlike a decomposition refinement, the scope doesn’t zoom in, but remains fixed. The implementation refinement reveals information showing how the original construct will be realized.
![]()
Implementation refinement is a refinement in which some or all of the elements and relations are replaced by other, more implementation-specific, elements and relations.
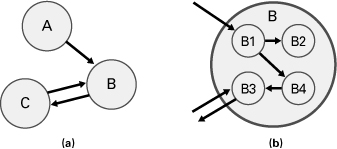
For example, imagine two views of a publish-subscribe system, as shown in Figure 6.3. In one view, components are connected by a single event bus. In the refined view, the bus is replaced by an event dispatcher to which the components make explicit calls to achieve their event announcements.
Figure 6.3 Version 2 is an implementation refinement of version 1, showing that the publish-subscribe bus is actually realized by an event dispatcher.
6.1.3 Spectrum of Design
Through the use of refinement, architects can manage the specificity of their architecture documentation (and its underlying architecture design). This varies depending on a variety of factors, such as the stage of design, the amount of resources available to nail down the design and produce the corresponding documentation, the audience for whom that documentation is being written, and the maturity of the system. The result is a spectrum of design.
![]()
A marketecture . . . is a one page, typically informal depiction of the system’s structure and interactions. It shows the major components, their relationships and has a few well chosen labels and text boxes that portray the design philosophies embodied in the architecture. A marketecture is an excellent vehicle for facilitating discussion by stakeholders during design, build, review, and of course the sales process. It’s easy to understand and explain, and serves as a starting point for deeper analysis.
—Ian Gorton, Essential Software Architecture (2006, p. 6)
At the left end of the spectrum, the designs (and their documentation) are broad, very abstract, and unrefined. Early in the design, broad information is all the architect has. Happily, the documentation of these early design stages is not wasted. Architects often need to convey broad architectural understanding quickly to an audience that includes nontechnical stakeholders: sponsors, managers, chief information officers, visitors, and others. Such stakeholders do not want to pore over a complete architecture document. The description doesn’t have to be precise, it may not even need to be completely accurate, and the intent is not to instill deep understanding in the audience. Sometimes the intent is to instill a sense that the people doing the presentation know what they’re talking about.
Of course, other stakeholders (such as developers and those who need to analyze specific properties of the architecture) need the whole picture. They are the consumers of the documentation after detail and elaboration have been added through the progressive refinement that happens as the architect collects more information and makes more design decisions.
![]()
I’ve often found the need for four different architecture presentations: the slides for the 10-minute presentation, the slides for the 1-hour presentation, the 50-page document, and finally the full document.
—Philippe Kruchten
One of the specific ways that the design moves to the right along the spectrum is through style specialization.
6.1.4 Style Specialization
When picking a style for a view, one important dimension of choice is how specialized that style is. The more specialized a style is, the more constrained the architecture design space that uses it will be. In exchange for limiting the class of systems that are in the scope of that style, specialization has a number of benefits, including the following:
• Stronger guidance for the architect, through the inclusion of constraints associated with the style
![]()
“Advice: Building an Architecture Overview Presentation,” on page 364 in Chapter 10, shows how to build a viewgraph presentation from a software architecture document.
• The ability to exploit specialized analyses, by leveraging semantic properties of the system, such as computational model and style-specific properties
• Reuse of implementation, such as middleware to support communication and common services for components in that style
Figure 6.4 illustrates the idea for component-and-connector (C&C) views. Moving to the right, styles become progressively more specific and constrained. At the left end of the spectrum are the most generic, and hence least constrained, styles. There a C&C style uses only generic components and connectors, allowing complete freedom of expression, but carrying none of the benefits mentioned above. Here the vocabulary consists of the generic categories of C&C style (call-return, data flow, event-based, and others) that impose constraints over component-and-connector types and support a specific computational model. Moving farther to the right are specializations of those styles, such as the examples described in Chapter 4 (client-server, pipe-and-filter, publish-subscribe, tiered, service-oriented, and more).
Figure 6.4 Style specialization

Farther right are styles that make stronger commitments to a particular domain, and typically provide an increasing basis for code reusability. For example, a Java EE-based style specializes tiered systems, introducing component types such as servlet, Enterprise JavaBean, and container components, while providing considerable implementation support for distribution, remote method invocation, transaction support, and persistence. One step to the right we find further specialization of the styles. For example, the Spring framework defines a specific way to implement Java EE applications, adopting patterns such as inversion of control and model-view-controller, and introducing element types such as Controller, View, and View-Resolver. Farther to the right, we might see architecture styles for product lines, which are targeted to the needs of systems within a particular company.
The choice of a domain-specific style often relates to the maturity of a family of architectures within a company, business segment, or engineering domain. For example, in the early days of client-server-based information systems, there was very little architecture guidance and reusability, beyond the need for clients, servers, and some form of remote invocation. Developers of such systems had to rely on relatively primitive forms of support for distributed communication, such as sockets and remote procedure call. As the field matured, so did frameworks such as .NET and Java EE, enabling far greater use of infrastructure, exploitation of common services, and guidance for construction of systems using these frameworks.
6.2 Descriptive Completeness
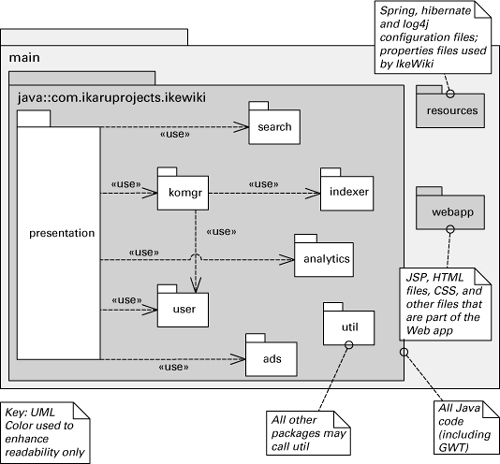
Related to refinement is the concept of descriptive completeness. Figure 6.5 shows an architecture diagram for an imaginary system. Element A is related to element B in some way—the diagram does not disclose how—B is related to C, and C is related to B. If you’re a “consumer” of this diagram, what can you conclude about whether A and C are related?
Figure 6.5 Element A is related to B, B is related to C, and C is related to B. What is the relation between A and C?

![]()
Descriptive completeness is a property of architecture documentation. Documentation has descriptive completeness if it documents all elements and relations in the system that are in the documentation’s scope.
You might say A and C are not related, because the diagram shows no arrow between A and C. Or you might say that this diagram reveals no relationship between A and C, but it is possible that this information was considered too detailed or tangential for the diagram. Subsequent documentation may reveal that A and C share this relation.
Either answer might be correct, as each represents a different strategy for documentation. The first strategy says that the views are written with descriptive completeness; the second says they are not.
The same question can be asked about elements. In Figure 6.5, can we then presume that A, B, and C are the only elements involved? If the figure reflects descriptive completeness, then yes. Otherwise, no; perhaps in an elaboration or an augmentation of this view, another element will be shown, as in Figure 6.6.
Figure 6.6 An elaboration to Figure 6.5 showing an additional element, D

Why would an architect omit some elements and relations in a view? There are some good reasons:
• It’s early in the design. We don’t know yet all the elements and relations that are part of the solution. Or we don’t have time to complete the diagram right now, so we focus on the most important elements and relations.
• We want to show the most important parts of the view (and may produce an accompanying refinement showing more of the design separately). Perhaps it’s for an overview. Perhaps an element or relation is used only in special situations (such as error recovery) and we don’t want to clutter the diagram to cover these special cases. Or maybe an element or relation is simply deemed less important and is left out.
• We want to reduce clutter in our diagrams. Maybe the same relation exists between most or all elements in the diagram, so we explain that in text (perhaps in a comment box) rather than graphically to avoid cluttering the diagram.
In Section P.5, we admonished you to explain your notation. The issue of descriptive completeness is a special case of that. You simply need to specify which of the two strategies your documents follow.
Advice
If you create a diagram that is not complete, here a few things you can do to inform the reader:
• Use ellipses (“. . .”) to indicate in the diagram that there are other elements or relations not shown. In the key, explain the meaning of the ellipses. Figure 6.7 is an example.
Figure 6.7 Module decomposition diagram that is not complete, as indicated by the ellipses (“. . .”). For packages whose submodules are shown and there is no “. . .”, the reader can assume all submodules are displayed.

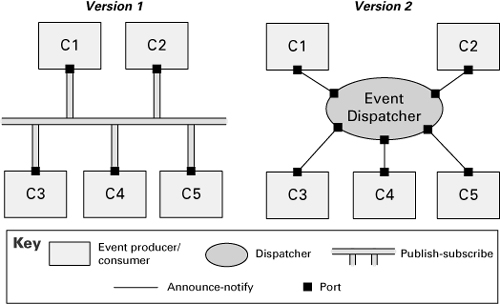
• Use a comment box in the diagram to explain to the reader that not all elements or relations are being exhibited. Figure 6.8 is an example.
Figure 6.8 Module uses diagram that does not show all usage dependencies, as indicated by the comment box attached to package util. To avoid cluttering the diagram, the author decided to use that comment box instead of drawing <<use>> dependencies from all other packages to util.
• Put a note in the key that says the diagram may not be complete and that other elements or relations may exist in subsequent refinements.
6.3 Documenting Context Diagrams
The purpose of a context diagram is to depict the scope of a view. Many, if not most, context diagrams in practice are top-level context diagrams (TLCDs), but context diagrams are also useful when an architecture document is explaining a subset of the system, such as a subsystem or even a single architecture element. Those smaller pieces have context as well, and understanding the context helps understand the subsystem or element. Here, “context” means an environment with which the part of the system interacts.
![]()
A context diagram defines the boundary between a system (or part of a system under consideration) and its environment, showing the entities in its environment with which it interacts.
A top-level context diagram is a context diagram in which the scope is the entire system.
Entities in the environment may be humans, other computer systems, or physical objects, such as sensors or controlled devices. In the case of a context diagram for a subset of the whole system—that is, when the context diagram is not a TLCD—the entities in the environment may well be other entities that belong to the same system as the subset.
![]()
A top-level context diagram makes a good first introduction to a system and its architecture description. It can serve as the jumping-off point for delving into deeper architecture detail in any number of directions.
A context diagram is useful because it clarifies what are the parts of the whole solution you have to develop. Sometimes an organization is asked to develop a system that is part of a larger system, and a context diagram (in this case, a TLCD) depicts that. Sometimes supporting frameworks and libraries, external Web services, off-the-shelf software, other systems of the same organization, or some other tangential software is considered outside the scope of the system being developed. A context diagram clarifies what is in and what is out.
6.3.1 Create Context Diagrams Using the Vocabulary of the View
Remember that your architecture document will consist of a number of different views, and each view will include a context diagram. Will each of these context diagrams be the same? No! That would be unnecessary repetition.
![]()
Describe the context of the system being developed using the vocabulary of the view that you’re documenting.
Instead, let the vocabulary of the view—that is, its element types and relation types—determine what its context diagram should show. For example:
• The vocabulary of a decomposition view is “module” and “is part of.” Sometimes an organization is asked to develop a system that is part of a larger system, and a context diagram depicts that. If so, then this relationship between what is being developed and the larger system is shown in the context diagram for the decomposition view. The system being developed can be shown as nested inside the larger system.

• The vocabulary of a uses view is “module” and “uses.” The context diagram for a uses view shows what external entities use or are used by the system under development.

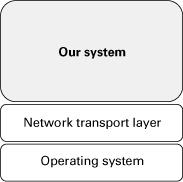
• The vocabulary of a layered view is “layer” and “is allowed to use.” Sometimes the system being developed sits atop a layer provided externally, or sometimes the system being developed is the infrastructure or computing layer that can be used by application software developed elsewhere. In that case, the context diagram for a layered view would show the system under development as a layer above or below somebody else’s layers.
• The vocabulary of any kind of C&C view is, generally speaking, components and connectors and runtime interaction. The context diagram of a C&C view will show runtime interaction between the system being developed and external entities, specialized as appropriate. The “traditional” context diagram is, in fact, a context diagram for a C&C view.

• The vocabulary of a deployment view is the “is allocated to” relation between software and runtime hardware. Thus the context diagram for a deployment view will show any software external to the system being developed that is also allocated to the same hardware.
If you are documenting a view and the context diagram for it does not apply—for instance, if you’re documenting a layered view and there are no external layers above or below the system being developed—then simply mark the context diagram for that view as “Not applicable.”
![]()
If the context diagram for a particular view doesn’t apply, mark it as “Not applicable.”
6.3.2 Content of a Context Diagram
Context diagrams show the following:
• A depiction of the system—or part of the system—whose architecture is being documented.
![]()
Use some sort of distinguished symbol, such as a thick outline or a hashed interior, to clearly denote the system whose context is being shown.
• External entities.
• Relations with external entities that the system has. The external entities are shown outside the distinguished symbol for the system being described; the relations are expressed in the vocabulary of the category of the containing view.
• A key that explains the notation used in the context diagram, as is the case for all graphical figures.
A pure context diagram does not disclose any architecture detail about the system—it just appears as an undecomposed block—although in practice, context diagrams may show some internal structure of the system being put in context. Context diagrams do not show any temporal information, such as order of interactions or data flow. They do not show the conditions under which data is transferred, stimuli fired, messages transmitted, and so on.
6.3.3 Context Diagrams and Other Supporting Documentation
Context diagrams impart some obligations on the other supporting documentation in a view.
• The view’s element catalog should include a description of the external elements shown in the context diagram. You should give a reference to the documentation in which the external entities’ interfaces are documented.
![]()
Element catalogs are described in Section 10.1.
• The view’s rationale section should explain the reasons for drawing the boundary where it is.
• If the system has an interface with its environment shown in the context diagram, that interface needs to be “assigned” to one of the system’s architecture elements. So every interface between the system and its environment that appears in a context diagram should also appear on one of the elements shown in the primary presentation.
6.3.4 Notations for Context Diagrams
Informal Notations
Informally, context diagrams consist of a circle-and-line or box-and-line drawing, with the entity being defined depicted in the center as a distinguished circle or box, the entities external to it depicted as various shapes, and lines depicting relations connecting the entities as appropriate.
Structured analysis, the software design discipline that brought context diagrams into the mainstream, uses an informal notation to depict what we would call a C&C-type context diagram. The system is represented by a distinguished symbol in the middle, external entities are boxes, and the lines connecting them indicate data flow and runtime interaction.
Because context diagrams are often used to explain systems to people who know more about the externals of the application than the internals, such diagrams can be quite elaborate and use all sorts of idiomatic symbols for entities in the environment.
Figure 6.9 shows a context diagram created using an informal box-and-line diagram. Because the relation shown in the diagram is data flow (a runtime relation), we can tell that this is the context diagram for a C&C view of some kind.
Figure 6.9 Context diagram for a C&C view using an informal notation. The example is taken from the Adventure Builder system (Adventure Builder 2010).

Context diagrams can be depicted easily using tables. This is useful when there are too many interactions conveniently to show graphically. For example, a table depicting the data flow context diagram in Figure 6.9 would give the following:
• The identifier for each piece of data transferred across the environment boundary (such as a message identifier)
• A description
• The element that sends it
• The element that receives it
• Some information about it, such as what you would find in a data dictionary
Some software development standards prescribe a document with a name such as “Interface Requirements Specification,” whose contents consist chiefly of long tables describing messages sent to and from the system. These documents are effectively context diagrams.
UML
UML does not have an explicit mechanism for a context diagram. However, diagrams that are appropriate for the various views are also good for showing the context of a given view. Recalling the principle that the context diagram for a view should describe the context using the element-type/relationtype vocabulary of the view that you’re documenting, the same UML notation you use in a view’s primary presentation can be used in that view’s context diagram.
For instance, you can use component diagrams to show a C&C view’s context diagram. Or you can show the context diagram of a decomposition view with nested packages. Or you can show the context diagram of a layered view using packages and <<allowed to use>> dependency arrows. And so forth.
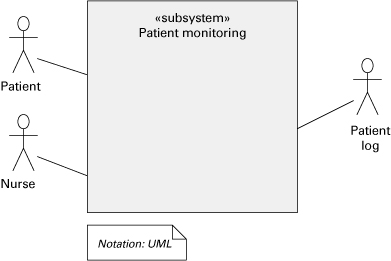
A more general, though less informative, way to show context in UML is with a combination of use case and class diagrams as shown in Figure 6.10. Here the system’s distinguished symbol is an appropriately stereotyped class and environment elements are shown as actors.
Figure 6.10 Description of a system context, using a UML class diagram. The class stereotyped as <<subsystem>> depicts the system whose context is shown; Patient, Nurse, and Patient log are external entities.
6.4 Documenting Variation Points
6.4.1 What Are Variation Points?
Variation points are places in the architecture where specific instances of flexibility have been built in. The flexibility is achieved by intentionally leaving specific architectural decisions open, but in a way so that they can be easily bound later, almost always by someone other than the architect. Architects design variation points into an architecture to achieve variability, which is the ability quickly to achieve change in preplanned ways.
![]()
A variation point is a place in the architecture where a specific kind of flexibility has been built in.
Variability is the ability to quickly achieve change in preplanned ways.
Providing variation points in an architecture is desirable in the following situations:
• Some set of decisions has not yet been made during the design process for a single system, but options have been explored.
• The architecture for a single system is prepared for envisioned future changes.
• The architecture provides basic functionality that can be extended easily.
• The architecture is for a family or product line of systems, and the option taken will depend on the specifics of the particular member of the family to be constructed.
![]()
See “Coming to Terms: Product-Line Architectures” on page 234 in this chapter.
• The architecture is a reference architecture for a collection of systems and contains explicit places where configurations and extensions to the reference architecture can occur.
Variation points can occur at any place in an architecture. They can affect elements and relations, the properties of those elements and relations, as well as their behavior. They can even affect the relations between views. For example, a simple element may run on the same processor with other elements, but a more complicated variant might need to run on its own dedicated processor.
Document variation points where they occur: in diagrams, element catalogs, behavioral descriptions, interface descriptions, and so forth. But fully describing the effects and ramifications of each variation point, as well as how to exercise the choice offered by a variation point, is best done in one place, called a variability guide.
![]()
A variability guide is the place in an architecture document that explains what variation points have been designed into the architecture and gives advice about how to exercise them.
Documenting variation points where they occur throughout the architecture documentation has the advantage that the description is available where it is needed. But it also has the disadvantage that pretty soon no one has the complete overview of which variation points exist in the system. Just as an element catalog serves as a complete repository of elements in a view, the variability guide will list and explain all of the variation points in a view.
![]()
A variation mechanism is a built-in software mechanism for making a change that, when exercised, results in a new instance of the architecture. The place where a variation mechanism occurs marks a variation point.
6.4.2 Variation Mechanisms
Architects design a variation point by selecting a variation mechanism that can be exercised to achieve one of the options provided. Some of the more prominent architecture variation mechanisms include the following:
• Element substitution. Replacing the implementation of a module or component with a different implementation that still honors (or “realizes”) the same interface. This might provide one version of a system with a feature that behaves one way, whereas the second version’s feature would behave in a different way.
• Component replication. Creating multiple instances of a component to provide greater capability in some fashion. For instance, Web-based systems may allow the deployment of Web components to multiple machines and the configuration of the number of instances on each machine. Such configuration is tuned to achieve the desired throughput and availability.
• Optional inclusion. In some versions of a system, a component might be present, whereas in another it might be omitted. This allows a system to have, or not have, a particular feature. Optional components are many times called plugins or add-ons.
• Frameworks. A framework is an abstraction in which common code providing generic functionality can be selectively overridden or specialized by user code providing specific functionality.
![]()
A framework is an abstraction in which common code providing generic functionality can be selectively overridden or specialized by user code providing specific functionality.
• Parameterization. To allow variation in a wide range of constructs. Common examples include values of file names, URLs, user credentials, and lower-limit or upper-limit values.
• Element composition. Assembling new elements by putting together existing elements. (A tool that does this is sometimes called a configurator.)
• Templates. Providing a generic body that is almost, but not quite, complete. Downstream designers fill in the open parts as needed. Templates are often for code, but they can also be architectural: for instance, an architecture diagram that has “empty” parts that need to be filled in.
• Inheritance. Defining generic classes and interfaces. Different variations can be implemented (possibly by different vendors) by creating specific subclasses or classes that realize the interfaces.
• Generator. A generator is a software program that takes as input some specification of a desired program and produces as output a program that meets that specification.
6.4.3 Dynamism and Dynamic Architectures
![]()
A dynamic architecture is one in which architecture variation points are exercised at runtime.
When the binding time of a variation point is runtime, we say that this is a dynamic architecture. Architectures change during runtime in response to user requirements or to better enable the achievement of particular quality attributes. A Web browser that can go to a Web site, download a plug-in, and then start using it to handle a new media type has a dynamic architecture; its runtime architecture comprises more components after the download than before. An architecture can change dynamically by creating (including) or deleting (dropping) components and connectors, including replicas. For example, when a new user enters an environment and wants new services, components to provide those services would be created. When the user leaves the environment, the components would be deleted. The created component or connector may be a replica or a singleton. In any case, the architect should document the number of allowable replicas, the conditions under which the creation or deletion occurs, and the connectors or components that are created.
Another way an architecture can change dynamically is by reallocation of resources or responsibilities. Components may be moved from one processor to another to offer better performance. Responsibilities may be shifted among components: perhaps a backup could assume primary status in the event of a failure.
Happily, documenting a dynamic architecture is no different than documenting other kinds of variation points; the binding time is always runtime.
6.4.4 Documenting Variation Points
Variation points should be documented in two ways. First, their existence should be noted in the appropriate places throughout the view (primary presentation, element catalog, context diagram, and so on) for the view in which they are visible. Second, the variation point should be explained in the view’s variability guide.
![]()
Showing variation points graphically can lead to diagrams that are cluttered and hard to read, especially if you try to show dependencies among variations graphically. Instead, you can annotate your diagram with a pointer to an entry in the variability guide (described in Section 10.1).
To show a variation point in a diagram, you can attach an annotation to the area affected by a variation point. With a suitable identifier (for example, “VP12”), the annotation can point to the location in the variability guide where the variation point is explained in full.
Other graphical approaches for showing the existence of variation tend to depend on the variation mechanism that the architect has chosen. For example:
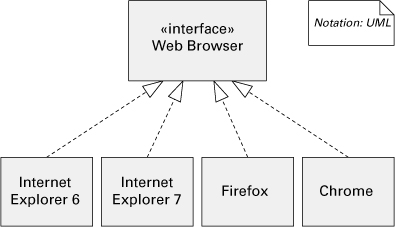
• Element substitution. The UML relation “realizes” is a good way to depict this by showing that an interface can be realized by any number of implementations. Graphically, this is shown in Figure 6.11.
Figure 6.11 Element substitution as expressed by the “realizes” relation
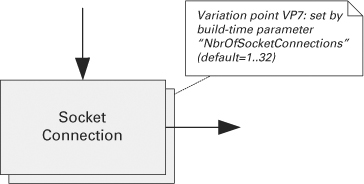
• Component replication. In an informal graphical notation, component replication is almost always documented showing shadow boxes: Almost always lacking are an indication of the possible range of replication and when the actual number is bound. Figure 6.12 includes this information in the annotation; it could equally well have referred to the variability guide.
Figure 6.12 Component replication using shadow boxes
• Optional inclusion. To show optional inclusion, you can employ the notations for component replication; simply confine the range of instances to 0 or 1.
• Creation and deletion of elements. Chapter 8 describes notations that can be used to indicate how elements can be created and deleted when the system is executed. An example is a UML sequence diagram, in which a time line underneath an object indicates the existence of that object.
• Reallocating resources. Some forms of reallocation of resources, such as the migration of objects, can be described by a UML stereotyped dependency <<becomes>>. The dependency tail is on the original location of an object and the head is on the subsequent location.
• Frameworks. Extension points need to be documented. An extension point is a place in the framework where additional elements can be added or abstract elements can be replaced with concrete ones. Each extension point is documented by an interface description of what the framework provides and the extension requires.
The variability guide for a view should contain the following information for each variation point that is present in the view:
• Description of the variation point. What decision has been left open by this variation point? The description should be architectural (for example, a particular component can be swapped in and out) but also meaningful to the stakeholders (for example, choosing different implementations results in different feature behavior).
• Available options and their effects. What is the range of choices available to exercise this variation point? What is the stakeholder-visible effect of each? What are the architectural effects of each option?
• Condition of applicability. Each variation point has a condition associated with it that describes a state that must be true for a variation point to apply. For example, to create an entertainment system for a car, the decision of which type of DVD player to use depends on the decision that the system actually has a DVD player.
• The binding time of an option. Possible binding times include design time, compile time, link time, or runtime. If runtime, more choices are possible: system start-up or restart time, when the component containing the variation point starts, or at other distinguished times during execution.
• How the option is exercised. This describes what someone has to do in order to choose an option of the variation point: set a build-time parameter, for instance, or replace one implementation of a module with another. This section is the step-by-step “how-to” guide for making the choice presented by the variation point.
• Dependencies among variation point options. Sometimes when an option is chosen for one variation point, it constrains other choices. For example, suppose your supply-chain management system stores images of the items that are in your inventory, and image format (such as JPEG or PNG) is a variation point. Suppose customers can access your inventory on a handheld device such as a pocket PC or cell phone. The list of devices that your system supports constrains the image formats that can be used and vice versa.
A variability guide can be conveniently presented as a table. Figure 6.13 shows an example.
Figure 6.13 Excerpt from a variability guide showing variation points of a Web application. This variability guide is part of a module uses view (not shown), where the description of the affected elements is found.

6.5 Documenting Architectural Decisions
With Jeff Tyree and Art Akerman
6.5.1 Why Document Architectural Decisions?
The process of developing a complex software architecture involves making hundreds of big and small decisions. The results of these decisions are reflected in the views that document the architecture—the structures with their elements and relations and properties, and the interfaces and behavior of those elements—but most of the time the decisions themselves are sadly neglected. And in that case, the rationale, especially the rationale behind the most important decisions, is irrevocably lost.
![]()
Rationale is an explanation of the reasoning that lies behind an architectural decision.
Most decisions are made in a complex environment and almost always involve trade-offs, and the environment and the trade-offs are likely to be completely invisible to someone who “inherits” the architecture. Generally, there were circumstances, constrained by cost and schedule, under which these decisions made sense. However, looking back, after all the dust has settled and the original system designers are long gone, we have no context around the critical decisions; we have no history; we have no guidance from the architect to take us forward. All we can do is just shake our heads (sometimes in disbelief) and ask “What was he thinking?” Rationale tells us exactly that: What he (or she) was thinking.
![]()
The life of a software architect is a long (and sometimes painful) succession of suboptimal decisions made partly in the dark.
—Philippe Kruchten
In the Views and Beyond approach, documenting architectural decisions enjoys first-class status. When we introduce the templates for software architecture documentation in Chapter 10, you will see that they contain dedicated places to record architectural decisions.
Documenting architectural decisions as you go results in an architecture that is demonstrably aligned with the business and technical goals of the system. This is a theme we have tried to emphasize throughout the book. Documentation isn’t something you do after the architecture is finished. Documenting the architecture helps you design the architecture. Documenting the decisions as you make them helps you make them correctly.
6.5.2 A Template for Documenting Architectural Decisions
Following a minimalist approach, only those issues that need addressing at various points in the life cycle should be addressed and thus documented. For example, decisions with many and far-reaching implications are prime candidates to be documented.
What follows is a template for capturing essential information about a key architectural decision.
1. Issue. State the architectural design issue being addressed. This should leave no questions about the reason why this issue is to be addressed now.
![]()
Like all templates in this book, use this one as a starting point. Add or subtract rows or sections so that it best fits your organization, your stakeholders, and their needs.
2. Decision. Clearly state the solution chosen. It is the selection of one of the positions that the architect could have taken.
3. Status. State the status of the decision, such as pending, decided, or approved. (This is not the status of implementing the decision.)
4. Group. Name a containing group. Grouping allows for filtering based on the technical stakeholder interests. A simple group label, such as “integration,” “presentation,” “data,” and so on can be used to help organize the set of decisions. For example, the data architects reviewing the decisions can focus only on the decisions classified as data.
5. Assumptions. Clearly describe the underlying assumptions in the environment in which a decision is being made. These could be cost, schedule, technology, and so on. Note that constraints in the environment (such as a list of accepted technology standards, an enterprise architecture, or commonly employed patterns) may limit the set of alternatives considered.
6. Alternatives. List alternatives (that is, options or positions) considered. Explain alternatives with sufficient detail to judge their suitability; refer to external documentation to do so if necessary. Only viable positions should be described here. While you don’t need an exhaustive list, you also don’t want to hear the question “Did you think about . . . ?” during a final review, which might lead to a loss of credibility and a questioning of other architectural decisions. Listing alternatives espoused by others also helps them know that their opinions were heard. Finally, listing alternatives helps the architect make the right decision, because listing alternatives cannot be done unless those alternatives were given due consideration.
7. Argument. Outline why a position was selected. This is probably as important as the decision itself. The argument for a decision can include items such as implementation cost, total cost of ownership, time to market, and availability of required development resources.
8. Implications. Describe the decision’s implications. For example, it may
– Introduce a need to make other decisions
– Modify existing requirements
– Pose additional constraints to the environment
– Require renegotiation of scope
– Require renegotiation of the schedule with the customers
– Require additional training for the staff
Clearly understanding and stating the implications of the decisions has been a very effective tool in gaining buy-in.
![]()
Let us change our traditional attitude to the construction of programs. Instead of imagining that our main task is to instruct a computer what to do, let us concentrate rather on explaining to human beings what we want a computer to do.
—Donald Knuth
9. Related Decisions. List decisions related to this one. A traceability matrix or decision tree is useful, as is showing complex relations diagrammatically such as with object models. Useful relations among decisions include causality (which decisions caused other ones), structure (showing decisions’ parents or children, corresponding to architecture elements at higher or lower levels), or temporality (which decisions came before or after others).
10. Related Requirements. Map decisions to objectives or requirements, to show accountability. Each architecture decision is assessed as to its contribution to each major objective. We can then assess how well the objective is met across all decisions, as part of an overall architecture evaluation.
11. Affected Artifacts. List the architecture elements and/or relations affected by this decision. You might also list the effects on other design or scope decisions, pointing to the documents where those decisions are described. You might also include external artifacts upstream and downstream of the architecture, as well as management artifacts such as budgets and schedules.
12. Notes. Capture notes and issues that are discussed during the decision process.
6.5.3 Documenting Alternatives
Often, early and major architectural decisions involve selecting from among a set of available alternatives. A table shows and quickly contrasts the pros and cons of each alternative. Table 6.1 shows an example of a table comparing three strategic options available to a financial organization trying to meet the listed business objectives.
Table 6.1 Analysis of alternatives for implementation of interactive approval processing

![]()
Alternatives are often conveniently documented using a table listing relevant objectives or decision criteria and showing how well each alternative addresses them.
6.5.4 Which Decisions to Document
Which of the hundreds or thousands of design decisions comprising an architecture should be documented? Certainly not all of them. It’s simply too time-consuming, and many decisions do not warrant the effort. So how do you select which decisions are important enough to warrant documentation?
![]()
It is hard to claim that you know what you are doing unless you can present your act as a deliberate choice out of a possible set of things you could have done as well.
—E. W. Dijkstra (1972, pp. 39–41)
The goal is to receive a positive “return on investment” for the effort you expend recording the decision. That is, you should document an architectural decision if, in your judgment, you think it’s cheaper to capture it now than not capturing it will be later.
Here are some guidelines to help you identify the architectural decisions worth capturing. Document an architectural decision if:
• It has an important effect on the system. For instance, it strongly affects the system’s business goals, or one or more system quality attributes (performance, availability, modifiability, security, and the like). Or the decision has some other widespread effect that will be difficult to undo. Or the decision implies spending (or saving) a significant amount of time (such as buying an expensive product).
• The design team spent significant time and effort evaluating options before making a decision. For example, the decision comes after performing technical experiments or implementing prototypes or trade-off studies. Or you performed a focused group analysis or conducted a survey with a user base or established some sort of user forum.
• The decision is complex or confusing. For instance, the decision seems not to make sense at first but becomes clear when more background is considered. Or on several occasions, you’ve been asked, “Why did you do that?” Or the issue is confusing to new team members.
• Decisions that were unusual or unexpected should be documented because these are very likely to be broken by mistake by people who would not have considered such a resolution.
Often an architecture decision creates more issues. We document these issues as implications, which automatically become concerns for the new architecture decisions.
6.5.5 The Payback for Documenting Architectural Decisions
Documenting architectural decisions can be seen as informing the cost/benefit formula for architecture documentation given in the prologue. That formula lets you decide whether the payback for producing sound architecture documentation outweighs the effort it takes to produce it. Documenting architectural decisions, like architecture documentation at large, helps stakeholders do their jobs more effectively and efficiently, avoid wasting time on known technical dead ends, and maintain and evolve the architecture in a manner consistent with its underlying design concepts and constraints. That savings is the payback for the effort it takes for an architect to say, “This is what I was thinking.”
![]()
Section P.2.4 in the prologue shows a formula describing the payoff point for architecture documentation.
Documenting the architecture will also help ensure that the architecture is properly aligned with the prevailing business and technical goals, by compelling the architect to document that alignment as the architecture is being crafted. Here the savings shows up as prevention of rework, which might be necessary if the architecture were discovered to be the wrong one for the job, because the architect didn’t understand what “the job” actually was.
Although maintainers and future architects are primary consumers of architecture rationale, they are not the only stakeholders. Developers can gain important insights from reading the architect’s reasoning. Testers can design tests to validate the architect’s precepts and assumptions. Customers can examine the documented architecture decisions to convince themselves that their business goals are being met by the design. These stakeholders, and others, can read the rationale to make sure their interests have been addressed.
Here are some of the paybacks you can expect:
• Socializing decisions. Once a final architectural decision has been reached, the team will need to socialize the result and convince the rest of the organization that it has chosen appropriately. The architecture decision template provides a common language for discussing decisions. Reviewers can easily see the status of the decision, the reasoning behind it, and the impacts. In practice, this is more powerful than reviewing, say, box-and-line diagrams. In practice, controversial decisions should be socialized early and often.
• External memory for the architect. The stakeholder with perhaps the most vested interest in capturing the motivation and background for design decisions is the architect. In the maelstrom of developmental activities, the architect needs some way to remember the conceptual path he or she has taken, as well as a way not to repeat dead-end design paths.
• Conveying risk. Without properly documenting the major decisions, understanding the implications of the architecture is difficult. If recorded using a structure such as the one given in Section 6.5.2, decisions describe more than just a solution. They also communicate the essential risks and issues. The team has information on where it should focus attention.
• Heading off redundant discussion. Without documented rationale, stakeholders may ask the same questions about a decision that have long been answered. People may still challenge some decisions, but they will do so from a more informed footing.
• Supporting timely development. Each decision can be communicated separately, with a caveat that it is subject to change due to the impacts of downstream work. As long as these relations and risks are understood, a team can start using the decisions. This provides the opportunity to let development proceed in the face of not-fully-worked-out decisions.
• Support for communication. By turning the rationale into a viewgraph presentation, management or business stakeholders can understand the major architectural decisions along with their implications.
Perspectives: From Documenting Architectures to Architecting As Decision Making
With Rik Farenhorst
What is being proposed in this section reflects a decision-based school of thought for how we go about laying down an architecture. Until now, the norm has been to create an architecture and then document it, usually as a set of views. Rationale, if captured at all, was an after-the-fact exercise in trying to describe the reasoning behind a fait accompli.
But architecture can be seen as the outcome of a sequence of decisions, each one rationally made in response to context and need. “Here is a major decision we must make now,” they say. “Let’s write about it as we make it.” And they capture both, at the same time, with tooling.
Many architecture tools let you extend the underlying metamodel that the tools provide out of the box. Akerman and Tyree (2005) have a metamodel for describing architectural decisions that can be loaded into such tools. As shown in Figure 6.14, the metamodel defines a direct association between requirements or stakeholder concerns, the architecture decisions that satisfy them, and the architecture assets (systems, components, modules, interfaces, and so on) that those decisions make manifest. “Architecture asset” is typically part of an architecture tool’s default metamodel, and so provides the anchor point between architecture decisions and architecture.
Figure 6.14 Akerman and Tyree’s metamodel relates architecture decisions to architecture assets. (Adapted from A. Akermann and J. Tyree, “Position on Ontology-based Architecture,” Proceedings of the Fifth Working IEEE/IFIP Conference on Software Architecture [November 2005]. ©2005 IEEE)
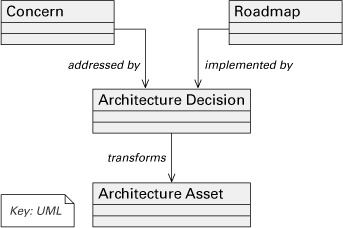
Their metamodel goes on to elaborate each node. The node “decision” is elaborated to define the information fields laid out in Section 6.5.2. A “concern” can be a required capability, a change case, a quality attribute, a risk, or a business need.
Now it becomes straightforward to include both decisions and views in a single model for the architecture. The chosen solution is captured right along with the rationale that produced it. Rationale behind a decision is no longer second-class; the why and the what are two sides of the same coin.
This approach is in accord with a growing community of researchers in a field called “architectural knowledge.” They focus on managing architectural design decisions, their rationale, and related knowledge concepts (Araujo and Weiss 2002). The approach described here is an example of this shift put into everyday practice.
—R.F.
Perspectives: An Ontology of Architecture Decisions
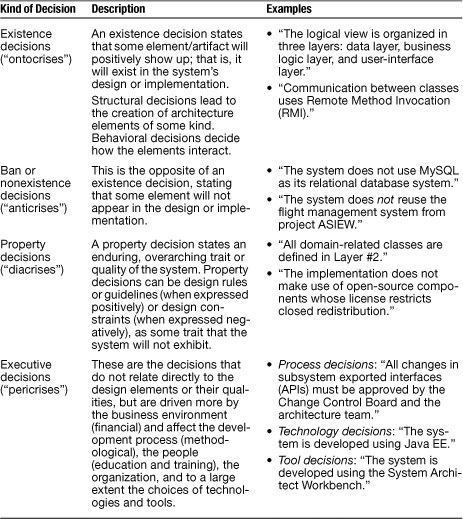
Philippe Kruchten, well known for his work in creating and describing the Rational Unified Process, is one of the most experienced and thoughtful software architects in the world. Some extremely talented architects never share what they know. Others share all the time, but without having the experience to back it up. When I think of that rare group of architects who speak and write usefully and with insight from years of front-line experience, Philippe is at the top of the list. A current interest of his is the capturing and sharing of architecture knowledge, and toward this end he has created a classification scheme for architectural decisions (Kruchten 2004; Kruchten, Lago, and van Vliet 2006), summarized in Table 6.2.
Table 6.2 Kruchten’s classification scheme for architectural decisions
Philippe also proposes an outline for describing an architectural decision. Here are some descriptive items not contained in the outline we presented in Section 6.5.2. Add them to your template if you find them useful.
• Scope. Some decisions may have limited scope, in time, in the organization, or in the design and implementation (see the overrides relationship, later in this sidebar). By default (if scope is not documented) the decision is universal. Scope might delimit the part of the system, a life-cycle time frame, or a part of the organization to which the decision applies.
• Author, Time Stamp, History. The person who made the decision, and when the decision was taken. Ideally we collect the history of changes to a design decision. Important are the changes of state, or course, but also changes in formulation or in scope, especially when we run incremental architecture reviews.
• Categories. A design decision may belong to one or more categories. The list of categories is open ended; categories are useful for queries, and for creating and exploring sets of design decisions that are associated to a specific concern or quality attribute.
• Cost. Some design decisions have a cost associated with them, which is useful to reason about alternatives.
• Risk. Documented traditionally by exposure—a combination of impact and likelihood factors—this is the risk associated with taking that decision. It is often related to the uncertainty in the problem domain or to the novelty of the solution domain, or to unknowns in the process and organization. If the project is using a risk management tool, this should simply link to the appropriate risk in that tool.
As shown in Figure 6.15, Philippe has a richly defined notion of a decision’s state:
• Idea. Just an idea, captured so as not to be lost, when doing brainstorming, looking at other systems, and so on. It cannot constrain other decisions other than ideas.
• Tentative. Allows running “what-if” scenarios, when playing with ideas.
• Decided. Current position of the architect or architecture team; must be consistent with other, related decisions.
• Approved. By a review, or a board (not significantly different than decided in low-ceremony organizations).
• Challenged. Previously approved or decided decision that is now in jeopardy; it may go back to approved without ceremony, but it can also be demoted to tentative or rejected.
Figure 6.15 Kruchten’s state machine for an architectural design decision (Kruchten 2009)
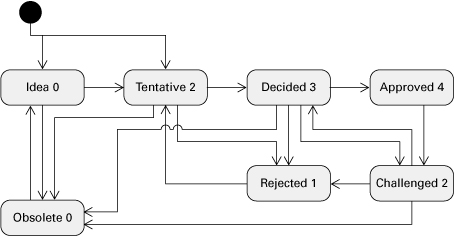
• Rejected. Decision that does not hold in the current system; but we keep such decisions around as part of the system rationale (see subsumes in the next list).
• Obsolesced. Similar to rejected, but the decision was not explicitly rejected (in favor of another one, for example) but simply became “moot”—for example, as a result of some higher level restructuring.
Finally, Philippe has worked out the ways in which decisions can be related to each other:
• Constrains. The decision “Must use Java EE” constrains the decision “Use JBoss.”
• Forbids. Synonymous with excludes.
• Enables. The decision “Use Java” enables the decision “Use Java EE.”
• Subsumes. “All subsystems are coded in Java” subsumes “Subsystem XYZ is coded in Java.”
• Conflicts With. “Must use .NET” conflicts with “Must use Java EE.”
• Overrides. “The Comm subsystem will be coded in C++” overrides “The whole system is developed in Java.”
• Comprises. Synonymous with is made of and decomposes into. “Design will use UNAS as middleware” decomposes into “Rule: cannot use Ada tasking” and “Message passing must use UNAS messaging services” and “Error logging must use UNAS error logging services,” and so on.
• Is Bound To. Decision A constrains decision B, and decision B constrains decision A.
• Is an Alternative To. Decisions A and B address the same issue but propose different choices.
• Is Related To. There is a relation of some sort between the two design decisions, but it is not of any kind listed previously and is kept mostly for purposes of documentation and illustration.
So, when you’re filling in your template for an architectural decision and you come to the table row holding the decision’s scope, or its current state, or its related decisions, you may want to refer to Philippe’s categories in these areas.
—P.C.
6.6 Combining Views
The basic principle of documenting an architecture as a set of separate views brings a divide-and-conquer advantage to the task of documentation, but if the views were irrevocably different, with no association with one another, nobody would be able to understand the system as a whole.
Because all views in an architecture are part of that same architecture and exist to achieve a common purpose, many of them do have strong associations with each other. Managing how views are associated is an important part of the architect’s job, and documenting that association is an important part of the documentation that applies beyond views.
6.6.1 Types of Associations Between Views
Views are associated with each other in a variety of ways.
In a many-to-one association (see Figure 6.16), multiple elements in one view are associated with a single element in another view. Implementation units are frequently associated with the runtime components they become. The association should make clear which module maps to which component.
Figure 6.16 Many-to-one association. Multiple elements from one view are associated with a single element of another view. As shown here, two modules from a decomposition view are designed to run in a single process, shown in the communicating-processes view.

In a one-to-many association (see Figure 6.17), a single element is associated from one view to multiple elements in another view. For example, a shopping cart module maps to multiple components in a tiered view of a Web store application.
Figure 6.17 One-to-many mapping. An element of one view can be associated with multiple elements in another view.

Finally, a many-to-many association associates a set of elements in one view to a set of elements in another. This kind of association reflects the inherent complexity in relating two views to each other, each of which was crafted to show its own important aspects that in many ways might be orthogonal to those in the other view.
6.6.2 Combined Views
Sometimes the most convenient way to show a strong association between two views is to collapse them into a single combined view. A combined view nominally reduces the number of views in an architecture document because it replaces the views that it combines.
![]()
A combined view is a view that contains elements and relations that come from two or more other views.
Figure 6.16 showed how multiple modules might map to a single process. Figure 6.18 shows how that mapping might be documented using a combined view.
Figure 6.18 Multiple elements from one view can be mapped to a single element of another view. Here Elements 1 and 2 from a module view are designed to run in a single process—Element 3—shown in the communicating-processes view. The resulting combined view shows all three elements of the module and communicating-processes views, and their association as containment.

In Figure 6.17 we showed how an element of one view mapped to more than one element of a second view. In Figure 6.19, we show how to represent this as a hybrid view. If Elements 2, 3, and 4, for example, are components of a C&C view and Element 1 is the functionality to store and to retrieve data within a component, designed as a class in a decomposition view, mapping Element 1 onto Elements 2 and 3 makes those elements “persistent components.” Combined views can be very useful as long as you do not try to overload them with too many mappings.
Figure 6.19 In this example, mapping Element 1 of View A onto Elements 2 and 3 of View B resulted in a new type of element, depicted as a new shape. This required the definition of a new element type in a style.

![]()
An overlay is a view that combines the primary presentations of two or more views followed by supporting documentation for that combined primary presentation.
There are two ways to produce a combined view.
• Create an overlay that combines the information in what would otherwise have been in two separate views. This works well if the coupling between the two views is tight; that is, there are strong associations between elements in one view and elements in the other view. If that is the case, the structure described by the combined view will be easier to understand than the two views seen separately. For an example, see the overlay of decomposition and uses diagrams shown in Figure 6.20. In an overlay, the elements and the relations keep the types as defined in their constituent styles.
Figure 6.20 Decomposition-uses-generalization combined view for ArchE

• Create a hybrid style by combining two existing styles and creating a style guide that indicates what styles were combined and describes any new or hybrid element and relation types, their properties, and constraints. Do this if the style is important and will be used in a variety of analyses and communication contexts in the system at hand or in other systems you expect to build. A view showing the hybrid style applied to a system is a combined view.
![]()
A hybrid style is the combination of two or more existing styles. Hybrid styles are documented using a style guide, as shown in “Style Guides: A Standard Organization for Explaining a Style,” in Section I.1, in the introduction to Part I. Hybrid styles are like other styles in that, when applied to a particular system, they produce views.
In a hybrid style, element and relation types of the constituent styles can “meld” into new types with new properties. Therefore, hybrid styles require the definition of the resulting new element and relation types. For example, if a hybrid style combines layered style and a communicating-processes style, a new element type could be layered process, and this type would need to be defined in the hybrid style’s style guide.
Similarly, the relation types of a hybrid style are derived from the relation types of the constituent styles and their associations. Not all relation types of the constituent styles need to be preserved.
![]()
If you create a hybrid style, document it using a style guide, following a template like the one that appears in Section I.1, in the introduction to Part I.
A hybrid style is useful to create if the style is used over and over again in the same system or in the kinds of systems developed in your organization, and if many stakeholders need to be familiar with it.
Sometimes, however, a combined view is created for a single, short-term purpose: for analysis or communication, for example. For these short-term purposes, creating the required documentation for a new style is burdensome overhead, and an overlay will serve nicely.
![]()
If two views can be associated with one another, you should show that association, whether using a hybrid style, an overlay, or a separate piece of the documentation showing the association.
So now an architect has three ways to establish the association between otherwise stand-alone views:
• Document a mapping between separate views. Do this as part of the documentation that applies beyond views.
• Create a hybrid style and then produce views of your architecture using that style.
• Create an overlay from two otherwise separate views.
In fact, there’s a fourth way that sometimes works well. Augment the property list of one view with a property that lets you specify the important information from the second view. For example, in a decomposition view, you can add “Organizational unit” and “Development folder” as properties to document for each module. When you fill in those property values, you effectively have a combined module decomposition, work assignment, and implementation view. Or in a communicating-processes view, you can add a property named “Processor” and another named “Installation file.” The result is a combined communicating-processes/deployment/install view.
Finally, you can think of allocation views such as those in Chapter 5 as a kind of combined view. One of the views they combine is not a view from software architecture, but rather a view from outside—runtime hardware, development environment, or organization.
6.6.3 When to Combine Views
The set of views used for a system is the result of a trade-off between the clarity of many views, each of which has a small number of concepts, and the reduced cost associated with having a small number of views, each dealing with multiple concepts.
![]()
If the association is clear and straightforward, and the combined view won’t be overly complex, and a consumer group for the combined view has been identified, and that group is the same group consuming the constituent views, then it makes sense to adopt the combined view in place of the separate constituents.
When considering a combined view, make sure that the association among the constituents is clear and straightforward. Otherwise, these views are probably not good candidates to be combined, as the result will be a complex and confusing view. In this case, it would be better to manage the association separately, as in a table that relates the views while keeping them separate. A table has the space to make the complex associations among the constituents clear and complete.
Even if the associations are strong, too many different concepts clutter up combined views. Keys and the plethora of relations shown in the primary presentation all become difficult to understand. Before committing to a combined view, sketch it to see whether it passes the “elevator speech” test: Could you explain the idea behind it to someone in the time it takes to ride an elevator up a dozen or so floors?
Different groups of workers need different types of information. Make your choice of views responsive to the needs of your stakeholders. Before committing to a combined view, make sure that there is a stakeholder “market” for it.
Tool support influences the choice and number of views. The cost of maintaining multiple views is partially a function of the sophistication of the available tools. If your tools understand how a change in one view should be reflected in another view, it is not necessary to manage this change manually. The more sophisticated the tools, the more views can be supported.
These views often combine naturally:
• Various C&C views. Because C&C views all show runtime relations of various types among components and connectors of various types, they tend to combine well. Different (separate) C&C views tend to show different parts of the system, or tend to show decomposition refinements of components in other views. The result is often a set of views that can be combined easily.
• Deployment view with either service-oriented or communicating-processes views. A service-oriented view shows services, and a communicating-processes view shows processes. In both cases, these are components that are deployed onto processors. Thus there is a strong association between the elements in these views.
• Deployment view and install view. The combined view shows the installation files and what hardware elements they are deployed to.
• Decomposition view and any of work assignment, implementation, uses, or layered views. The decomposed modules form the units of work, development, and uses; and they populate layers.
• Generalization and aspects. Both views deal with classes and objects and the relations among them—hence, these are two views with a strong association.
6.6.4 Examples of Combined Views
Decomposition, Uses, and Generalization
Figure 6.20 is the primary presentation for one view of the software architecture for the SEI’s Architecture Expert (ArchE) tool. This tool allows an architect to create the architecture design for a system based on three types of input: quality attribute requirements, features of the system being designed, and preexisting pieces of design. Internally, ArchE constructs a representation of the responsibilities of the system and the dependencies among them. ArchE is powered by reasoning framework plug-ins that can create quality attribute models and use them to analyze performance, modifiability, and other properties. Based on the inputs—the results of quality attribute analyses and responses provided by the architect to questions that ArchE raises interactively—ArchE creates an architecture design.
Figure 6.20 is the primary presentation of a combined view showing ArchE’s module decomposition, uses, and generalization. ArchE is an Eclipse-based tool that uses the Jess rule engine. The <<plugin>> stereotype indicates that contained modules are packaged as Eclipse plug-ins.
Tiered Client-Server and Deployment
In Chapter 4, client-server was discussed as a C&C style. There are many alternatives for allocating the components in each tier to the supporting hardware infrastructure. The network topology and the deployment structure of the software affect several quality attributes, such as availability and throughput (enhanced by replication and clustering of machines), and performance (components on different machines require remote calls to interact).
![]()
The use of tiers is explained in Section 4.6.2. The deployment style is discussed in Section 5.2.
Figures 6.21 and 6.22 show a multi-tier client-server view and a deployment view, respectively, of a banking application. Figure 6.23 shows the combined view.
Figure 6.21 The multi-tier client-server view of the Duke’s Bank application
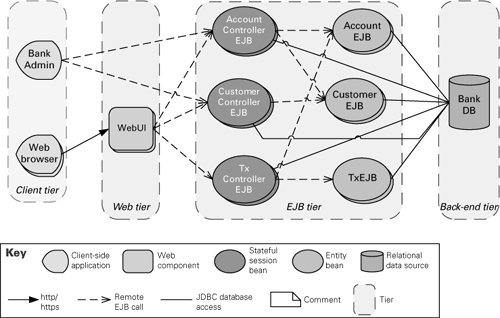
Figure 6.22 A deployment view of the banking system

Figure 6.23 A combined multi-tier client-server deployment view

6.7 Summary Checklist
• Refinement, the gradual disclosure of more-detailed information, is a chunking mechanism. Decomposition refinement reveals internal substructure. Implementation refinement replaces elements with different elements showing different element relation types that are closer to the actual realization.
• Documentation may or may not show all elements and relations; when some elements and relations are suppressed, the view documentation should make it clear to the reader that not everything is shown.
• A context diagram shows what’s in and what’s out of the system under consideration and the external entities with which the system interacts.
• An architecture document does not have a single top-level context diagram, but rather one in each view. Each such diagram shows the interactions with the environment in the vocabulary for that view. All show what’s in and what’s out.
• Document variation points by describing what elements and relations have been designed with variation mechanisms, and how to exercise those mechanisms. Document the variation points where they occur, but explain them in a variability guide.
• Showing how views are associated with each other often yields useful insights about the architecture. One alternative to do that is to list, possibly in a table, how elements in one view are associated with elements in the other view. Another alternative is combine different views into one by creating an overlay. Yet another alternative is to produce a view from a hybrid style, which is a combination of two or more styles.
• Views with a high correspondence are good candidates for mapping, and views that complement each other are good candidates for combining.
6.8 Discussion Questions
1. A user invokes a Web browser to download a file. Before doing so, the browser retrieves a plug-in to handle that type of file. Is this an example of a dynamic architecture? How would you document it?
2. Suppose that communication across layers in a layered system is carried out by signaling events. Is event signaling a concern that is part of the layered style? If not, how would you document this system?
3. Consider a shared-data system with a central database accessed by several components in a client-server fashion. What are your options for documenting the two-style nature of this system? Which option(s) would you choose, and why?
4. A bridging element is one that can appear in two separate views. Both views will have room for documenting the element’s interface and its behavior. Assuming that we do not wish to document information in two places, how would you decide where to record that information? Suppose that the bridging element is a connector with one role for one style and one role for another. Where would you record the information then?
5. Sketch a top-level context diagram for a hypothetical system as it might appear in the following views, assuming in each case that the view is appropriate for that system: (a) uses, (b) layered, (c) service-oriented, (d) client-server, and (e) deployment.
6.9 For Further Reading
Michael Jackson’s book on problem frames has a good chapter on combining multiple problem frames (Jackson 2001). Although it is cast in terms of the problem space, rather than the solution space of architectures, many of the ideas carry over.
A robust community of researchers is interested in the capture and use of architectural knowledge, a generalization of architectural decisions. The Sharing and Reusing Architectural Knowledge (SHARK) series of workshops is a good place to learn more; an online search will turn up current offerings and past results (de Boer and Farenhorst 2008). An important research project in capturing architectural knowledge is the GRIFFIN project (griffin.cs.vu.nl) at VU University in Amsterdam.
The entries in the template for documenting architectural decisions in Section 6.5 are based on IBM’s e-Business Reference Architecture Framework (Flurry and Vicknair 2001), where architecture decisions are a key deliverable, and from the REMAP and DRL metamodels (Akerman and Tyree 2005). The template also leverages Kruchten’s work on an ontology of software architecture design decisions (Kruchten 2009). Another ontology is given by Komiya (1994). Both are well worth a look.