
8. Documenting Behavior
With George Fairbanks
Documenting behavioral aspects of an architecture provides many benefits both during development of the architecture and during system maintenance. This information can be used to gain understanding of a system, and it can also help stakeholders reason about how a system built to the architecture will be able to meet many of its quality-related goals. For example, behavior documentation can identify potential deadlocks and bottlenecks. Such documentation clarifies to developers the steps and states involved in the operations.
Documenting an architecture requires behavior documentation that complements structural views by describing how architecture elements interact via their structures. Examples of structural diagrams include module, component-and-connector (C&C), and deployment diagrams. Structural relations provide a system view that reflects all potential interactions, few of which will be active at any given instant during system execution. Many notations are available to capture system behavior.
In this chapter, we recommend what aspects of behavior to document, we explain why that behavior documentation can be useful, and we show examples of how this documentation is used during the earliest phases of system development. In addition, we provide overviews and pointers to notations, methods, and tools that are available to help practitioners document system behavior.
8.1 Beyond Structure
![]()
Architecture is frozen music.
—Johann Wolfgang von Goethe
Reasoning about characteristics such as a system’s potential to deadlock, its ability to complete a task in the desired amount of time, or its maximum memory consumption requires that the architecture description contain information about both the characteristics of individual elements as well as patterns of interaction among them. Behavior documentation adds information that reveals things like the following:
• The ordering of interactions among the elements
• Opportunities for concurrency
• Time dependencies of interactions, such as at a specific time (for example, “At 8 a.m.”) or after a period of time (for example, “Every 30 ms.”).
• Possible states of the system or parts of the system
• Usage patterns for different system resources (such as memory, CPU, database connections, or network)
Sequence diagrams and statecharts found in UML are examples of notations that support capturing behavioral information.
8.2 How to Document Behavior
Documented behavior supports exploring the range of possible orderings of interactions, opportunities for concurrency, and time-based interaction dependencies among system elements. In this section, we recommend steps you can take to reap these benefits.
There are three things you need to do to capture system behavior: (1) decide what kinds of questions the documentation should answer; (2) determine what behavioral information is available or can be stated as constraints on downstream developers; and (3) choose a notation.
8.2.1 Step 1: Decide What Kinds of Questions You Need to Answer
Determining what kinds of behavior to model depends on the type of system being designed, the stage of development, and the focus of the design effort.
For example, consider a banking system. In such a system, you focus on the order of events: credit, deposit, operation fee, and logging in a money transfer operation. The behavior must ensure that the transaction is atomic and that rollback procedures are in place. On the other hand, in a real-time embedded system, you need to say a lot about timing properties in addition to the order of events.
Early in the development you will want to talk about the elements and how they interact, not about the details of how input data is transformed into outputs. It may also be useful to say something about constraints on the transformational behavior within elements, because that behavior affects the global behavior of the system. Later in the development, the details should also be considered.
At a minimum you should model the stimulation of actions and the transfer of information from one element to another. In addition, you might want to model ordering constraints on these interactions. Restrictions on the order and combinations in which actions must occur should be documented if correct behavior depends on it. Documentation that has more explicit information about the constraints on interactions is more prescriptive for developers and more precise for analysis, and hence more likely to result in an implementation that will exhibit the intended behavior.
As an example of the importance of focus, consider an exploratory robot (or rover). If you’re creating a sequence diagram to describe an interaction within the communication subsystem, you may abstract (that is, omit) interactions with the power management subsystem, because the diagram only needs to clarify the interactions concerning the communication submodules. Defining the scope is particularly critical for state-based diagrams. The first thing to ask is “This diagram shows the states of what?” For example, in an ATM system, a statechart can describe the states of the user screen, the money dispenser, the communication channels, a bank account, a bank card, the card reader, and so on. Each of these elements has distinct states and transitions, and they may be related (for example, if the card reader retains a card the user forgot to pick up, an event may be triggered to deactivate the card). If the scope of the state-based diagram is not well defined, you may end up trying to model combined elements that together have too many states.
8.2.2 Step 2: Determine What Types of Information Are Available or Can Be Constrained
Types of Communication
Looking at a structural diagram that depicts two interrelated elements, users of the documentation often ask “What does the line connecting the elements mean? Is it showing flow of data or control?” The answer should be in the diagram key. A behavioral diagram provides a place to describe aspects of the transfer of information and the stimulation of actions from one element to another in more detail than you include in diagram keys.
![]()
See “Perspectives: Quivering at Arrows” on page 41, in the prologue.
Table 8.1 shows some common examples of various types of communication. In this table we identify three different important characteristics of a type of communication. The first characteristic is the general purpose of the communication. In some cases, the primary purpose is to exchange data. In others, the primary purpose is to stimulate another element to signal that a task is completed or that a service is required. Often, however, a combination of the two is the main idea, as is the case when an element stimulates another to deliver data or when information is passed in messages or as parameters of events.
Table 8.1 Types of communication
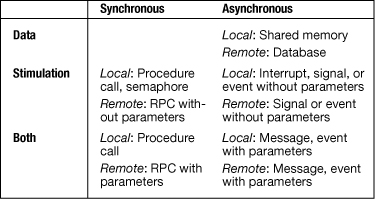
A second characteristic indicates whether elements communicate via synchronous or asynchronous means. Remote procedure call (RPC) is an example of synchronous communication. The sender calls the receiver and is blocked until the receiver responds. Messaging is an example of asynchronous communication. The sender does not concern itself with the state of the receiver when sending a message or posting an event. Right after the message is sent, the sender continues its execution and is not blocked waiting for a response. In fact, the sender and receiver may not be aware of each other’s identity.
Consider the telephone and e-mail as examples. If you make a phone call to someone, the person has to be at the phone in order for it to achieve its full purpose. That is synchronous communication. If you send an e-mail message and go on to other business, perhaps without concern for a response, the communication is asynchronous. The distinction between synchronous and asynchronous communication has implications for the behavior of the transaction. An asynchronous call introduces concurrency and is more suitable for loosely coupled elements. The distinction also affects modifiability. Asynchronous interactions are usually more complicated, especially when the transaction needs a callback, which may require establishing a callback end point and a mechanism for correlating the original call to the callback message.
A third characteristic of the type of communication is whether the call is local (within the same container or machine) or remote. If it’s remote, the performance is worse, because of the network overhead (even if the remote call reaches a component within the same machine, there’s the overhead of going through the stack of network layers). Remote calls are also less reliable. A call or its response may not be delivered, may get corrupted, or may arrive in the wrong order.
Constraints on Ordering
In the case of synchronous communication, you probably want to say more than that there is two-way communication from A to B. For instance, you may want to say whether the target of the original message uses the assistance of other elements before it can respond to the original request.
You may want to be more specific about certain aspects of the way an element reacts to its inputs. You may want to note whether an element requires all or just some of its inputs to be present before it begins calculating. Also, you may want to say whether it can provide intermediate outputs or only final outputs. If a specific collection of events must take place before an action of an element is enabled, that should be specified, as should the circumstances (such as ordering) in which the events or element interactions will be triggered. These types of constraints on interactions provide information that is useful for analyzing the design for functional correctness, as well as for quality attributes.
Time-Based Stimulation
If any activities are specified to take place at specific times or after certain intervals of time, some concept of time needs to be introduced into your documentation. Time can be specified as either a point in time (that is, calendar based) or as a duration (timer based). Duration can be based on either wall time or task time. As an example of using a point in time, you may specify that certain behavior is different on weekends or holidays. As an example of using wall-time duration, you may specify that every five minutes, the system should determine how many people are logged in. As an example of task-based duration, you may specify that a task can use one minute of CPU time before being temporarily interrupted.
8.2.3 Step 3: Choose a Notation
Any language that supports documenting system behavior must include constructs for describing sequences of interactions. Because a sequence is an ordering in time, it should be possible to show time-based dependencies. Sequences of interactions and the triggered activities are displayed in the order they are supposed to occur after certain stimulus arrives. Examples of stimuli are the passage of time and the arrival of an event. Examples of activities are computing and waiting. Constructs that show time as a point—for example, 8:00 a.m.—and time as duration—such as wait for 10 seconds—are normally also provided. As documentation of behavior implicitly refers to structure and uses structure, the structural elements of a view are an essential part of the language. In most behavior documentation, therefore, you can find representations of the following:
• Stimulus and activity
• Ordering of interactions
• Structural elements with some relations the behavior maps to
Two groups of behavior documentation are available. The languages to support behavior documentation tend to fall into one of two corresponding categories: traces and comprehensive models.
• One type of documentation allows you to capture what happens through the structural elements of a system during a scenario as traces. Traces are sequences of activities or interactions that describe the system’s response to a specific stimulus. Traces are by no means a complete behavioral model of a system. However, the explicit enumeration of all traces would generate a complete behavioral model, although this isn’t remotely feasible in most systems. Traces are easier to design and communicate because they have a narrow focus.
![]()
Use trace-oriented documentation if the goal is to describe the sequence of activities in the system in a specific scenario.
• Another type of documentation, often state based, shows the complete behavior of a structural element or a set of elements. This is called a comprehensive model of behavior because it is possible to infer all paths from initial state to final state. Comprehensive behavioral models support documentation of alternatives and repetitions to provide the opportunity of following different paths through a system, depending on runtime values. With this type of documentation, it is possible to infer the behavior of the elements for the arrival of any possible stimulus.
![]()
Use the comprehensive model type of documentation when a complete behavioral understanding is required, as is the case when performing a simulation or when applying static analysis techniques.
A difference between the two approaches is the focus of the documentation relative to individual elements. Traces are typically scoped to include all the system elements that are involved in a particular scenario. However, as mentioned earlier, only a fraction of the behavior of any given element shows up in any particular trace. Each comprehensive model, on the other hand, is typically scoped to focus on all the behavior of a particular element or group of elements. In order to reason about system-wide behavior, you must look at multiple comprehensive models side by side.
Many languages and notations are available for both types of behavior documentation. These differ in their emphasis on certain aspects of the behavior, such as how ordering is identified, how much support is available for documenting timing, what types of communication are easily modeled, and so on.
8.3 Notations for Documenting Behavior
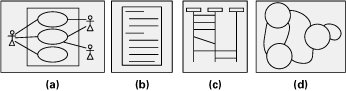
In the subsections that follow, we provide cursory overviews of several notations to show trace and comprehensive types of behavioral specifications. The discussions are intended to provide a flavor of the particular notations and to motivate their use. There are many ways in which the diagrams we present in this section may be used together to support system understanding. Figure 8.1 shows a reasonable way to combine the strengths of several notations.
Figure 8.1 Using various types of behavior documentation together. (a) Begin by documenting an overview of the functional requirements as use case diagrams. (b) Then produce use case descriptions to document the events and actions that correspond to performing each use case. (c) Next, for each use case produce either a sequence diagram or a communication diagram to define the messages between envisioned architecture elements. (d) Finally, produce statecharts to complement the behavior documentation of the elements that have elaborate states and state transitions.
8.3.1 Notations for Capturing Traces
Traces are sequences of activities or interactions that describe the system’s response to a specific stimulus when the system is in a specific state. A trace describes a sequence of activities or interactions between structural elements of the system. Although it is conceivable to describe all possible traces to generate the equivalent of a comprehensive behavioral model, it is not the intention of trace-oriented documentation to do so.
In this section, we describe four notations for documenting traces: use cases, sequence diagrams, communication diagrams, and activity diagrams. Communication diagrams were introduced in UML version 2 and are based closely on the collaboration diagram from UML version 1. Although other notations are available, we have chosen these four as a representative sample.
Use Cases
Use cases describe how actors can use a system to accomplish their goals. Use cases are frequently used to capture the functional requirements for a system.
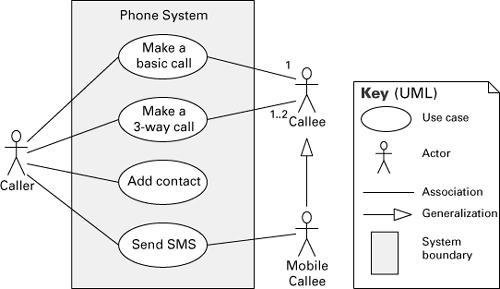
UML provides a graphical notation for use cases, as shown in Figure 8.2, but it does not say how the text of a use case should be written. The UML use case diagram can be used effectively as an overview of the actors and the behavior of a system, but most of your effort should go into producing the textual use case description.
Figure 8.2 The UML use case diagram provides a quick overview of the system, actors, and the required behavior. This example shows some use cases in a telecommunication system.
The use case description is textual, and it should contain: the use case name and brief description, actor or actors who initiate the use case (primary actors), other actors who participate in the use case (secondary actors), flow of events, alternative flows, and non-success cases. The use case description can be enhanced with preconditions, postconditions, assumptions, priority, and other information. A use case may include or extend other use cases. Figure 8.3 shows an example of a use case description for making a call in a telephone system.
Figure 8.3 Example use case description for making a basic call in a telephone system. This use case contains a main flow of events and one exceptional flow of events.
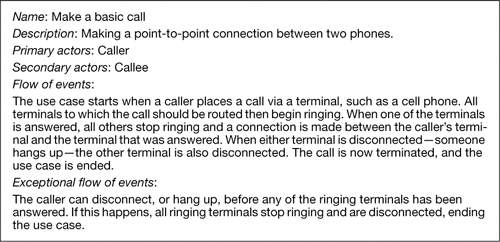
All interactions in a use case are interactions between the actors and the system; no interactions within the system are shown. Human users are actors, but other computer systems can also play the role of an actor.
Sequence Diagrams
A UML sequence diagram shows a sequence of interactions among instances of elements pulled from the structural documentation. It shows only the instances participating in the scenario being documented. A sequence diagram has two dimensions: vertical, representing time, and horizontal, representing the various instances. The interactions are arranged in time sequence from top to bottom. Figure 8.4 is an example of a sequence diagram that illustrates the basic UML notation. In practice, the notation you’ll find in sequence diagrams is often simpler: return messages may not be there, execution occurrence bars may not be drawn, a single type of arrow may be used for all types of messages, and labels on messages may not exist.
Figure 8.4 A simple example of a UML sequence diagram. Objects (that is, element instances) have a lifeline, drawn as a vertical dashed line along the time axis. The sequence is usually started by an actor on the far left. The instances interact by sending messages, which are shown as horizontal arrows. A message can be a method or function call, an event sent through a queue, or something else. The message usually maps to a resource (operation) in the interface of the receiver instance. A filled arrowhead on a solid line represents a synchronous message, whereas the open arrowhead represents an asynchronous message. The dashed arrow is a return message. The execution occurrence bars along the lifeline indicate that the instance is processing or blocked waiting for a return. Because this sequence diagram explicitly shows the creation of the UserSession object, its box is inserted at the point where the creation takes place.

![]()
If your trace involves a mix of synchronous and asynchronous messages, use the different types of arrows in the UML sequence diagram notation to differentiate them and add the return messages for the synchronous calls.
Sequence diagrams are not explicit about showing concurrency. If that is your goal, use activity diagrams instead. Although instances in a sequence diagram can be running concurrently, no assumptions can be made about ordering when a sequence diagram depicts an instance sending messages at the “same time” to different instances or, conversely, receiving multiple stimuli at the “same time.”
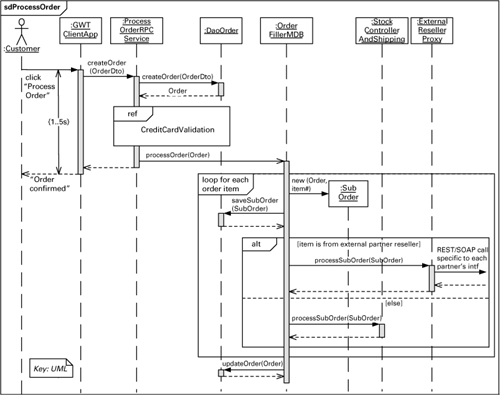
Figure 8.5 shows a more interesting sequence diagram. It demonstrates some features introduced in UML 2.0 that help in communicating a design to developers:
• Named frame. The optional frame around the diagram contains the name of the sequence diagram, which in the example is sdProcessOrder.
• Reference. An existing sequence diagram can be referenced in other diagrams by using the frame with the upper-left label “ref”. The example indicates that all interactions in the referenced sequence diagram, CreditCardValidation, take place right after ProcessOrderRPCService interacts with DaoOrder.
• Time constraint. The example specifies that the interaction of Customer and GWTClientApp should take between one and five seconds.
• Loop. The loop frame indicates that the interactions are repeated in a loop. The expression after keyword “loop” in the upper-left label defines the number of iterations. In the example, the interactions in the loop frame are repeated for each order item (it’s not shown in this diagram, but each order contains a collection of order items).
• Alternatives. The frame with upper-left label “alt” contains interactions that are executed only if the specified guard condition (in square brackets) is true. The alt frame can be segmented, and each segment can have a guard condition. In the example, the alt frame has two segments, which semantically correspond to an if-then-else construct.
Figure 8.5 Example of a UML sequence diagram for processing a purchase order on a Web store. This example exhibits some powerful features of the sequence diagram notation, such as time constraint, reference to another sequence diagram, loop, and conditional alternative messages.
Communication Diagrams
Like other trace notations, a UML communication diagram shows ordered interactions among elements needed to accomplish a purpose. Whereas a sequence diagram shows order using a time-line-like mechanism, a communication diagram shows a graph of interacting elements and annotates each interaction with a number denoting order. As in sequence diagrams, instances shown in a communication diagram are instances of elements described in the accompanying structural documentation. Communication diagrams are useful when the task is to verify that an architecture can fulfill the functional requirements. The diagrams are not useful if the understanding of concurrent actions is important, as when conducting a performance analysis.
A communication diagram also shows relations among the elements, called links (see Figure 8.6). Links show important aspects of relations among those structural instances. Links between the same instances in different communication diagrams can show different aspects of relations between the same structural elements.
Figure 8.6 A UML communication diagram for placing a three-way call on a telephone system. Interactions are shown by lines between the instances labeled with a sequence number, the name of the resource being called, and an arrowhead that indicates the communication direction. The sequence numbers show which interactions follow which. Subnumbering can be used to show nested stimuli and/or parallelism. For example, the interaction with a sequence number 2.1a is the first stimulus sent as a result of receiving stimulus number 2. The letter a at the end means that another stimulus, 2.1b, can be performed in parallel. This numbering scheme may be useful for showing sequences and parallelism, but it tends to make a diagram unreadable.

Communication diagrams and sequence diagrams essentially express the same information, though you may choose one or the other based on how they highlight time sequences and element relations. Sequence diagrams show time sequences explicitly, making it easy to see the order in which interactions occur; communication diagrams indicate ordering by using numbers. Communication diagrams can resemble the structural diagram (such as a class diagram) they derive from and also make it easy to see how elements are statically connected; sequence diagrams do not clearly show static connections (such as use dependencies) between elements.
Activity Diagrams
UML activity diagrams are similar to flow charts. They show a business process as a sequence of steps (called actions) and include notation to express conditional branching and concurrency, as well as to show sending and receiving events. Arrows between actions indicate the flow of control. Optionally, activity diagrams can indicate the architecture element or actor performing the actions. One way to do that is by drawing an activity partition (also called a swim lane) for each element and placing the actions performed by that element within the corresponding partition. Figure 8.7 is an example of an activity diagram that has six activity partitions.
Figure 8.7 Example of an activity diagram for processing an order in the Adventure Builder system (Adventure Builder 2010). The elements listed on the left are components from the top-level service-oriented view of the system.
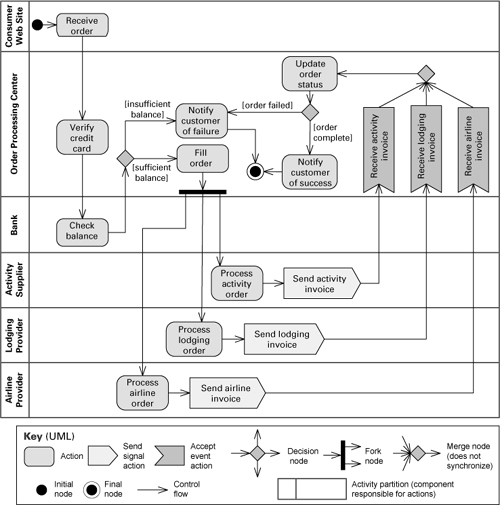
Another important feature of activity diagrams is the ability to express concurrency. A fork node (depicted as a thick bar orthogonal to the flow arrows) splits the flow into two or more concurrent flows of actions. The concurrent flows may later be synchronized into a single flow through a join node (also depicted as an orthogonal bar). The join node waits for all incoming flows to complete before proceeding. An alternative is to use a merge node, which is depicted as a diamond with multiple incoming flows. The merge node does not synchronize the incoming flows; instead, as each flow completes, control is passed to the following action.
Unlike sequence and communication diagrams, activity diagrams don’t show the actual operations being performed on specific objects. Activity diagrams are very useful to broadly describe the steps in a specific work flow. Conditional branching (shown with the diamond symbol) allows a single diagram to represent multiple traces, although it’s not usually the intent of an activity diagram to show all possible traces or the complete behavior for the system or part of it.
Other Trace-Based Notations
Use cases, sequence diagrams, communication diagrams, and activity diagrams are perhaps the most commonly seen notations for capturing traces, but there are other notations that have specialized purposes:
• A message sequence chart is a message-oriented representation containing the description of the communication between instances. Simple message sequence charts look like sequence diagrams but have a more specific definition and are a more precise notation. The main area of application for a message sequence chart is as an overview specification of the communication behavior among interacting systems, especially telecommunication switching systems. Message sequence charts are often seen in conjunction with Specification and Description Language (SDL), which is a comprehensive behavioral notation. Whereas a message sequence chart focuses on representing the message exchange between elements, such as systems and processes, SDL focuses on documenting what does or should happen in an element. In that respect, message sequence charts and SDL diagrams complement each other.
• UML timing diagrams show state changes of one or more objects along a time line. When two or more objects are shown, the timing diagram can also display the messages exchanged between them, similar to a UML sequence diagram. Timing diagrams resemble digital signal diagrams in that time progresses from left to right, but they have a rich vocabulary of annotations to express timing constraints between the events and message exchanges.
• Business Process Execution Language (BPEL) is a language that supports creation of work flows that consist of interactions among Web services. BPEL is an executable XMLbased language and hence not suitable for architecture design. However, BPEL tool environments usually provide a graphical notation (for example, Business Process Modeling Notation, or BPMN) that can be used to create behavioral diagrams that describe control and data flow through the system.
8.3.2 Notations for Capturing Comprehensive Models
Comprehensive models show the complete behavior of structural elements. Given this type of documentation, it is possible to infer all possible paths from initial state to final state. The state machine formalism is a good candidate for representing the behavior of architecture elements because each state is an abstraction of all possible histories that could lead to that state. State machine languages allow you to complement a structural description of the elements of the system with constraints on interactions and timed reactions to both internal and environmental stimuli.
In this section, we describe UML state machine diagrams. Although other languages are available, we have chosen state machine diagrams because they can describe behavior in a form that captures the essence of what you wish to convey to system stakeholders. State machines are also used in many disciplines of computer science (from compilers to data modeling) and are part of UML, so you are likely to find them in modeling and drawing tools. State machine diagrams are also available in development tools that allow you to design, simulate, and analyze your system, and sometimes generate code.
UML State Machine Diagrams
UML state machine diagram notation is based on the statechart graphical formalism developed by David Harel for modeling reactive systems; they allow you to trace the behavior of your system, given specific inputs. A UML state machine diagram shows states represented as boxes and transitions between states represented as arrows. The state machine diagrams help to model elements of the architecture that have interesting or complex states. Figure 8.8 is a simple example showing the states of a vehicle cruise control system.
Figure 8.8 UML state machine diagram for the cruise control system of a motor vehicle. The transitions correspond to the buttons the driver can press or driving actions that affect the cruise control system.
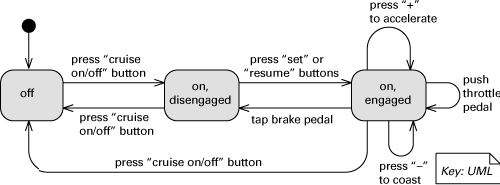
Each transition in a state machine diagram is labeled with the event causing the transition. Optionally, the transition can specify a guard condition, which is bracketed. When the event corresponding to the transition occurs, the guard condition is evaluated and the transition is enabled only if the guard is true at that time. Transitions can also have consequences, called actions or effects, indicated by a slash. When an action is noted, it indicates that the behavior following the slash will be performed when the transition occurs. The states may also specify entry and exit actions.
![]()
The boxes in a state machine diagram are states; they are not components or modules. The arrows are transitions; they are not connectors. A state machine diagram may model the states of the entire system, a component, a collection of components, or an attribute of an object. Be clear as to what you are modeling before creating a state machine diagram.
State diagrams by definition are supposed to show all states and all transitions out of a state. For example, when an ATM is in state “Enter Pin”, you should show a transition for the case when the user walks away. Otherwise, the developer may not implement a time-out.
Decide what states your state diagram represents. Choosing a scope that is too broad may result in a diagram that is too big to understand and analyze.
Don’t forget to indicate the initial state, and decide whether or not there is a final state.
UML state machine diagrams also support the nesting of states. The outer state is called the composite state; inner states are called substates. The composite state defines the scope of a new state diagram, and the substates are related by transitions, just as in a finite state machine. When the composite state is entered, the initial state within the composite state is also entered. Grouping substates into a composite state allows common behavior to be expressed concisely. Any behavior indicated at the composite state level—depicted as transitions from the composite state boundary rather than from any specific substate—applies to all substates. A good use of this technique is to indicate common error handling or termination behavior. Figure 8.9 shows an example of this; the “user canceled order” transition out of the “filling order” composite state (top right) expresses that the transition can occur in any of the substates.
Figure 8.9 A UML state machine diagram showing the states of an order in the Adventure Builder system (Adventure Builder 2010). Once the credit card is authorized, the order moves to the “filling order” composite state. The three regions represent concurrent, independent substates of filling the order.

In UML state machines, concurrency is represented by dividing a composite state into regions. Each concurrent region contains a state machine that is a grouping of substates. Regions are shown separated by dotted lines. The state machine in Figure 8.9 shows three concurrent regions. When all regions reach their final state, transition “all bookings confirmed” from the composite state is triggered. This transition causes the “e-mail customer” action to be executed. Alternatively, the system can leave the composite state if any of the requests is not satisfied or, as we mentioned before, if the user cancels the order. UML’s state machine diagram notation contains many other features not mentioned here, such as means of expressing choice, timing, and history.
Other Comprehensive Notations
Formal languages such as Z, CSP, and FSP are popular in niche domains with demanding requirements, such as safety-critical systems. They are mathematical languages based on predicate logic and set theory. These languages can be used to produce precise behavioral models and permit rigorous analyses, such as type checking, model checking, and proofs. However, they include a large set of symbols, and expressions are written in terms of predicate logic, making it difficult for some designers to warm up to.
Other notations exist that are used in various niche areas. Architecture Analysis and Design Language (AADL), which is described in Appendix C, can be used to reason about runtime behavior. Specification and Description Language (SDL) is used in telephony. Koala is an architecture description language designed with product-line architectures in mind; it provides support for variability in component selection and variety of composition binding times.
8.4 Where to Document Behavior
Architects document behavior to show how an element behaves when stimulated in a particular way or to show how an ensemble of elements react to one another. In an architecture documentation package, where behavior is shown depends on what is being shown. For example, in an architecture view:
• Behavior has its own section in the element catalog. For a complex transaction, you might describe how elements interact to process requests using a sequence diagram.
• Behavior can be part of an element’s interface documentation. The semantics of a resource on an element’s interface can include the element’s externally visible behavior that occurs as a result of using the resource. Or in the usage guide section of an interface document, behavior descriptions can be used to explain the effects of a particular usage pattern, that is, a particular sequence of resources used.
![]()
Documenting interfaces is described in Chapter 7.
• Behavior can be used to fill in the rationale section, which includes results of analysis. Behavior descriptions are often a basis for analysis, and the behaviors that were used to analyze the system for correctness or other quality attributes can be recorded here.
![]()
Documenting rationale is described in Section 6.5.
In the documentation that applies beyond views, the rationale for why the architecture satisfies its requirements can include behavior documentation as part of the architect’s justification.
8.5 Why to Document Behavior
Documentation of behavior is most commonly used for communication among stakeholders during development and maintenance activities. It can also be used for system analysis. The types of analyses you perform and the extent to which you check the quality attributes of your system are based on the type of system you are developing.
8.5.1 Driving Development Activities
Behavior documentation plays an important part in architecture’s role as a vehicle for communication among stakeholders during system development activities. It’s probably safe to say that every architect has drawn a sequence diagram (or some similarly expressive diagram) on the whiteboard during a meeting in order to make concrete their ideas about what components need to exist and the interactions among those components. These diagrams, along with associated rationale, should be captured as part of the architecture’s documentation. The process of designing the architecture helps the architect develop an understanding of the internal behavior of system elements and gross system structure, and it improves confidence that the system will be able to achieve its goals.
In the architecting process, system decomposition identifies sets of subelements and defines both the structure and the interactions among the subelements in a way that supports the required behavior of the parent element. In many cases behavior documentation is created to help reason about the interaction of the subelements and their responsibilities, to see if the decomposition is appropriate.
Trace-oriented diagrams, such as sequence diagrams, can be created based on an implementation already in place. In that case, the diagrams can help to spot bottlenecks, memory leaks, and other defects, as well as identify opportunities for performance improvements and refactorings.
![]()
If you’re spending a long time to find a bug in a specific transaction involving several modules, create a sequence diagram showing the relevant steps. The diagram helps you and others to get a hold of the overall transaction and may expose erroneous interactions. This advice is particularly useful when the bug is not easily reproducible because of concurrency issues.
8.5.2 Analysis
Behavior documentation allows you to reason about the completeness, correctness, and quality attributes of the software system. Once the structure of an architecture view has been identified and the interactions among elements have been constrained, you need to look at whether the proposed system will be capable of doing its job as planned. This is your opportunity to reason about both the completeness and the correctness of the architecture. The behavior of the system can be simulated to help reason about the architecture’s ability to support the range of functionality and related quality requirements of the system. Behavior documentation can be built as a model that serves as input to the simulation.
The amount of information in the behavioral models required to perform behavioral analysis varies greatly, depending on the level of certainty and precision required of the result. Therefore, it is generally a good idea to do some type of trade-off comparison to determine the cost/benefit involved with applying certain types of architecture analysis techniques. For any system, it is a good idea to identify and to simulate a set of requirements-based scenarios. If you are developing a safety-critical system, the application of more-expensive, formal analysis techniques, such as model checking, is justified in order to identify possible design flaws that could lead to safety-related failures.
Documenting system behavior supports exploration of the quality attributes of a system early in the development process. Some techniques and tools are available or are being developed that can be used to predict, based on the architecture, that the production of a system will exhibit specific measures related to such quality attributes as performance, reliability, and safety.
Architecture-based simulation is similar to testing an implementation in that a simulation is based on a specific use of the system under specific conditions and with expectation of a certain outcome. Typically, a developer identifies a set of scenarios based on the system requirements. These scenarios are similar to test cases in that they identify the stimulus of an activity and the assumptions about the environment in which the system is running and describe the expected result. These scenarios are played out against documented system models that support relating system elements and the constraints on their interactions. The results of “running the architecture” are checked against expected behavior.
Whereas simulation looks at a set of special cases, system-wide techniques for analyzing the architecture evaluate the overall system: analysis techniques for things like change impact, deadlock, safety, and schedulability. These techniques require information about the behavior of the system and its constituent elements in order to perform the appropriate analyses. Dependencies between and within elements can be used to identify potential execution paths, which are needed to evaluate quality attributes such as performance, and to identify chains of uses relations to help evaluate modifiability.
8.6 Summary Checklist
• Documenting behavior adds semantic detail to elements and their interactions that have time-related characteristics. Behavioral models complement structural models by adding information that reveals ordering of interactions among the elements, opportunities for concurrency, and time dependencies of interactions, such as at a specific time or after a period of time.
• Constraints on the interaction between elements should be documented. Document any ordering constraints on actions or interactions. Document a clock if your system depends on time.
• Most behavioral languages include representations of stimulus and activity, ordering of interactions, and structural elements.
• Trace-oriented models consist of sequences of activities or interactions that describe the system’s response to a specific stimulus when in a specific state. They document the trace of activities through a system described in terms of its structural elements and their interactions. Use cases, sequence diagrams, communication diagrams, and activity diagrams are trace-oriented modeling languages.
• Comprehensive models, often state based, show the complete behavior of a structural element or set of elements. UML state machine diagrams are a comprehensive behavior modeling language.
• Behavior can be documented in the element catalog of a view and in interface documentation, and it can be used to fill in the design background section, which includes results of analyses.
8.7 Discussion Questions
1. Consider a car radio with seek, scan, power on/off, and preset station buttons, along with a manual tuning knob and volume control and a digital frequency display. (a) Of the languages and notations for describing behavior presented in this chapter, which ones would be good candidates for describing the behavior of this radio? Why? (b) Using one of the languages you chose in the previous question, sketch the behavior of the car radio.
2. Suppose that you wanted to make sure that your car radio did not exhibit undesirable behavior in unusual circumstances, such as the display going blank when the driver turns the frequency knob while holding down a preset button. What languages would you likely use to help in that case, and why?
3. When would you choose to document behavior using trace models or using comprehensive models? What value do you get, and what effort is required, for each of them?
4. Draw a statechart for an automatic teller machine for each of the following stakeholders: (a) a customer wanting to deposit or withdraw money from an account; (b) a bank executive wanting to track machine usage across the bank’s territory; (c) a service technician sent to repair the machine when it becomes inoperative for any reason; (d) a security monitor whose job it is to take appropriate action when the machine’s money safe is open, the tilt alarm goes off, or the machine stops communicating with the bank. Discuss the differences among the four. If you wanted to combine them to create a single overall statechart for the machine, how would you go about it?
5. Documenting an architecture involves drawing various views that must be consistent with each other. If a behavior model shows a component sending a message to another, there must be a connector between them, but connectors are not shown on behavior diagrams. What other consistency checks between views can you think of? In answering, consider views in each category: module, C&C, and allocation.
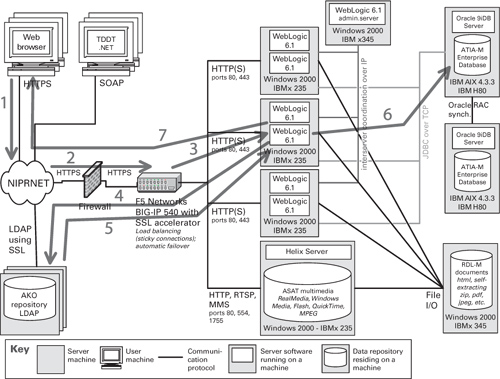
6. Is Figure 8.10 a behavioral diagram? Why or why not?
Figure 8.10 The numbered arrows drawn on top of this network diagram show the sequence of steps to process a specific user transaction in terms of communicating elements.
8.8 For Further Reading
A rich source of behavior descriptions can be found in the UML definition that is publicly available from the OMG. At uml.org, you can find the UML specifications, which contain definitions, descriptions, and examples of sequence and communication diagrams, as well as example use cases and state machine diagrams. You can also find several books that explain UML and its usage in detail. Two seminal books that you will find to be valuable references are The Unified Modeling Language User Guide, by Booch, Rumbaugh, and Jacobson (2005) and UML Distilled, by Martin Fowler (2003), which focuses on the 20 percent of UML that you will use 80 percent of the time.
A good reference for statecharts is Modeling Reactive Systems with Statecharts: The Statemate Approach, by Harel and Politi (1998).
The BPEL specification can be found at oasis-open.org/committees/wsbpel. The Object Management Group’s home page for BPMN is bpmn.org.
Message sequence charts, especially combined with SDL diagrams, are most commonly used by the telecommunication industry. The Web site of the International Telecommunication Union, at itu.int, has references to resources needed to understand and use message sequence charts and SDL. Additional information and pointers to events, tools, and papers can be found at the SDL Forum Society’s Web site, sdl-forum.org.
Many books have been written about use cases. The book from Ivar Jacobson that started the whole use case discussion is Object-Oriented Software Engineering: A Use Case Driven Approach (1992). This book can serve as a starting point to understand what was originally meant by use cases and their underlying concepts. Alistair Cockburn’s book Writing Effective Use Cases (2000) provides practical guidance on avoiding pitfalls, structuring collections of use cases, and organizing use cases into goal levels.
The Z language was originally developed at Oxford University in the late 1970s and has been extended by a number of groups since then. Tools that help create and analyze specifications have been developed by various groups and are available freely over the Internet. A great resource for information and pointers is the Web archive found at formalmethods.wikia.com/wiki/Z_archive. J. M. Spivey’s book The Z Notation: A Reference Manual (1988) is available online at spivey.oriel.ox.ac.uk/mike/zrm. It provides a good reference in terms of a standard set of features.
AADL is a standard published by the Society of Automotive Engineers (SAE). The SAE AADL team keeps an updated Web site at aadl.info. An overview of AADL and its associated tools is found in the technical note by Feiler, Gluch, and Hudak (2006), as well as in Appendix C of this book.