
A. UML—Unified Modeling Language
A.1 Introduction
The Unified Modeling Language (UML) is a standardized visual language for modeling software designs. Originally created to merge a number of similar-but-different notations for object-oriented modeling, UML has grown to become the de facto standard for representing software designs in systems of all kinds. The purpose of this appendix is to show how UML should be used to describe different kinds of information found in software architecture documentation: module views, component-and-connector (C&C) views, allocation views, behavior documentation, and interfaces.
The appendix should work as a quick refresher to the UML diagrams and symbols that you may use or may find in architecture documentation. It’s not intended to be a UML tutorial. It’s assumed that you are familiar with basic UML concepts such as classes, packages, dependencies, and messages.
![]()
For a more in-depth explanation of the different UML diagrams, consult the UML books referenced in Section 2.9.
UML retains many of the characteristics that trace back to its object-oriented origins, but object-oriented abstractions are not always the best tools for describing software architectures. For example, UML has no notation for a layer, context diagram, or rich connector. Many changes were incorporated in the 2.0 revision of UML, some motivated by a need for improved architecture abstractions. Language elements such as connectors and ports were introduced to address some problems. Other elements were enriched to improve their suitability; for example, UML components now share many features with classes, such as the ability to add interfaces and behavioral descriptions.
The result is that today’s 2. x versions of UML are better suited to documenting architectures than earlier versions, but there are still some gaps between UML and architecture abstractions, particularly for C&C views. This appendix focuses on guidance for documenting software architectures using UML, independent of whether UML is the best choice for each architecture documentation piece.
![]()
Section 3.4.3 discusses the problems with using UML concepts to represent C&C abstractions.
UML provides 14 types of diagrams divided into two categories: structure diagrams and behavior diagrams. Figure A.1 shows the hierarchy of UML 2.2 diagram types. For each concrete diagram type, the small icons indicate the kinds of information the diagram is better suited to convey.
Figure A.1 UML 2.2 diagram types

The meaning of any UML symbol can be further specialized by using stereotypes. A stereotype is a domain-specific or technology-specific label shown within guillemets (also known as “angle brackets”) that can be applied to existing UML elements and relations. The diagrams in this appendix use standard UML stereotypes where possible. However, several stereotypes are introduced to represent types of elements or relations specific to a style (such as <<layer>>).
![]()
The UML standard stereotypes are listed in Annex C of the UML specifications (version 2.2). The UML standard is maintained by the Object Management Group (OMG), and the specifications can be downloaded from uml.org.
A.2 Documenting a Module View
Module views show architecture structures where the elements are implementation units, or modules. Modules should be represented in UML as packages, classes, or interfaces. The following subsections describe how UML should be used to document different module styles and which UML symbols are most appropriate for showing modules and their relations in each style.
A.2.1 Decomposition Style
Modules, as described in Chapter 1, are typically represented in UML as packages or classes. In UML, decomposition of modules in submodules is shown by nesting packages, classes, or interfaces inside packages. Figure A.2 shows an example.
Figure A.2 UML packages and classes are used in decomposition views.

![]()
The module decomposition style is described in Section 2.1.
A.2.2 Uses Style
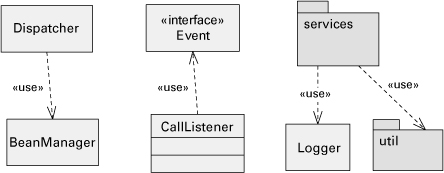
This style describes usage dependencies among modules. In UML, dependencies are shown using the dependency arrow. Use the UML usage dependency (<<use>>) to show usage between packages, classes, or interfaces in a uses view. Figure A.3 shows examples of uses relations in UML.
Figure A.3 UML dependencies are used in module uses views.
![]()
The uses style is described in Section 2.2.
A.2.3 Generalization Style
Modules in a generalization view should be represented using classes and interfaces. Generalization (is-a relation) between modules is shown in UML using the generalization (class inheritance) arrow. Another form of is-a relation, interface realization, is shown using the interface realization arrow. Figure A.4 shows an example.
Figure A.4 UML class inheritance (on the left) is used in generalization views. UML interface realization (on the right) is also a kind of is-a relationship.

![]()
The generalization style is described in Section 2.3.
A.2.4 Layered Style
UML doesn’t have a built-in notation for layers. Because a layer is a grouping of modules, the natural alternative is to use packages, stereotyped as <<layer>>. The allowed-to-use relation between layers should be shown as a stereotyped UML dependency. Figure A.5 shows an example.
Figure A.5 Stereotyped packages can represent layers in UML.

![]()
The layered style is described in Section 2.4.
A.2.5 Aspects Style
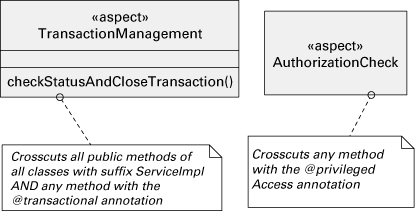
In aspect-oriented software development, a module that is responsible for a crosscutting concern (such as internationalization) is called an aspect. UML doesn’t have a built-in notation for aspects. You should use classes, stereotyped as <<aspect>>, to represent aspects. The crosscuts relation from aspects to classes, packages, and other aspects can be shown graphically using a stereotyped dependency arrow. However, because crosscuts relations are often numerous, a less-cluttered alternative is to use annotations to define what each aspect crosscuts. Figure A.6 shows an example.
Figure A.6 Aspects can be represented in UML as stereotyped classes. The crosscuts relation can be shown graphically or (to reduce visual clutter) with annotations.
![]()
The aspects style is described in Section 2.5.
A.2.6 Data Model Style
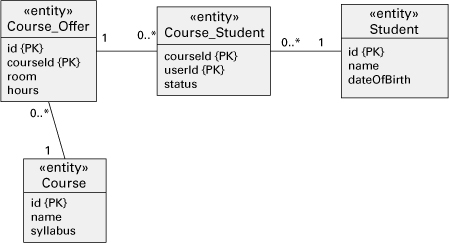
You should document a data model in UML using a class diagram. Classes should have the standard <<entity>> stereotype. A special constraint can be used to indicate the attributes that form the primary key (PK) of an entity. Figure A.7 shows an example.
Figure A.7 UML classes and their associations can be used for data modeling.
![]()
The data model style is described in Section 2.6.
Perspectives: UML Class Diagrams: Too Much, Too Little
You may have noticed that UML class diagrams can be used in nearly all of the module styles covered in Chapter 2, and you might conclude that a single class diagram can represent all your module views, and maybe more.
In fact, it can. UML class diagrams are a veritable semantic smorgasbord, able to show generalization, dependency, module decomposition, general entity-relationship information, aspect modules, and interface realization. Figure A.8 compiles the UML symbols for the elements and relations usually found in class diagrams.
Figure A.8 A summary of UML symbols used in module views.

Good, right? Class diagrams sound like the Rosetta Stone of architecture diagrams. What else do we need?
Well, plenty. First of all, using a single class diagram to represent all possible information undercuts the primary usefulness of views. Views give us different perspectives on the various architecture structures of a system, and one of the greatest sources of confusion in architecture diagrams is the unplanned, haphazard amalgamation of various kinds of information in the same diagram.
Of course, not every view needs to be primitive or stand by itself. A source of great clarity and insight in architecture documentation comes when a small number of views are carefully and consciously chosen to be wed, showing various kinds of information at once and how they overlap and interplay.
![]()
Section 6.6 explains how to choose and to document combined views.
But what is produced by using all the class diagram’s relations in a single view? The result would be the “inherits/depends-on/uses/data model/realizes/decomposition” view, which—unless your system were very small—would probably be too busy to read and too bewildering to understand. Instead, try to document the module views separately, using the restricted forms of class diagrams dictated by the module styles. Combine two views only if it makes sense to do so.
Are class diagrams rich enough to give us all we need in any module view? No. If your architecture is object-oriented, it’s natural to think of it first and foremost in those terms: a collection of classes instantiated as objects that interact at runtime. You might be wondering whether you really need to document your module view as anything but that. Maybe, you think, when push com‘es to shove, the only thing you give your architecture stakeholders is a set of UML class diagrams. But you need more.
First, trying to represent behavior with a class diagram is out of the question. You’ll need sequence diagrams, activity diagrams, state machine diagrams, or other behavior diagrams. Second, class diagrams—even as rich as they are—are fundamentally about attributes and operations of classes, and code relations. Class diagrams have no way to represent temporal information and are not suitable to capture design rationale, variability, data flow, context (what modules are external to the system), and other important information that should be recorded in a module view.
UML class diagrams are a foundational piece of notation for module-based views. But like all good tools, they aren’t for every job.
—D.G. and P.M.
A.3 Documenting a Component-and-Connector View
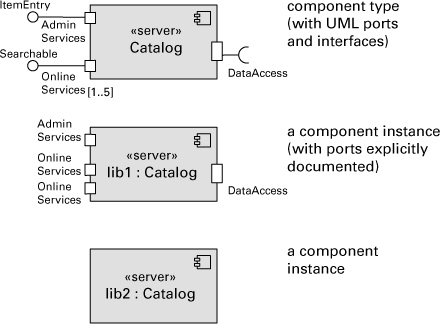
C&C components should be represented using UML component instances in object diagrams or component diagrams; C&C component types should be represented using UML components in a component diagram. Component types and instances should not be represented in the same diagram.
Component types and instances are distinguished in UML by the same convention used to distinguish classes and objects: names that do not include a colon (“:”) are types, and names that include a colon are instances, with the instance name appearing to the left of the colon and the type name appearing to the right of the colon. Anonymous instances can be documented by not including an instance name to the left of the colon and are typically used when there’s only one instance of that type or the instance name is not significant.
C&C component ports should be represented using UML ports. UML provided and required interfaces can be attached to ports to provide additional information, but this is usually done on component types, not instances. Ports should have an identifier and may have a multiplicity indicator.
![]()
To avoid ambiguity, always add UML ports to explicitly represent a component’s points of interaction. You should label those ports. If you think representing the ports in the diagram is not necessary (perhaps because each component has only one port), it’s OK to omit the UML ports and attach connectors directly to components. But use this simplification with caution, and consider mentioning your convention with a phrase in the diagram’s key.
Figure A.9 shows examples of representing a component type and instances. Components should be stereotyped to indicate the name of the corresponding component type from the style guide used for the view being documented. For example, in Figure A.9, the Catalog component type that is represented is a subtype of the server type defined in the client-server style in Chapter 4.
Figure A.9 Component type and instances represented using UML components. The type, Catalog, is a subtype of server from the client-server style. It uses UML ports and provided and required interfaces to document its ports. The Online Services port includes a multiplicity, constraining how many instances of that port may be on any instance of the Catalog component type. lib1 and lib2 are instances of the Catalog component type. lib1 includes explicit documentation of component ports, for example, specifying that it has two instances of the Online Services port. lib2 does not explicitly document its ports, leaving the number of instances of Online Services to be documented elsewhere.
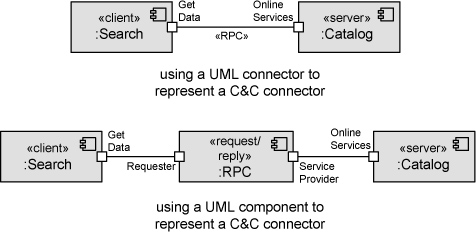
C&C connectors can be represented in a few ways in UML, largely depending on the amount of information you want to document in UML (as opposed to prose) or the degree to which you want to convey the connector’s semantics. The two primary options for representing a C&C connector are a UML connector and a UML component, as shown in Figure A.10.
1. A UML connector is an undecorated line. The connector’s type should be denoted by adding a stereotype that identifies it. Unfortunately, UML connectors cannot have substructure, properties, or behavioral descriptions, limiting what can be documented using UML. For example, because formal interfaces (like UML interfaces or ports) cannot be added, connector roles cannot be represented. Their presence can be indicated by labeling the connector ends. Alternatively, their presence can be inferred when attached to explicit component ports that unambiguously match a connector role.
2. A UML component, unlike a UML connector, can have substructure, properties, and behavioral descriptions, making it a better choice when such information needs to be documented for a C&C connector. UML ports are used to represent connector roles, just as they are used to represent component ports.
Figure A.10 C&C connectors represented using a UML connector and a UML component. In the top portion of this figure, a C&C connector is represented using a UML connector, with the type of the connector identified by the <<RPC>> stereotype. In the bottom portion, the same C&C connector is represented using a UML component. The type of C&C connector is identified in this case by the anonymous instance’s type name (:RPC), which is a subtype of the style guide provided <<request/reply>> type. The UML component version allows the connector’s roles to be explicitly represented using UML ports.
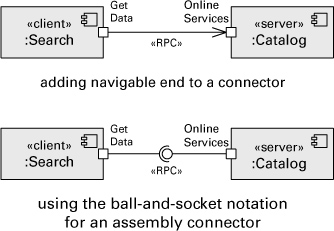
There are two variations on the UML connector strategy that can be useful in particular situations; these options are shown in Figure A.11.
• A navigable end (an arrowhead) can be shown on one end of a UML connector to identify a direction associated with an interaction. The documentation should identify the meaning of such arrowheads, as multiple interpretations are often possible (for example, does it represent the initiation of an interaction or the direction in which data is passed?). This option is less useful when connectors represent bidirectional interactions, such as protocols. Tool support, however, is not always available for this option (connector tool support in general is inconsistent). Instead, to use this option, you may have to use a UML association rather than a UML connector in order to add a navigable end.
![]()
See “Perspectives: Quivering at Arrows” on page 41, in the prologue.
• A UML assembly connector can be used in place of a simple connector. Assembly connectors are drawn using a ball-and-socket notation (the explicit connection of the provided and required interface symbols). This representation maps naturally to connectors between simple provided and required interfaces (such as simple call-return connectors). This option is less useful when connectors do not match a provided/required intuition (for example, when an input port of a filter in a pipe-and-filter architecture does not clearly map to either a provided or required interface) or when connectors represent bidirectional interactions.
Figure A.11 Two variations of using a UML connector to represent a C&C connector. The top variation uses a navigable end (the arrowhead) to convey the general direction of the interaction. The bottom variation uses the ball-and-socket notation for an assembly connector to convey the attachment to provided and required interfaces of component ports.
Simple representations, based on UML connectors, are good options when a connector has well-known semantics and implementations, such as procedure calls or data-read operations. When you need to do more than simply identify a connector type, a UML component representation is a good option. This option allows the explicit representation of connector roles, behavior, and substructure. However, some important properties can be represented without resorting to the use of UML components.
Tagged values can be used, as shown in Figure A.12, to associate attribute values with a UML connector. To use this approach, you create a stereotype for the connector type and define attributes that become associated with the stereotype. These attributes are called tagged values in UML and are shown in a comment box. Some UML tools allow you to create stereotypes (such as <<JMS>>) and define their attributes with name and data type (for example, queueID : String; capacity : integer; persistent : Boolean). Then each time the stereotype is used, the tool allows you to select the stereotyped element or relation and enter the values of the attributes in a properties box. In such cases, comment boxes will not appear in the diagram.
Figure A.12 C&C connectors can be represented as stereotyped UML connectors with tagged values. In this example the connector <<JMS>> represents the use of the Java Message Service, which allows you to define different kinds of message queues.

![]()
The relationship expressed by UML delegation connectors is called interface delegation and is described in Section 3.2.3. Nesting and interface delegation are how UML represents decomposition refinement, which is discussed in Section 6.1.1.
Component or connector substructure should be represented in UML using nested UML components and UML delegation connectors, as shown in Figure A.13. The UML components representing the substructure of a component (or connector) are nested within that UML component. The ports of the outer UML component are associated with the corresponding ports of the inner UML components using UML delegation connectors. A UML delegation connector is shown as a solid line with an open arrowhead. The arrowhead on a UML delegation connector should point inward when relating ports that are both “provides” ports, and point outward when relating ports that are both “requires.”
Figure A.13 Substructure of a UML component. Delegation connector arrows associate the external ports with ports of internal components.

![]()
The pipe-and-filter style is described in Section 4.2.1.
When documenting a specific C&C view in UML, you should use a stereotype to identify the type of each component and connector, ensuring a clear relationship to the component and connector types defined in the style guides used to create the view. If application-specific subtypes of these types have been defined, those types should be identified in the names of the instances (appearing to the right of the colon). For example, Figure A.14 shows a UML diagram of a pipe-and-filter view. Filters are represented as UML components with the <<filter>> stereotype, and pipes are represented as UML connectors with the <<pipe>> stereotype. These stereotypes associate each instance with its type from the pipe-and-filter style guide. Each filter is further associated with an application-specific subtype of filter, such as XmlToObject or Process Payment. The <<pipe>> stereotype defines four tagged values to indicate important properties of pipes.
Figure A.14 UML diagram of a pipe-and-filter view. Filters are shown as stereotyped UML components, and pipes are stereotyped UML connectors. Four tagged values (“capacity”, “end-of-data”, “when-full”, and “when-empty”) indicate important properties of each pipe.

A.4 Documenting an Allocation View
Allocation views present mappings between software elements (from module or C&C views) and environmental elements. Environmental elements are nonsoftware elements (such as hardware nodes) that are somehow associated to the software elements of the system being designed. This section provides guidance on how to document environmental elements in UML and the mappings between software and environmental elements.
![]()
When documenting a software element in any allocation view, be sure to use a UML representation that is consistent with how you represented that same element in another view. For example, if you document module TransactionMgr in a uses view with a class, do not represent the Transaction-Mgr module in an implementation view with a package.
A.4.1 Deployment Style
The environmental elements of a deployment view are hardware elements, such as processors, memory, and network elements. These elements can be represented in UML deployment diagrams using UML nodes. A node is a computational resource, such as a laptop computer, a server machine, a router, or a mobile device. Figure A.15 shows examples of nodes.
Figure A.15 UML nodes are used to represent hardware elements in a deployment view.

![]()
You should add a stereotype to each node to identify different categories of computing hardware, communication appliances, and other devices, as shown in Figure A.15.
To document a deployment view of your architecture, map the software elements (elements from a C&C view) to the nodes representing hardware elements in a UML deployment diagram. You can connect UML component instances to nodes using a nonstandard stereotyped dependency (such as <<allocated to>>), as illustrated in Figure A.16.
Figure A.16 Using a stereotyped dependency to show that a component is allocated (that is, deployed) to a specific node

In many cases your software system will have a large number of components deployed to the same hardware node. Trying to draw all these UML components connected to the nodes may clutter your UML deployment diagram. In that case, you may have to resort to documenting the complete allocation of components to nodes in a diagram annotation, in the element catalog of the view, or in a table that maps nodes to components.
Another alternative in representing the allocation of components to nodes is explicitly to represent the packaging of components into files (such as zip, setup, or jar files) for deployment. These files should be represented in a UML deployment diagram as artifacts. A UML <<artifact>> is a stereotyped class that typically represents a file, such as a script, executable, configuration file, bundle file, source file, XML file, or PDF document. The standard <<manifest>> stereotyped dependency indicates that a given element (such as a component) is manifested in an <<artifact>>; that is, the artifact contains the concrete physical representation of that element. UML also provides a stereotyped dependency, <<deploy>>, to indicate that an artifact is deployed to (that is, installed on) a node. Thus, we can show that a component is allocated to a node using an artifact as an intermediary. Figure A.17 shows three equivalent ways to represent that allocation in a UML diagram. The criteria to choose among these options include graphical convenience and support in the UML tool being used.
Figure A.17 Three UML alternatives that show a component that is packaged into an artifact and the node to which the artifact is deployed. In the first alternative (top), the <<manifest>> relation shows what components are encapsulated in an artifact, and the <<deploy>> relation shows what node an artifact is deployed to. In the second alternative (center), the association of components to artifacts is shown via <<manifest>>, and deployment of an artifact to a node is shown by nesting. In the third alternative (bottom), deployment of artifacts is shown separately by listing the names of artifacts inside a node (this notation is a shorthand for nesting artifacts inside nodes, but it is not supported by some UML tools).

Using the alternatives shown in Figure A.17 will lead you to a view that combines the deployment and the install styles. This is because a UML deployment diagram includes some information you would typically find in an install view. For example, a deployment file in a UML deployment diagram is not an element of the deployment style as described in Section 5.2, but rather the install style, as described in Section 5.3.
![]()
Section 6.6 discusses combined views.
Deployment views often also show the communication channels between hardware elements. In a UML deployment diagram, nodes are connected to each other by communication paths, as shown in Figure A.18. These paths can have stereotypes to distinguish different kinds of communication channels (such as Internet, LAN, wireless, HTTP). Multiplicity can be used to indicate the number of instances of the node at each end of the communication path.
Figure A.18 UML nodes are connected by communication paths that can optionally show multiplicity.

![]()
Figure 5.3, in Section 5.2.4, is an example of a UML deployment diagram.
A.4.2 Install and Implementation Styles
The environmental elements that are the focus of the install and implementation styles described in Chapter 5 are files and directories. These elements can be represented by UML artifacts, which are found in UML deployment diagrams. In an install view, the software elements mapped to the UML artifacts will typically be UML components in a C&C view. In an implementation view, the software elements will typically be classes or packages that are the modules in a module view of the architecture.
To show that a given software element is mapped to a UML artifact, we use the same <<manifest>> stereotyped dependency discussed for the deployment style. This <<manifest>> relationship represents that the artifact contains the concrete physical representation of the software element.
The containment relation that exists for files and directories in the install and implementation styles can be shown for UML artifacts by nesting the artifacts.
![]()
The implementation style is described in Section 5.5. The install style is described in Section 5.3.
Implementation views typically show the tree structure of files and folders in the development environment; install views show the tree structure of the installed application. A UML artifact naturally represents a file, but not a folder (directory), in the file system. An alternative is to create a stereotype to specialize the standard UML artifact to represent a file system directory. Figure A.19 is an example of an install view using regular artifacts for files and stereotyped <<dir artifacts>> for folders.
Figure A.19 Simple example of a UML diagram for an install view

A.4.3 Work Assignment Style
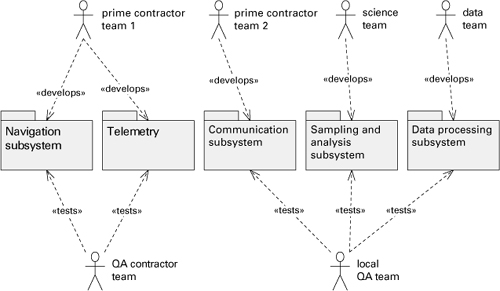
In the work assignment style, the environmental elements are people or organizational units. The software elements are modules. UML doesn’t have a diagram type that is intended to show work assignment information. However, if you choose UML, you should represent a work assignment view with a package diagram, using actors and packages. Figure A.20 shows a simple example. The packages represent modules from a module view, and the actors are the organizational units you’re assigning the work to. Stereotyped dependencies indicate the activities being assigned.
Figure A.20 Simple example of work assignment shown with UML symbols
Advice: Avoid UML Ambiguity Traps
UML offers some very wide-ranging modeling constructs, many of which have semantics that are open to broad interpretation. That makes it easy to create UML diagrams that, while correct, fail to convey your architectural decisions with precision or (worse) convey the wrong notion altogether. Four cases warrant special admonition:
• Overusing class diagrams. This topic is covered separately in the sidebar “UML Class Diagrams: Too Much, Too Little,” in Section A.2.6.
• Using dependency arrows in a C&C diagram. It is possible to use a UML dependency to represent a connector with an arrow. This is a bad idea! Dependency is a relation typically found in a module view to depict a static relation between code elements, not in a C&C view, where relations represent runtime interactions. A dependency arrow in a C&C view may cause confusion by making your view look like a combination (an unintentional one) of C&C views and module views. Plus, depends on is usually just the wrong concept for a C&C view. Architects tend to use this arrow when they want to imply directionality, as in a pipe-and-filter view, to show flow of information. But the whole point of that style is to create an architecture where the filters are independent of each other. Depends on is exactly the wrong thing to say (and draw) in a pipe-and-filter view.
• Careless use of associations. In a module view of the architecture, you may find modules represented as UML classes with UML associations between them. A navigable association from X to Y usually means that X and Y can interact in some way, and/or the state of an X object contains one or more (depending on the multiplicity) references to Y objects. Figure A.21 is an example of a UML class diagram with associations. We have observed that architects sometimes use association (improperly, in our opinion) to signify a uses relation. Before you use an association to connect classes in a module view, ask yourself whether the association represents just a uses relation. If it does, represent it using a <<use>> dependency instead. If it doesn’t, make sure it’s clear to the stakeholders what the associations represent.
Figure A.21 Examples of UML associations between classes. Cardinality (multiplicity) is indicated by a numeric label at the association end (“*” represents “many”). The hollow diamond indicates an aggregation association, which is a logical part-whole relation. An association may imply a usage dependency relation in the direction of the navigability arrow.

• Using types instead of instances. Figure A.22 shows a component type (Catalog) being deployed to a hardware node. Although UML allows this, what does it mean? It might mean that all instances of the type are deployed to the node, or any one instance, or one particular instance, or something else. You can use a type name as shorthand for one or more instances—as long as you explain it. If you take this option, add an explanation to the diagram’s key to say what you mean.
Figure A.22 Allocating a component type to a node

Ambiguities like these should be avoided wherever possible for the benefit of all stakeholders of the documentation.
A.5 Documenting Behavior
UML offers a wide variety of diagram types to model system behavior. Many of them are mentioned in Chapter 8 in this book. Behavior diagrams complement the structure diagrams found in module, C&C, and allocation views. For instance, a UML class diagram showing classes and packages and their usage dependencies can be the primary presentation of a uses view. A sequence diagram can describe the behavior of the modules (classes in the class diagram) when executing a specific trace or scenario. Table A.1 summarizes the types of behavior diagrams available in UML and when to use each one.
Table A.1 UML behavior diagram types

The following subsections give a brief overview of each type of UML behavioral diagram and show the most useful symbols used in each diagram.
A.5.1 Activity Diagram
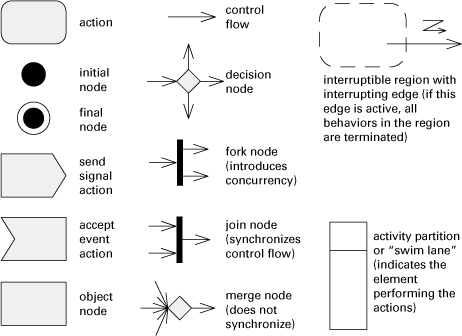
UML activity diagrams are flow charts. You should use them to describe the sequence of actions performed in a given business process of the system. They are particularly useful to describe business flows that involve concurrency (that is, actions executed in parallel). Figure A.23 shows symbols commonly used in UML activity diagrams.
Figure A.23 Symbols used in UML activity diagrams
![]()
Section 8.3.2 describes UML activity diagrams as a behavioral notation.
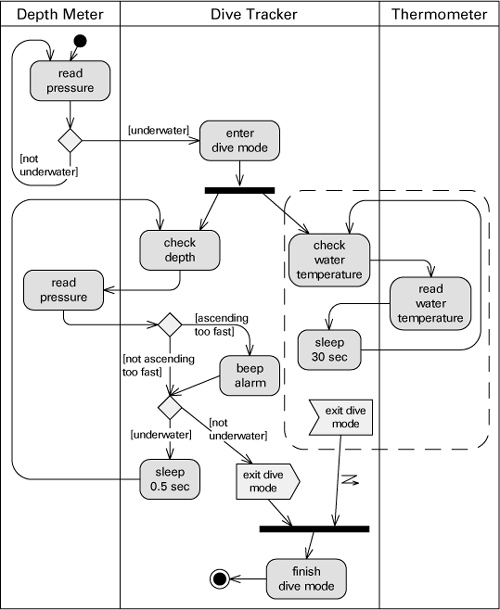
When using an activity diagram to describe the behavior of the system, you can indicate which architecture element performs each action using activity partitions (“swim lanes”). If there is an interaction between two swim lanes, there should be a relation or connector between the corresponding architecture elements in the primary presentation where these elements are defined. Figure A.24 shows an example of an activity diagram. In this example, Depth Meter, Dive Tracker, and Thermometer could be modules from a module view or components from a C&C view.
Figure A.24 Example of a UML activity diagram. It shows the flow of activities performed by a simple diving computer that registers depth of the diver (based on the water pressure) and the water temperature. Depth Meter, Dive Tracker, and Thermometer are architecture elements.
A.5.2 Sequence Diagram
The UML sequence diagram should be used to describe graphically the sequence of interactions among architecture elements in a particular trace or scenario of the system. The participants in a sequence diagram are UML objects. These participants may be instances of UML classes that are modules in a module view, or UML component instances from a C&C view. If the sequence diagram shows a message from one participant to another, there should be a <<use>> dependency or a connector between the corresponding classes or components in the module or C&C view, respectively.
The basic notation for sequence diagrams is shown in Figure A.25. There are also different types of frames that can be used to organize the diagrams and express conditional flows and loops. Figure A.26 shows some of the different kinds of frames available. Figure A.27 shows the notation for timing constraints, parallel traces, and coregions, which are useful to describe behaviors in systems with strict deadlines and concurrent tasks.
Figure A.25 Basic notation for UML sequence diagrams actor

Figure A.26 Some of the frames available in the UML sequence diagram notation
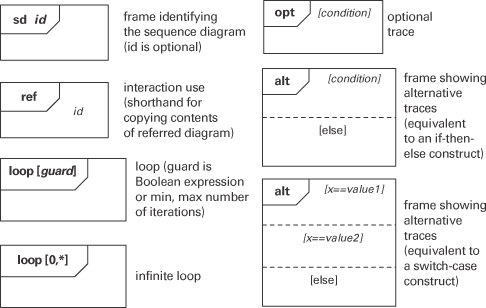
Figure A.27 UML sequence diagram notation for timing constraint, parallel traces, and coregions

![]()
Chapter 8 has some examples of sequence diagrams (see Figures 8.4 and 8.5). Another example can be found in the software architecture document that accompanies this book online at wiki.sei.cmu.edu/sad/index.php/Workflowmanager_Module_Uses_View.
Sometimes an object receives a call when it’s already executing another call. This reentrant call is represented by an overlapping execution occurrence bar, as shown in Figure A.28.
Figure A.28 Showing reentrant calls in a UML sequence diagram

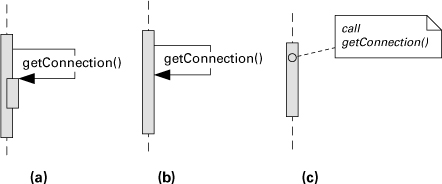
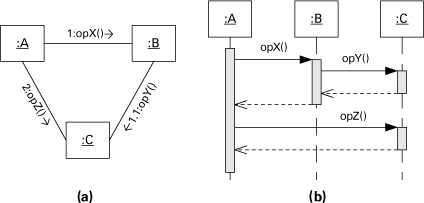
A special case of a reentrant call is when the object makes a call to itself. The notation for self calls is not defined in the UML specifications. A common alternative is to use an overlapping execution occurrence and a self message (see Figure A.29(a)). Showing the new execution occurrence is especially useful if you want to indicate other calls that are made within that execution. A valid simplification is to show the self message but omit the overlapping execution occurrence bar (Figure A.29(b)). The third alternative, also valid, is to simply indicate in a comment box that an internal call takes place at that point (Figure A.29(c)).
Figure A.29 Options to show self calls in a UML sequence diagram
A.5.3 Communication Diagram
Akin to sequence diagrams, communication diagrams should be used to describe the sequence of interactions among architecture elements in a specific trace or scenario. The architecture elements may be objects (instances of classes from a module view) or component instances from a C&C view. The notation for UML communication diagrams is straightforward, as shown in Figure A.30.
Figure A.30 Basic notation for UML communication diagrams

![]()
Section 8.3.1 contains a subsection about communication diagrams, with an example.
A communication diagram shows a particular trace. There is a line between two objects if they interact in that trace. The line is labeled with an arrow, an operation name, and a number 1, 2, 3, and so on, to indicate the order of the interactions. In reality the numbering is not that simple. If an operation call is number n in the sequence and if the execution of that call triggers another call, this new call will be numbered n.1. If there’s a third nested call, it will be n.1.1, and so forth successively. Once all nested calls within the execution of n are complete, call n+1 takes place. Figure A.31 illustrates this idea, showing a simplistic communication diagram on the left and the equivalent sequence diagram on the right.
Figure A.31 Notional example of communication diagram and corresponding sequence diagram that illustrates how calls are numbered in a communication diagram
A.5.4 Timing Diagram
A UML timing diagram is particularly useful when you need to describe how the architecture elements interact and change state along a strict time line, as in real-time systems. A timing diagram is a trace-oriented notation; that is, each diagram depicts the behavior of the architecture for a particular trace or scenario.
![]()
Section 8.3.2 describes the difference between trace-oriented and comprehensive model notations.
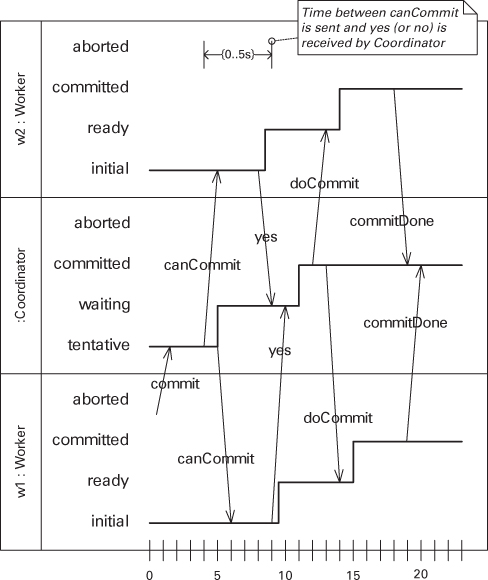
A timing diagram shows the state changes of one or more objects along a horizontal time scale. These objects may represent modules from a module view or component instances from a C&C view. If the diagram shows multiple objects, in addition to state changes, the timing diagram can display the messages between objects that cause state changes. The diagram can also display duration constraints to emphasize particular timing restrictions. Figure A.32 gives an example of a timing diagram.
Figure A.32 Example of UML timing diagram showing the state changes and messages for a successful “commit” transaction in the two-phase commit protocol when there are two participants (workers). A duration constraint indicates the coordinator can wait up to 5 seconds for the “yes” (or “no”) response from a worker.
A.5.5 Interaction Overview Diagram
UML interaction overview diagrams can be used to describe behavior in architecture views that show interactions of large-scale elements. They are useful to compose existing sequence diagrams, communication diagrams, and other interaction diagrams.
The interaction overview diagram uses the basic notation of activity diagrams to show a composition of work flows; the actions in an interaction overview diagram are replaced with interaction diagrams or references to interaction diagrams (defined elsewhere in the documentation). An interaction diagram (see Figure A.1) can be a sequence diagram, a communication diagram, a timing diagram, or an interaction overview diagram. Thus, an interaction overview diagram can have decision diamonds, initial and final nodes, and fork and merge nodes for concurrency. However, instead of rounded rectangles for actions, we have frames that either define an interaction diagram inline or reference an existing one. Figure A.33 is an example of an interaction overview diagram where two interaction diagrams (sequence diagrams in this case) are shown inline, and two other interaction diagrams are referenced.
Figure A.33 Example of an interaction overview diagram for the automatic updates feature of an ATM

A.5.6 State Machine Diagram
State machine diagrams should be used to model the behavior of architecture elements or groups of elements that go through multiple states and transitions that are clearly identifiable. A state machine can describe possible states and transitions for modules from a module view, components from a C&C view, hardware elements or communication channels from a deployment view, and so on. The UML notation for state diagrams is very rich. In addition to the basic symbols for states and transitions, the notation allows the representation of other useful information, such as the following:
• Initial and final (pseudo-) states.
• Composite states, which are states that have one sub-state machine or multiple concurrent sub-state machines (multiple regions).
• A history (pseudo-) state that represents the fact that a substate machine “remembers” its last state when control comes back to it. A history state has a transition to the “default” state that becomes active when the sub-state machine is entered for the first time.
• Guard constraints on transitions. When the event that fires a transition occurs, the transition is enabled only if the guard constraint evaluates to true.
• Entry and exit actions on states, which represent behavior that is executed when the state is entered or exited, respectively.
• Effect on a transition, which is behavior executed when the transition fires.
![]()
Chapter 8 discusses UML state machines as a notation for behavior documentation. Figures 8.8 and 8.9 in that chapter show other examples of UML state machine diagrams.
Figure A.34 shows the basic elements of the UML notation for state machine diagrams. Figure A.35 is an example of a state machine diagram.
Figure A.34 Notation for UML state machine diagrams

Figure A.35 UML state machine diagram for a car stereo that has an AM/FM tuner and a CD player. The events correspond to the user action of pressing the power, eject, “FM AM,” or “CD” button, or inserting a disc. The history states tell that the FM tuner is activated when the stereo is turned on for the first time, and from then on the system will remember whether the radio (FM or AM) or the CD was playing last.

A.5.7 Use Case Diagram
You should create use case diagrams to specify the features, operations, or actions available in the system, that is, what the system is supposed to do. The actors involved in each use case are also indicated. Actors are human or nonhuman entities outside the system. A typical use case does not show architecture elements but rather an overview of the behavior the system provides. Thus, use cases frequently capture the functional requirements for a system.
![]()
Section 8.3.1 discusses use cases as a notation for behavior documentation. Figure 8.2 is an example of use case diagram.
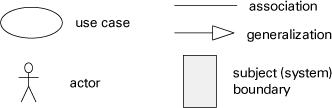
The basic notation for use case diagrams consists of use case ovals and actors, and straight lines to show the associations of actors to use cases. You can draw a rectangle around a group of use cases to demarcate the functionality of a subject (a system or subsystem). It’s also possible to use generalization to show hierarchies of actors or use cases. Figure A.36 shows the basic notation for use case diagrams.
Figure A.36 Symbols used in UML use case diagrams
Two relations that can be specified between use cases are these:
• Extend. If use case A extends use case B, the behavior specified by A is conditionally inserted into B. Imagine that use case B has an extension point where use case A can be “plugged in.” If a certain condition—often specified in a comment note—is true, use case A is executed. Use case B remains independent of A. Figure A.37 shows an example.
Figure A.37 On the left is an example of the extend relation in a UML use case diagram. The behavior in “Reset password” is conditionally inserted into an appropriate spot in “Sign in,” but “Sign in” remains independent of “Reset password.” On the right is an example of the include relation. Behavior in “Print receipt” is inserted into the behavior of “Withdraw” and “Deposit”—they depend on the execution of “Print receipt.”
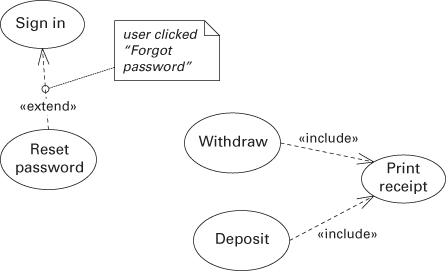
• Include. The behavior of the included use case is inserted into the including use case(s). The included use case is not optional and the including use case depends on it. An included use case can be used to factor out behavior that can be reused by multiple use cases. Figure A.37 shows an example.
A.6 Documenting Interfaces
Architectural elements of different kinds have interfaces across which they interact and communicate with each other. Interfaces of modules and components are represented differently in UML.
Module interfaces should be documented using UML provided and required interfaces. When a module provides (that is, realizes or implements) an interface, this should be depicted as a provided interface in UML (a lollipop symbol). An interface can also be represented in UML as a stereotyped class, which makes it easier to see operations and attributes of the interface. A realization arrow is used to indicate that a given module provides that interface. Figure A.38 shows both alternatives for depicting provided interfaces.
Figure A.38 Two alternatives for showing in UML that an interface (IObservable in this example) is provided (that is, realized or implemented) by a class (NavigationSystemStatus)

![]()
Chapter 7 discusses the documentation of software interfaces. Section 7.2.1 provides advice on how to represent interfaces in diagrams, including UML diagrams.
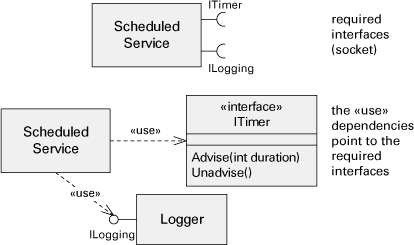
To indicate that a module requires an interface, you should use a UML required interface (a socket symbol) attached to the class representing the module. It is common to avoid documenting required interfaces as sockets; instead, a provided interface can be represented by drawing a <<use>> dependency from the module requiring the interface to that interface. Figure A.39 shows both options.
Figure A.39 Two alternatives for showing in UML that an interface is used (that is, required) by a class
Interfaces in C&C views are called ports (component interfaces) and roles (connector interfaces). Component ports should be represented using UML ports, optionally augmented with UML interfaces (both provided and required, as for modules). A port can include any number of provided and required interfaces, in any combination. UML interfaces can be attached to a port when you want to indicate the operations or attributes provided or required at that port. Ports can also include a multiplicity (typically only on component types), restricting how many occurrences of that port can be found on any corresponding instance.
![]()
Section 3.4.3 has an advice box about representing components, ports, and connectors in UML.
OCL is an OMG standard, and the specifications can be found at omg.org/spec/OCL.
Representing connector roles is more difficult in UML. When connectors are represented using UML connectors, UML ports cannot be used. Instead, roles can be at best identified by labeling the connector ends. When connectors are represented using UML components, however, UML ports can be used to represent roles (just as for component ports).